
On October 30, 2019, federal officials released results from the 2019 National Assessment of Educational Progress, or NAEP, in reading and mathematics for grades 4 and 8. Education Next asked a series of education-policy thinkers to share initial reactions to the results and thoughts about their implications.
State NAEP rankings largely stable, even as reading scores drop

Nationwide, student performance on the National Assessment of Educational Progress rarely changes more than a point or two over the two years between test administrations. The 2019 scores, released today, bucked that trend in 8th-grade reading, where the average score dropped by four points. The reading skills of today’s 8th graders are comparable to their counterparts of 10-20 years ago. Results were relatively stable otherwise. Fourth-grade reading and 8th-grade math scores were down slightly, while 4th-grade math scores posted a small increase.
States’ relative NAEP performance was also similar to recent years. The demographically adjusted scores published by the Urban Institute show that Florida, Massachusetts, New Jersey, and Texas all posted top-5 performance on three out of four tests. Students in all of these states have scored well compared to their demographic peers on recent NAEP administrations.
The drop in 8th-grade reading scores affected the majority of states, with no states posting a statistically significant increase (only the District of Columbia did). But state rankings were as stable between 2017 and 2019 as they were between 2015 and 2017 (with a year-to-year correlation of 0.90 in both pairs of years).
Change is generally more interesting than stability, and there are certainly examples of states moving up and down the rankings between 2017 and 2019. The table below shows the top and bottom five states in terms of their improvement (or decline) in the demographically adjusted rankings across all four NAEP tests. Four of the five states that moved up most in the rankings are in the South, compared to none of those in the bottom (which are otherwise spread across the country).
State rankings on demographically adjusted NAEP scores, 2017 and 2019
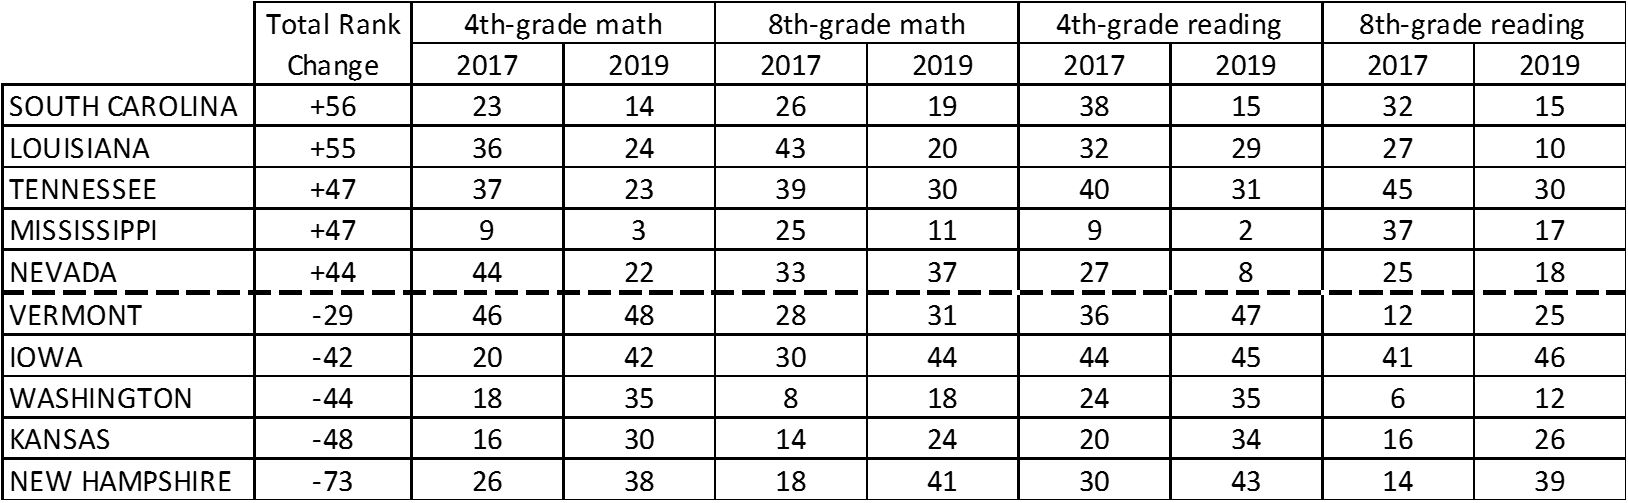
Source: America’s Gradebook, Urban Institute, http://apps.urban.org/features/naep/. Washington, D.C. was not included in this analysis.
K-12 education policy is largely a state and local issue, with the federal government providing less than 10 percent of funding. This makes it all the more surprising and perplexing to see widespread changes in performance on one of the tests in just a two-year period. It’s possible that it’s partly a fluke, similar to the 3-point drop on the 8th-grade reading test between 2013 and 2015 that was partially reversed by a 2-point gain between 2015 and 2017. But we will have to wait two more years to find out.
Matthew M. Chingos is vice president for education data and policy at the Urban Institute.
Shame on us

As I predicted a week ago, the NAEP results for 2019 are stagnant.
But what’s most disappointing is that the nation has gone nowhere in the last ten years. It’s truly been a lost decade.
Look at 4th grade math, for example. Scale scores rose to 240 in 2009 from 226 in 2000, yet they went up only one point from 2009 to 2019. In 8th grade math, scores went up to 283 in 2009 from 273 in 2000; yet, they declined 1 in 2019 from 2009.
In 4th grade reading, scores went up 8 points between 2000 and 2009; yet, they declined 1 between 2009 and 2019. 8th grade reading has been flat throughout the entire period.
Most worrisome, however, has been the trend in recent years of drops in performance among low performing students. All this, after we saw very good gains with them from 2000 to 2009. The only group to experience more than marginal gains in recent years has been students in the top 10th percentile. The surmise has to be that the gap narrowing we saw in the 2000s may have turned into gap widening in the 2010s.
Finally, while we saw good drops in “below basic” and increases in “proficient” from 2000 to 2009, there was virtually no improvement in either category from 2009 to 2019.
As I said in my preview, this picture is in no way surprising. We’ve done nothing this decade that should have moved the dial. We have a national policy called Every Student Succeeds, yet there’s really nothing in that policy that demands or even incentivizes changes in the status quo that would likely yield success.
We don’t insist upon or promote practice proven to increase achievement. We don’t generally tie increased funding to what works. We haven’t altogether abandoned the elements of accountability, but neither have we kept it strong or made it work better. We continue to encourage some constructive choice but not enough, or effectively, to generate much in the way of gains.
Bottom line: everyone claims to care about education. But, if NAEP, the nation’s yardstick, is to be believed, and I think it should be, we don’t care enough about it to have made any gains in 10 years.
Shame on us; yet how much of a story will our national failure be? And after the newspapers covering this story become kitty litter, will anything change?
When President George W. Bush and Senator Edward Kennedy sat together and pledged to shake things up, you sort of had the feeling something would change, and for the better. Who’s having such conversations today?
Sandy Kress, a lawyer, was senior education adviser to President George W. Bush.
An Agincourt-level disaster

Shakespeare’s Henry V includes a scene in which the young King of England reads off a list of casualties his army inflicted upon the French after the Battle of Agincourt, including a long list of French nobles. “Here was a royal fellowship of death…” Henry notes grimly. This scene comes to mind when reviewing the 2019 NAEP, and states are generally not alas playing the role of Henry.
More on that in a bit. I made three predictions before the release of the 2019 NAEP: that nationally scores would continue to stagnate, that the impact of the 2018 educator strikes would appear in the data, and that a statewide black student cohort would exceed a statewide average score for white students on the same test/year. It looks like my caffeine-fueled oracle got two out of three: nationally scores continued to stagnate, and a black subgroup finally surpassed a white subgroup for the first time. Congratulations to black students in Massachusetts, who not only exceeded the statewide average score for the lowest scoring statewide average for white students on 8th-grade reading, but also moved into a tie with Arizona for the highest average score for Black students on 8th-grade math.
The evidence on strikes at first glance appears inconclusive. Some jurisdictions like West Virginia and Los Angeles had very rough results. Other places without strikes also had rough results, and some of the jurisdictions with strikes like Arizona and Oklahoma had mixed results.
Special education results, on the other hand, are an Agincourt-level disaster.
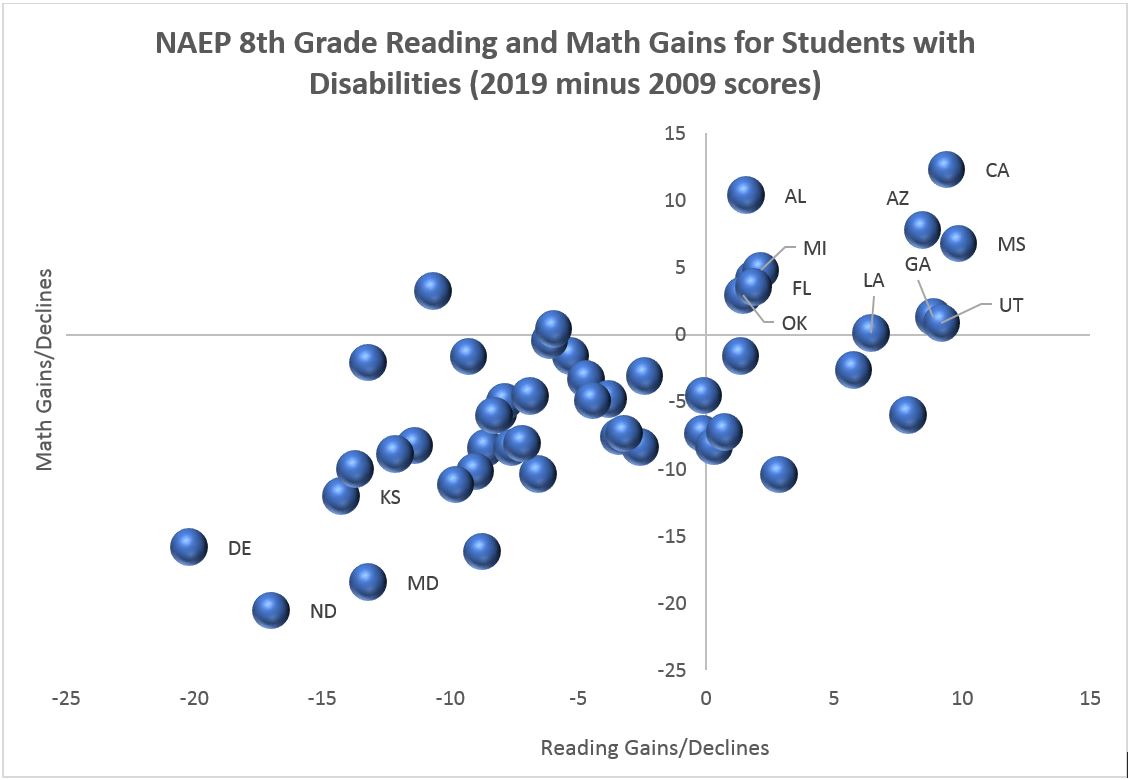
NAEP has been given to all states since 2003. After 16 years this is what each state has to show for it in terms of 8th grade math and reading gains. On these tests students make approximately 10 points worth of progress on average per year between 4th and 8th grade. Mind you that the United States spends high but has older students who score low on international exams, so most states had enormous room for improvement in 2003, especially among children of color:
| NAEP 8th Grade Math and Reading Gains (2019 minus 2003 scores) | ||
| Math | Reading | |
| Alabama | 7 | 0 |
| Alaska | -5 | -4 |
| Arizona | 9 | 4 |
| Arkansas | 9 | 1 |
| California | 9 | 8 |
| Colorado | 1 | 0 |
| Connecticut | 2 | 3 |
| Delaware | 0 | -5 |
| Florida | 7 | 6 |
| Georgia | 10 | 5 |
| Hawaii | 10 | 7 |
| Idaho | 6 | 2 |
| Illinois | 5 | -2 |
| Indiana | 4 | 1 |
| Iowa | -2 | -5 |
| Kansas | -2 | -3 |
| Kentucky | 4 | -3 |
| Louisiana | 5 | 4 |
| Maine | 0 | -3 |
| Maryland | 2 | 3 |
| Massachusetts | 8 | 0 |
| Michigan | 4 | -2 |
| Minnesota | 0 | -4 |
| Mississippi | 13 | 1 |
| Missouri | 2 | -4 |
| Montana | -2 | -5 |
| Nebraska | 3 | -2 |
| Nevada | 6 | 6 |
| New Hampshire | 1 | -3 |
| New Jersey | 10 | 3 |
| New Mexico | 5 | 0 |
| New York | 1 | -4 |
| North Carolina | 2 | 1 |
| North Dakota | -2 | -6 |
| Ohio | 4 | 0 |
| Oklahoma | 5 | -4 |
| Oregon | -1 | 0 |
| Pennsylvania | 6 | 0 |
| Rhode Island | 4 | 1 |
| South Carolina | -1 | 1 |
| South Dakota | 2 | -7 |
| Tennessee | 12 | 4 |
| Texas | 3 | -3 |
| Utah | 4 | 3 |
| Vermont | 1 | -2 |
| Virginia | 5 | -6 |
| Washington | 5 | 2 |
| West Virginia | 2 | -4 |
| Wisconsin | 5 | 1 |
| Wyoming | 3 | -2 |
No state managed to notch a double-digit gain in both math and reading during these sixteen years. Plenty of states saw declines in scores. Once more unto the breach dear friends…
Matthew Ladner is executive editor of RedefineEd.
Focus on the lowest-performing students

Now that the NAEP scores are out, we can turn our attention from the prediction to interpretation, a place of much surer footing for me. While headlines are emphasizing the lack of progress in average scores – ‘No Progress’ Seen in Reading or Math on Nation’s Report Card,” EdWeek or, “A ‘Disturbing’ Assessment: Sagging Reading Scores, Particularly for Eighth Graders, Headline 2019’s Disappointing NAEP Results,” The74 – the story to me is the continued fall in achievement of our lowest-performing students.
Our high scorers have not seen meaningful dips. In fact, their scores have increased across the board over the last decade. In 2009, the highest ten percent of students scored an average of 264 and 305 in 4th and 8th grade reading, respectively. In 2017 those numbers were up to 267 and 310. While in 2019 these numbers dipped slightly to 266 and 309, they still show an increase relative the 2009 scores. Similarly, in math in 2009, the highest ten percent of students scored an average of 275 and 329 in 4th and 8th grade reading, respectively. In 2017 those numbers were again up to 279 and 333. In 2019 these numbers were 280 and 333, still showing an increase relative the 2009 scores.
However, for the lowest ten percent of students, scores have dropped across the board. The scores were 175 and 219 in 4th and 8th grade reading in 2009; by 2017 they had dropped to 171 and 219; and, over the past two years, they dropped further to 168 and 213. In math, the trends are similar: the scores were 202 and 236 in 4th and 8th grade math in 2009; dropping to198 and 233 in 2017 and dropping even lower at 199 and 231 in 2019.
The falling performance of the lowest scoring students is not inevitable. In the early 2000s, we saw greater gains for this group relative to the highest-performing students, whose scores also rose but at not as high a rate. These gains were evident in both 4th and 8th grade and in both math and reading. So what did we do at the start of the 21st century that we are no longer doing? We are not focusing as much attention on the students who are struggling the most, and we are not focusing as much attention on the schools serving the most struggling students. The No Child Left Behind Act set unreasonable expectations for schools – that all students should reach proficiency as defined by their state. As a result, it is no surprise that the waivers to NCLB and the subsequent Every Student Succeeds Act pulled backed on those requirements. Yet, it is also no surprise that the cost of these changes is felt by the lowest-performing students. For these students to maintain their prior gains and to see increased achievement in future years, we’ll need to bring the focus back to them. We can do so with better standards and with a broader view of the full set of capabilities students need to be successful in life and to contribute their broader community. However, without this focus, these students, in particular, are likely to suffer across the range of outcomes we care about.
Susanna Loeb is professor of education at Brown University and director of its Annenberg Institute.
Time for a return to accountability

In the first decade of the 21st Century, white, black and Hispanic student performance was on the rise, but in the second debate those gains have ground to a halt, with even hints of decline in reading.
The shift corresponds almost exactly with the abandonment of effective enforcement of the accountability system put into place by No Child Left Behind.
Clearly, now is the time to put accountability policy back on the nation’s educational agenda.
Paul E. Peterson is the Henry Lee Shattuck Professor of Government and director of the Program on Education Policy and Governance at Harvard University, a senior fellow at the Hoover Institution at Stanford University, and senior editor of Education Next.
Bright spots amidst the gloom

Alas, it wasn’t hard to predict that this year’s results from the National Assessment of Educational Progress would be bleak. With the lingering effects of the Great Recession still serving as powerful headwinds against progress, it would have taken a miracle to see big gains at the national level. Truthfully, I expected worse news for 4th graders, given how poorly they did upon entry to kindergarten; in reality, though, it turned out to be 8th grade where the news was most dismaying.
But demography need not be destiny, and economic correlations have their limits: A few jurisdictions bucked the overall trends and showed improvement. Washington, D.C., deserves much of the attention, given its ability to demonstrate sustained and significant progress over time, and its decade-plus commitment to fundamental reform. Yet even D.C. comes with a demographic asterisk, given the rapidly changing population of the nation’s capital. It’s also true that, in many ways, the Great Recession skipped D.C.; let me encourage analysts in coming days to figure out how much credit should go to the schools and how much belongs to economic and social conditions.
There’s no need to caveat the other star of this year’s release, Mississippi. For a decade now, the long-suffering Magnolia State has been on an upward trajectory, especially in reading. That appears to be no coincidence. It has one of the very best early-literacy initiatives in the country, and has been quietly and methodically implementing the Common Core standards without much commotion. The same goes for neighboring Louisiana, which has been a leader in curriculum-based reform. Let this be a note to state superintendents elsewhere: If Mississippi and Louisiana can overcome the “local control” arguments and develop deep and meaningful efforts to assist districts with teaching, learning, and curriculum implementation, so can you.
Two more bits of good news are worth highlighting. First, large urban districts continue to close the gap in achievement with the rest of their respective states. Perhaps that’s because their own demographics are becoming more similar to outlying areas, as poor families head to the suburbs and more middle-class families head back into town. But it’s also consistent with what we found in Fordham’s recent study of charter school market share: As the charter sector has grown, it has brought a rising tide that appears to have lifted all boats.
Finally, we should keep an eye on the gains we’re seeing at the top of the performance spectrum. Perhaps that, too, is being driven by socioeconomics and could be related to rising income inequality. But I have another hypothesis: That the shift to higher academic standards, tougher tests, and accountability systems that encourage paying attention to everybody’s progress may be working, at least for our higher-achieving students. Perhaps more of them are gaining access to instruction that’s actually and appropriately challenging. If so, that’s worth celebrating—but it means we need to double down on our efforts to identify ways to help their lower-achieving peers benefit from the higher expectations, as well.
It’s the troubling truth that America’s academic progress as a whole remains extremely disappointing. That it doesn’t have to be that way is also true, however, as illustrated by the handful of states and districts that are making notable gains. Let us follow their lead.
Michael J. Petrilli is president of the Thomas B. Fordham Institute, research fellow at Stanford University’s Hoover Institution, and executive editor of Education Next.
Results make case against ‘‘more of the same”

It turns out that when you make a provocative prediction for the purposes of not being boring, you’re often wrong! That was thankfully the case here. There doesn’t seem to have been widening of achievement gaps between Hispanic and other students. In fact, Hispanic students were the only racial/ethnic group to make a statistically significant gain (about a point) in 4th grade math, and they also made relative gains in 4th grade reading (where white and black students declined but Hispanic student stayed the same). In 8th grade reading Hispanic students did tick down a point more than white students did, however. So while racism remains one of the defining characteristics of this presidency, it at least appears this has not dramatically negatively affected the achievement of Hispanic youth.
The broader question of what to take away from these results is a tough one. I don’t think there’s any way to look at the results and think the last decade has been a good one for student achievement in U.S. schools. I read this stagnation as an indication that the broad reform agenda we have pursued over this time—the new generation of “college and career ready” standards coupled with weak accountability, the rise and fall of teacher evaluation that never really resulted in many teachers being removed, the continued expansion of choice policies of all types—are unlikely to take us where we want to be. Even though some of the downturn in performance is undoubtedly due to effects of the 2008 recession, there just is not much reason to be optimistic that doing more of the same will really make a difference.
So what do I think would make a difference? I’d propose an agenda that involved a) large spending increases (both across-the-board and targeted) to draw and keep stronger teachers in the classroom, b) equity-oriented redistribution of funds to schools serving the most disadvantaged students, c) dramatic strengthening of the state’s role in supporting standards implementation through curriculum, and d) a return to a more aggressive accountability (though this time based on multiple measures and emphasizing student growth) that intervened sharply in underperforming schools. Of course, there’s no constituency for these kinds of reforms right now—at least not the full package of them—so my guess is another half decade of the same is where we’re headed.
Morgan Polikoff is associate professor of education at USC Rossier School of Education.