On October 30, federal officials will release results from the 2019 National Assessment of Educational Progress, or NAEP, in reading and mathematics for grades 4 and 8. In anticipation of the test scores, Education Next asked a series of education-policy thinkers to share what the news later this month may be.
Past Is Prologue

There’s an old saying that the best predictor of tomorrow’s weather is today’s weather. The same is true of student performance: it tends to be relatively stable from one year to the next. For example, 4th-grade math scores on the National Assessment of Educational Progress have not changed by more than 2 points (on a 500-point scale) between biannual test administrations since 2005.
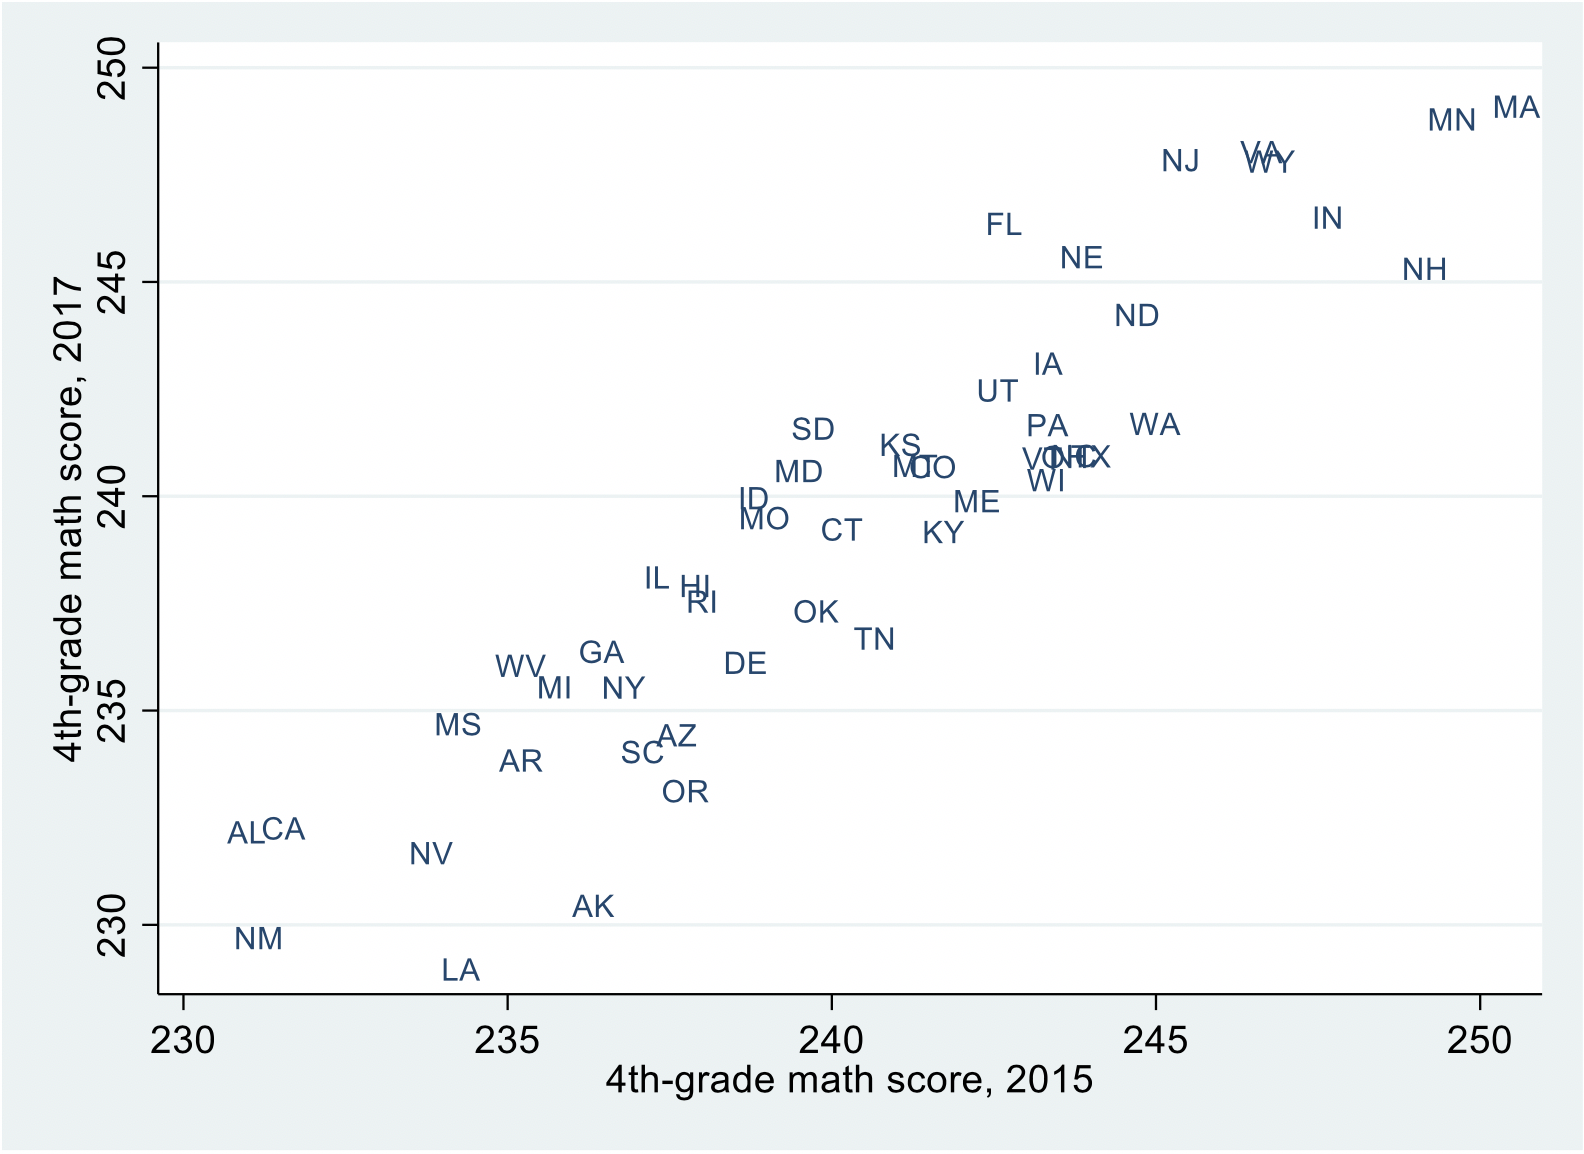
The same is true of individual states’ performance on NAEP: it tends to change little over short periods of time. The figure below shows that high-scoring states in 2015 tended to post high scores in 2017, and low-scoring states tend to post low scores in both years. (States sometimes make larger gains over longer periods of time.)
Given past data, it’s not exactly going out on a limb to predict that the 2019 results will yield a similar ranking of state performance, and overall performance will not change by more than a point or two.
State average scores on the 4th-grade math NAEP (unadjusted), 2015 and 2017
 Source: America’s Gradebook, Urban Institute, http://apps.urban.org/features/naep/.
The state-by-state scores that come out later this month will get a lot of attention, but the discussion too often ignores the wide differences in student populations across states. For example, the child poverty rate varies widely, from 8 percent in New Hampshire to 30 percent in New Mexico.
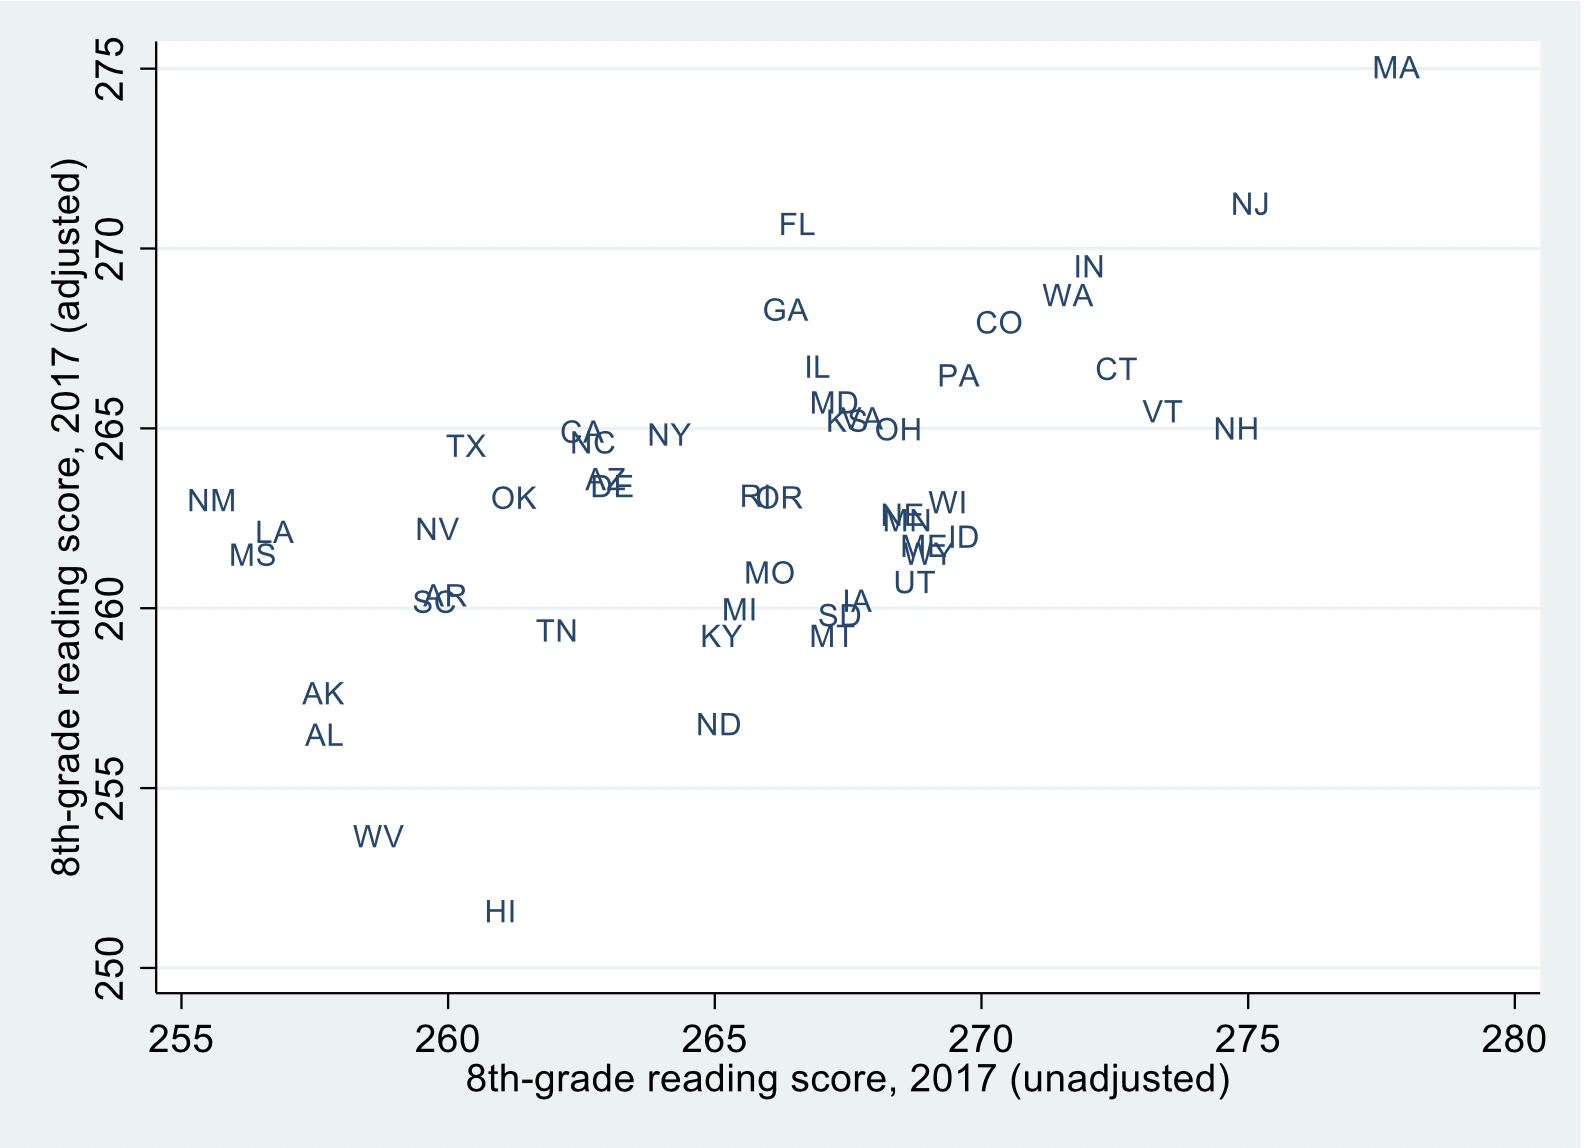
To provide a more useful comparison of performance across states, my Urban Institute colleagues and I publish demographically adjusted NAEP scores, which reflect how well students in each state score relative to demographically similar students around the country. The adjustment takes into account student age, race/ethnicity, frequency of English spoken at home, special education status, free or reduced-price lunch eligibility, and English language learner status.
The figure below shows that states where students outperform their demographic peers on the 8th-grade reading test do not always have the highest unadjusted scores. Massachusetts and New Jersey are in the top two spots on both measures, but Florida jumps from 25th in the official NAEP ranking to 3rd in the adjusted ranking.
Adjusted and Unadjusted scores on the 8th-grade reading NAEP, 2017
 Source: America’s Gradebook, Urban Institute, http://apps.urban.org/features/naep/.
Which states will perform the best on the 2019 NAEP, accounting for demographic factors? The adjusted scores are also quite stable from year to year, so the 2017 data provide some guide.
Looking across all four tests, Massachusetts and New Jersey were the only two states to rank in the top 5 across the board in 2017 (adjusting for demographics). Massachusetts has won this “quadruple crown” every year since 2003 (the first year NAEP gave all four tests together), so it seems likely to repeat this feat in 2019. New Jersey was top-5 across the board only once before 2017 (in 2007, although it was top-5 on three out of four tests in the intervening years), so might not do it again in 2019.
There will likely be states that produce surprisingly promising or disappointing results in 2019, but these movements are hard to predict. And Urban’s demographic adjustment might shift a bit, as we update our methodology to reflect differences in how student poverty is measured across states. But the safest bet is that scores will remain largely the same.
Matthew M. Chingos is vice president for education data and policy at the Urban Institute.
Relative Stability (Or Stagnancy)

I see no basis for increases in NAEP overall, at the 4th-grade and 8th-grade levels, in either reading or math. Nor do I see a basis for gap narrowing.
On the other hand, I see no reason to believe either that there will be a significant drop in achievement.
In other words, I’m predicting relative stability (or stagnancy) in the results.
Here’s why: Of all the causes of increases in the past, none appears to be broadly operative in the last several years.
We’ve seen no major change in federal or state policy. Indeed, all analyses I’ve seen of state plans under the Every Student Succeeds Act suggest staying the course at best and timidity and backward steps at worse.
I see no broad application of quality, research-based practices proven to lift achievement. I see no alteration in spending patterns to apply more dollars to activities or practices proven to lift achievement. I see no meaningful, substantial, or serious policies or practices that lead to a narrowing of achievement gaps.
On the other hand, I see no wholesale abandonment of the policies and practices that may have contributed to improvement in achievement or the narrowing of gaps.
Bottom line: ESSA represented tepid policy that neither advanced or challenged the status quo nor broadly rejected the reforms of the earlier era. Thus, since the drivers of results are almost entirely what they’ve been since 2011, it would be highly surprising to see any major change in the direction of student learning metrics.
Sandy Kress, a lawyer, was senior education adviser to President George W. Bush.
Strike Effects Will Be Felt

Greeks of antiquity consulted the oracle of Apollo for predictions about the future. The rituals involved the use of drugs and inhalation of mind-altering vapors among other things, like sacrificing a goat. Apparently in combination these rituals inspired the oracle with the ability to make cryptic predictions with multiple possible interpretations—a handy skill when you don’t actually know much about the future.
The request to make predictions about the new NAEP data puts me in a dilemma similar to that of the oracle. NAEP results act like an oblong ball that bounces in unpredictable ways, and moreover we have limited understanding of the policy factors influencing trends and even less understanding of the non-policy factors. Some of the things we think we know are probably mistaken, and we don’t agree on what we think is known.
Accordingly, I’ve decided to employ a modernized Delphic method. I’ll spare the goat and I’m not much for inhaling vapors but having consumed massive amounts of my drug of choice, caffeine, I will dare a few predictions.
Prediction 1: America continues to play in its academic food.
The 2009 to 2017 period proved broadly disappointing nationally. The country saw no progress in 4th-grade math or reading during this period, nor in 8th-grade math. The national average for 8th-grade reading improved by three points. In short, meh to sub-meh improvement.
Few states escaped the stagnation gravity well. Arizona and Mississippi students, though, did demonstrate statistically significant gains on all six NAEP exams given after 2009 (4th-grade and 8th-grade math and reading 2009 to 2017, and 4th-grade and 8th-grade science 2009 to 2015).
Staring deeply into the prophetic clouds in my coffee, I’ll predict that the average state fails to reach a net +2 for the full 2009 to 2019 period. I hope to be wrong on this prediction.
Prediction 2: The 2018 strikes will leave a mark in the data.
Labor actions closed schools in 2018 in West Virginia, Oklahoma, Arizona, Los Angeles, Colorado, and North Carolina. These strikes varied in length and breadth. Of course, we’ll never know what the 2019 NAEP scores would have been if these strikes had not occurred. Apollo’s caffeinated whispers, however, lead me to believe that kids learn more when they are in school than when they aren’t, and that many schools adhere to “make up time” rules in a half-hearted fashion if at all. It won’t be possible to establish causality and we would expect to find a mixed bag of results in these jurisdictions regardless, but a curious pattern of bubbles in my London Fog leads me to believe that a fairly consistent (negative) pattern may emerge. Again, I hope I am wrong on this one.
Prediction 3: Achievement gap milestone breached in the 2019 NAEP.
No state’s black student population has ever matched or exceeded the score for any state’s white population on any NAEP exam. The racial achievement gap has been deep enough that even the highest statewide average for black students has never matched that of the lowest performing statewide average for Anglo students. But…it has been getting close in recent years.
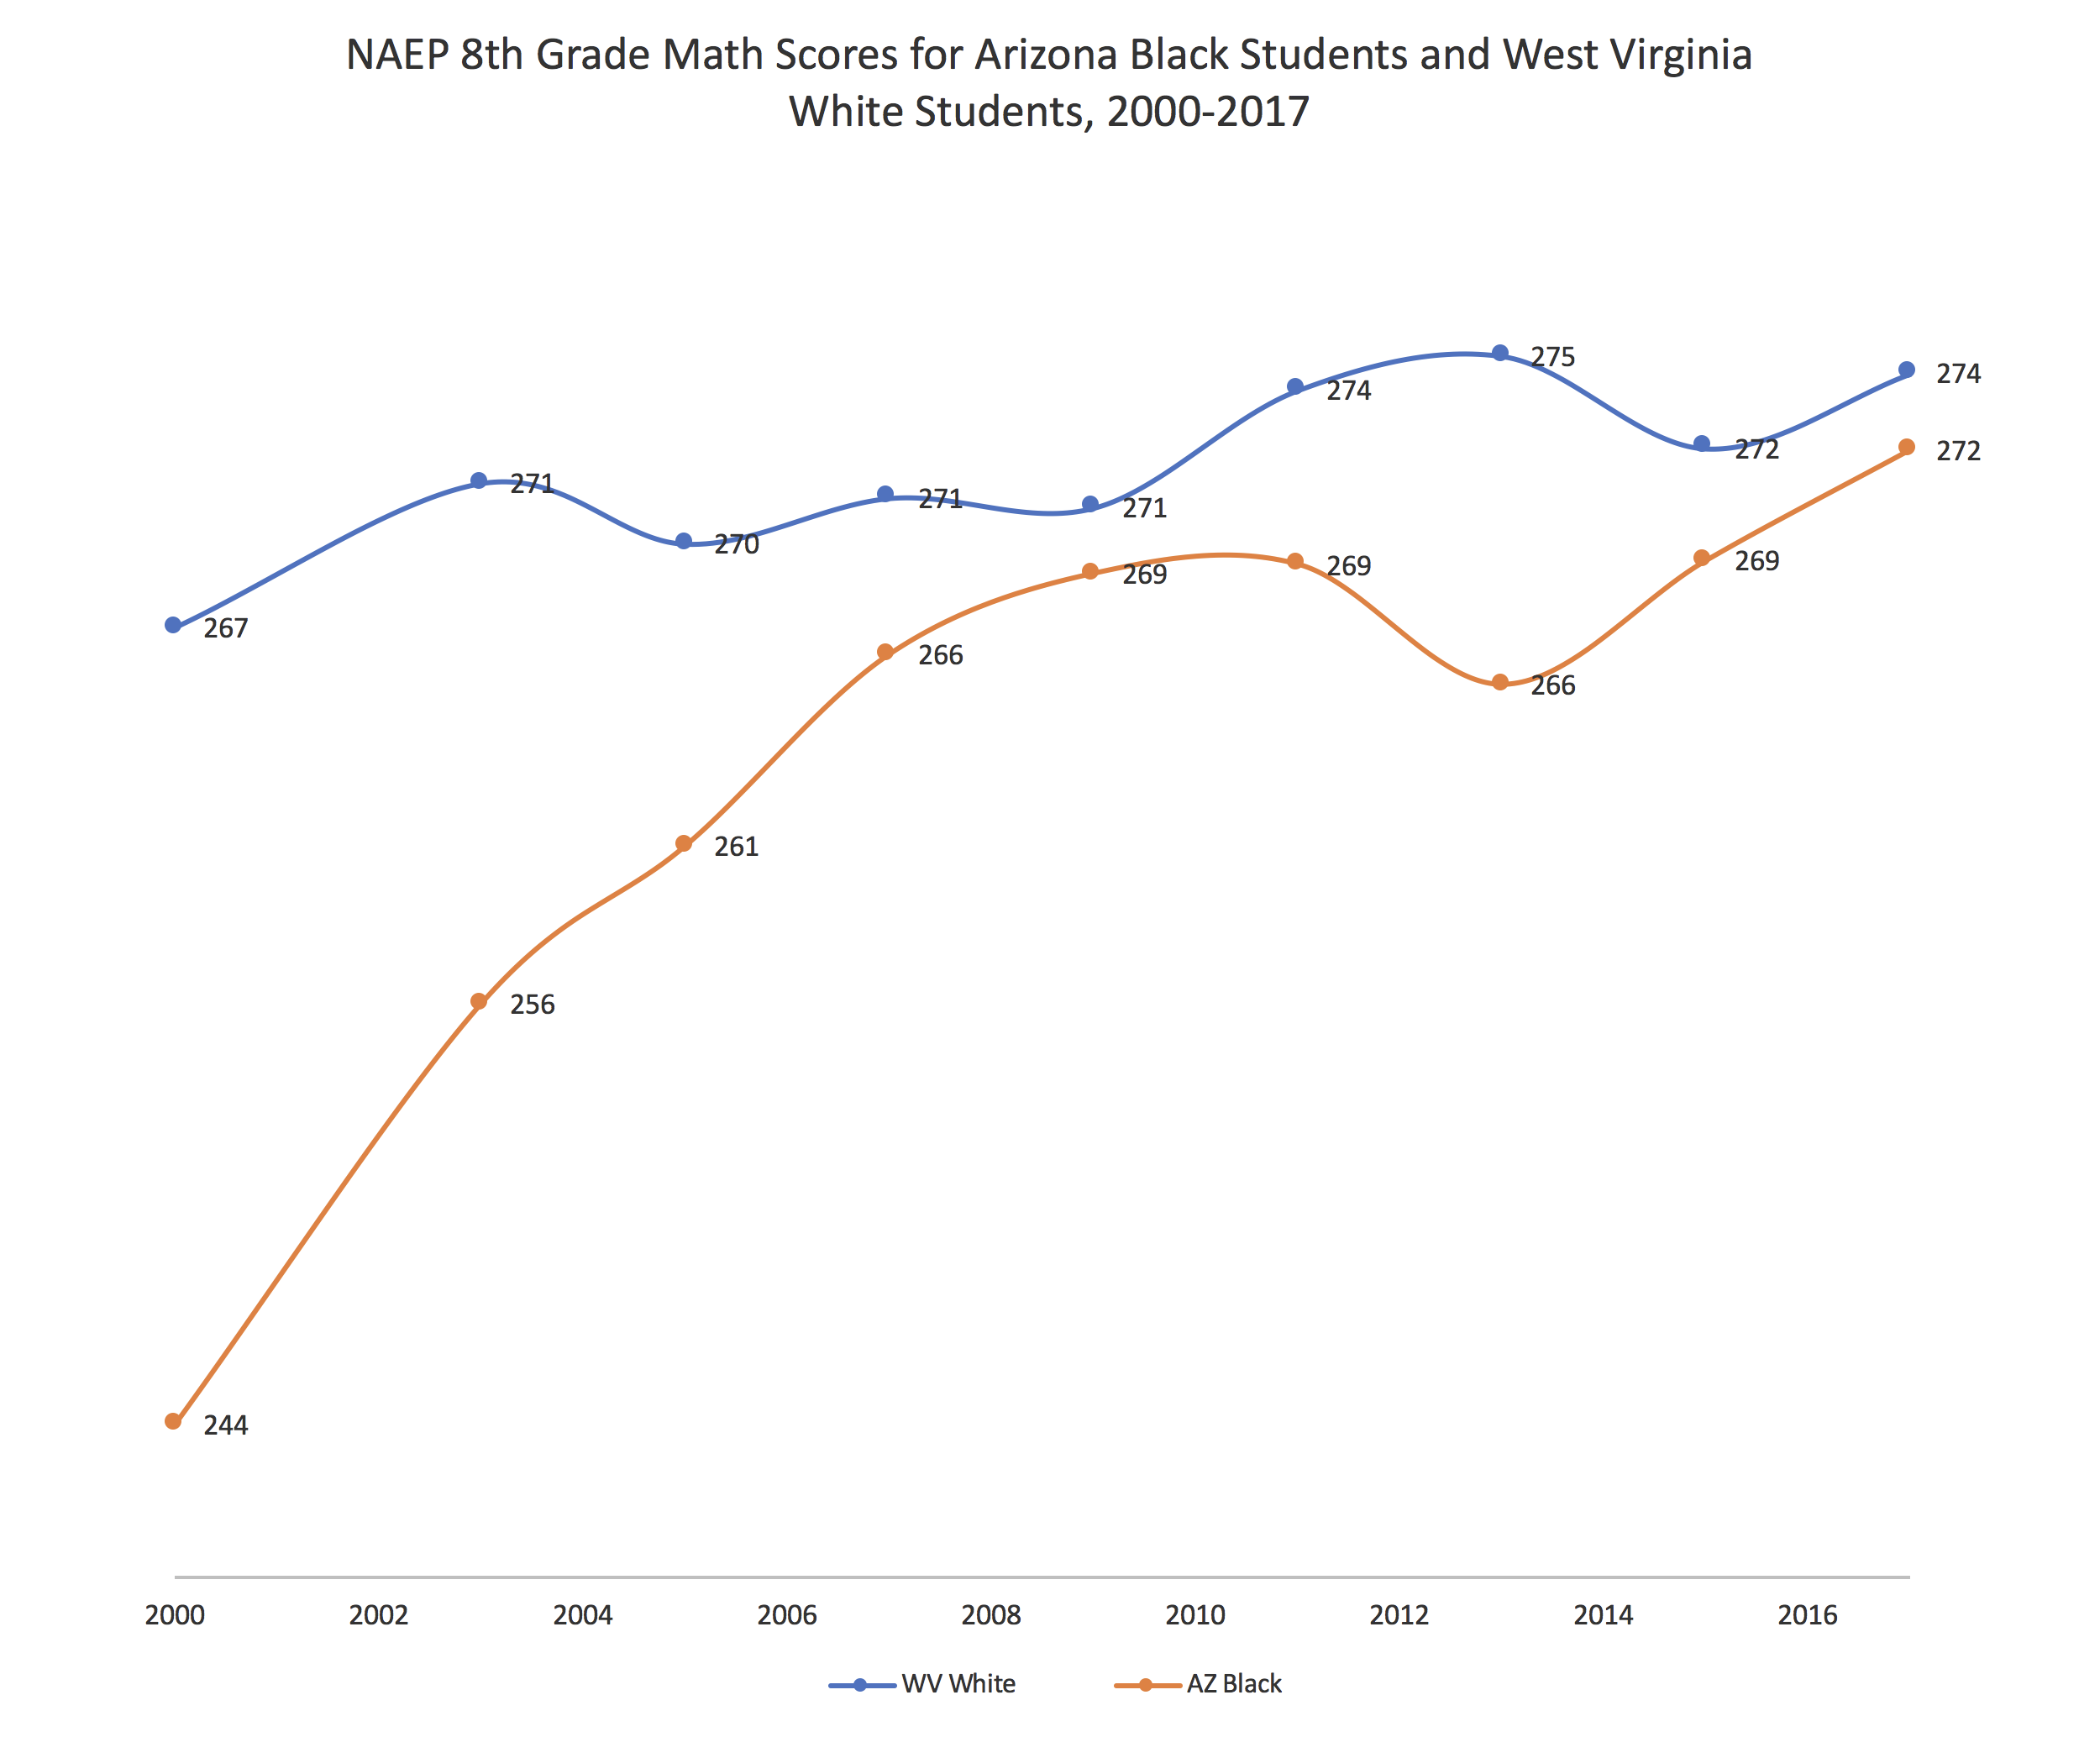
Arizona has had the highest performing African American student population, and their NAEP scores have improved strongly over time. The two-point gaps seen in both 2009 and 2017 were very close. Scores for both West Virginia Anglos and Arizona black students may take a hit in 2019 (both states experienced strike-related school closures), but this may not prevent the lines from crossing. Apollo sends word: 2019 will be the year where the highest performing black statewide group will bank a statewide average NAEP score higher than the lowest performing Anglo statewide average. Which is not at all to say that this is high enough, but it is an important milestone we have yet to cross. I hope I am right on this one!
Matthew Ladner is executive editor of RedefineEd.
Gains from Common Core, Losses from Lowest Performers

While the idea of making any prediction gives me the shivers (who likes to be wrong?), making predictions about NAEP results seems like a relatively safe endeavor. The best prediction about the NEAP results would perennially be, “yeah, so it’s going to look a lot like last year,” because, inevitably it does. Sure, some states or subgroups rise a bit and some fall, but overall, the country is not making the types of rapid increases in student learning that anyone would find satisfying.
That said, if I take off my glasses and squint hard at these tea leaves, I’m willing to make two small predictions.
First, I am optimistic that states that stayed the course with Common Core implementation and put some resources into building capacity in line with the standards will now realize some gains, after what likely could have been the traditional dip in scores we see from new standards and curricular implementation. One likely candidate is Louisiana, a state that has undertaken major efforts to encourage the adoption of high-quality curricula aligned to Common Core but saw its fourth graders’ scores decline on the 2017 NAEP.
Secondly, last time I wrote about the worrying pattern that while the gains in test performance in the early 2000s were driven by particularly strong gains for the lowest performing students, that pattern seemed to be reversing. I continue to worry that this year’s results will send an even stronger signal that insufficient investments are being made in the lowest performing students to help them gain the knowledge and skills that they need to flourish.
Susanna Loeb is professor of education at Brown University and director of its Annenberg Institute.
“Progress”? Mostly Not

White, black, and Hispanic student performance on the NAEP advanced substantially in the first decade of the 21st Century but publication of the 2019 results will show that those gains have slowed to a virtual halt in the second decade (2009-2018).
During the first decade (2000 to 2009) white students advanced a solid 13 points in 4th- grade math; black and Hispanic students moved upward by an impressive 18 points. Smaller but still substantial gains were made by all three ethnic groups in 4th-grade reading and 8th-grade math.
Those halcyon days have come to an end. During the period between 2009 and 2015, no math gains at all were registered by white 4th graders. Meanwhile, black students in 4th grade ground out gains of only 2 points, and Hispanic student performance ticked upward by only 3 points. If one looks at the reading test in 4th grade and the 8th-grade tests, one also finds the most trivial of gains.
Why did the advances of the first decade disappear during the second? Was it the rapid halt to effective enforcement of NCLB policy? The adverse effects of the recession? The resurgence of teacher union activism? Or the distractions of the cell phone?
The why question will be debated, but there can be little doubt that NAEP will show, once again, almost none of the “progress” that its title promises.
Let me qualify this prediction somewhat. I expect Hispanic and Asian student performance to outpace any gains registered by black and white students. Despite adult worry about immigrants, the young people from these ethnic backgrounds are demonstrating the reality that undergirds America’s equal educational opportunity dream.
Paul E. Peterson is the Henry Lee Shattuck Professor of Government and director of the Program on Education Policy and Governance at Harvard University, a senior fellow at the Hoover Institution at Stanford University, and senior editor of Education Next.
The Long Shadow of the Great Recession

There’s a saying in the investing world: “The trend is your friend.” In other words, if you want to predict the future direction of the market, especially in the short term, the safest bet is for the current trend to continue. (Amateur weather forecasting works much the same.)
So it is with the National Assessment of Educational Progress. It’s highly likely that the 2019 results will look a lot like those from 2017, and that no trend line will change course in any dramatic way. And that’s bad news, unfortunately, because the recent trend line, for most grades and subjects and subgroups, is flat or even down slightly.
So that’s what I expect to see when the reading and math scores are released later this month: flat or down in both subjects.
I’ve also become convinced over time that these disappointing outcomes are to some extent related to the Great Recession and its aftermath. Kirabo Jackson made a compelling case two years ago that the spending cuts that schools experienced earlier this decade might have depressed student achievement. If so, he predicted, we wouldn’t see improvements until 2019 or even 2021 given how long it took for education spending to recover.
This summer I floated the further hypothesis that economic conditions at the time of a cohort’s birth might be related to their later achievement. That was good news during the booming 1990s, which might have led to the rapidly improving NAEP scores of the 2000s, especially for our poorest and lowest-achieving students.
The “below basic in fourth grade reading rate” versus the supplemental child poverty rate
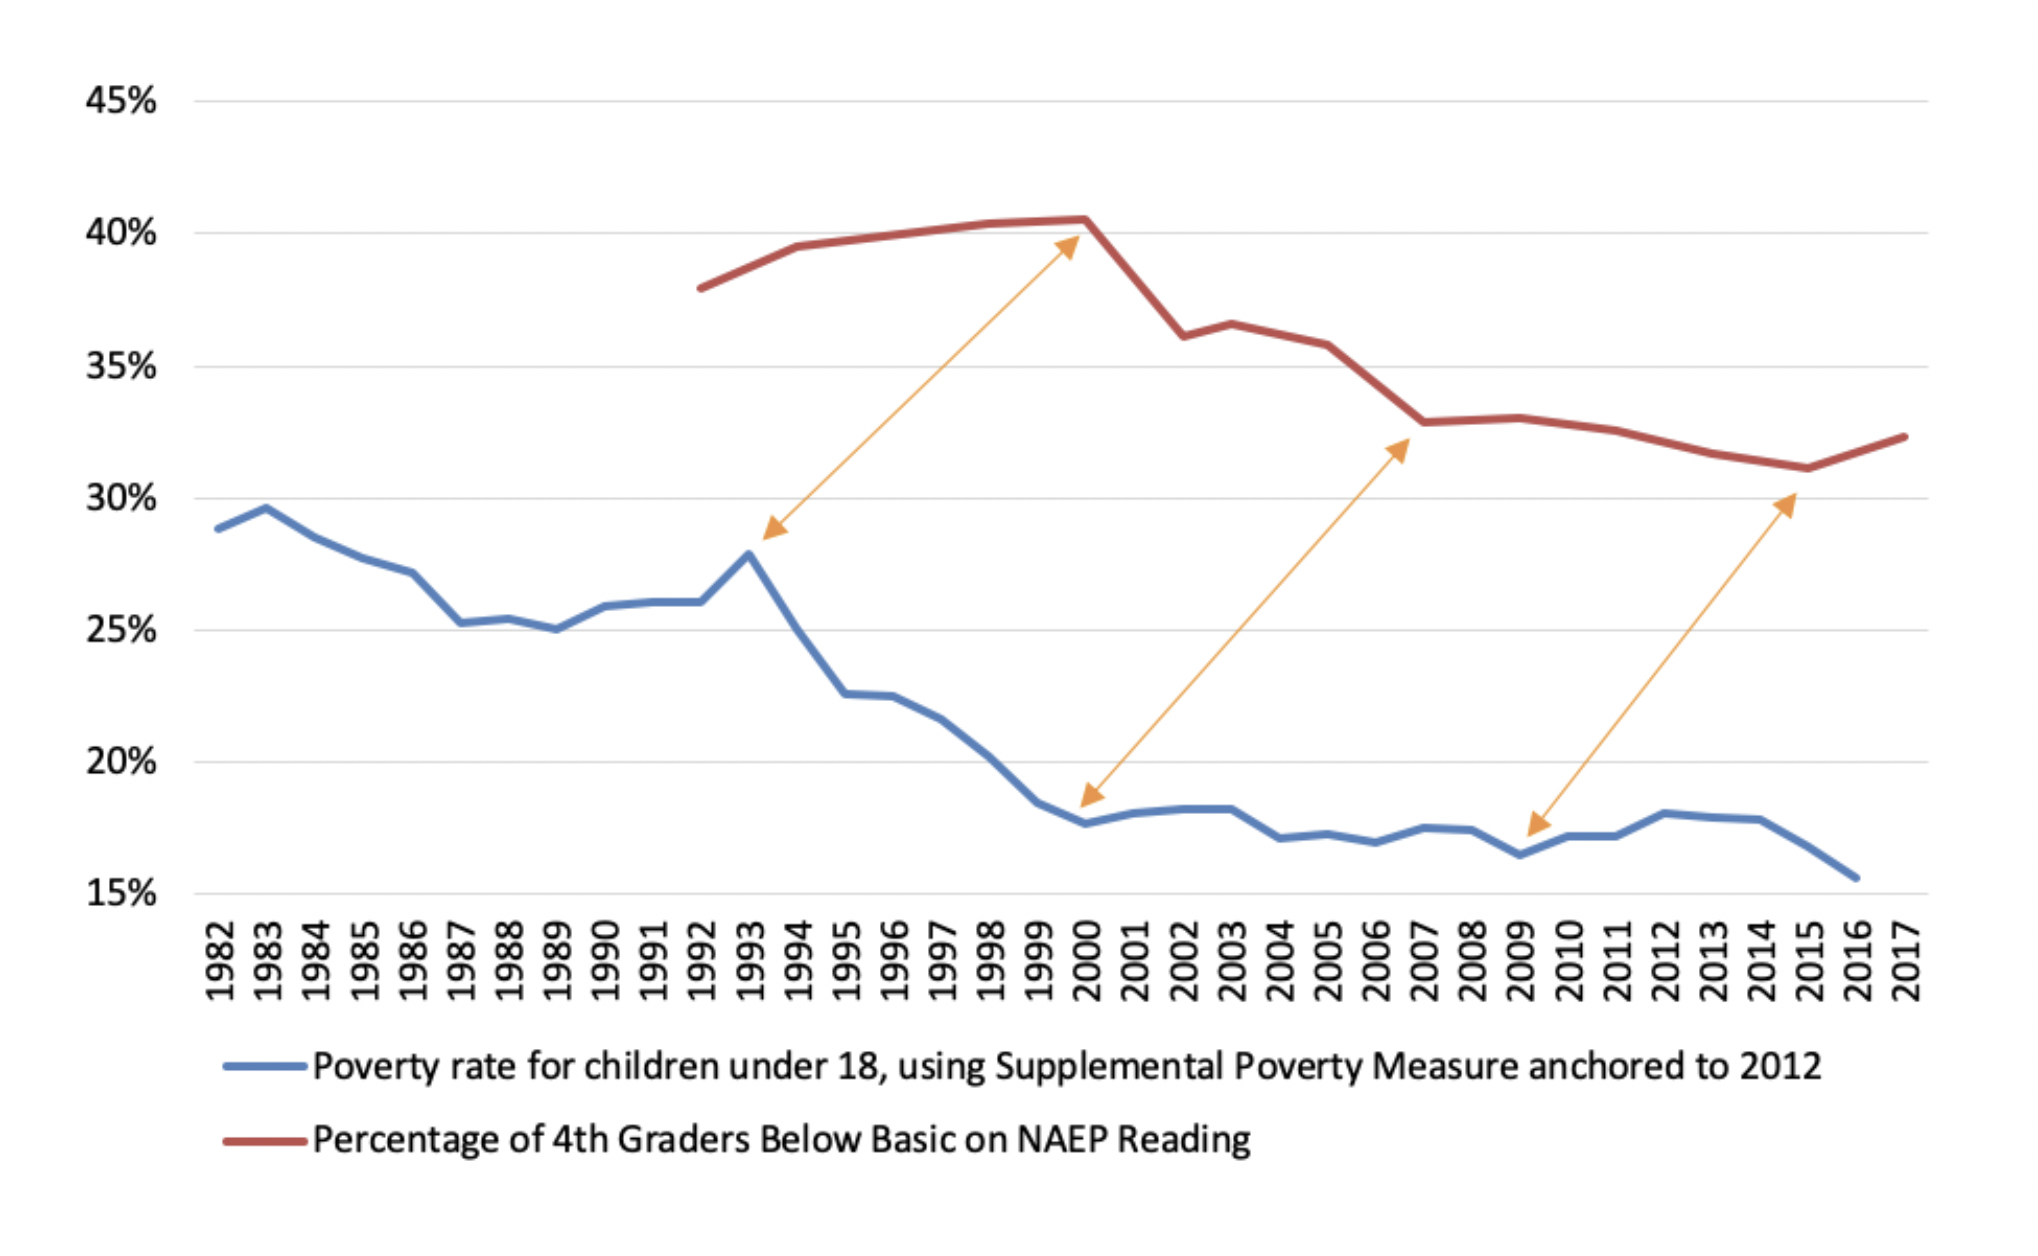
But on the flip side, it implies that the economic shock of the Great Recession might have suppressed achievement for the cohort of students born in the depths of that downturn, i.e. 2009 and 2010. Those are the kids who sat for fourth-grade NAEP this spring. And just a few weeks ago we learned that this same cohort did worse than their older peers when it came to their math and literacy skills upon entry into kindergarten.
Perhaps if we get lucky we’ll see some progress at the eighth grade level, that is, for kids born before the Great Recession. But I predict worse news for fourth graders, at least nationally. Doubtless some states will buck the trend, probably those (like the District of Columbia) that have remained steadfast in pursuit of improvement.
Finally, I predict with the strongest of confidence that the results will be misinterpreted. Common Core haters will blame those scandalous standards for the disappointing results. Obama haters will blame him and his administration. Secretary DeVos will blame a system with not enough school choice. And Trump/DeVos haters will surely blame them.
If blame must be cast, I say, let us place it where it belongs: on an economic calamity whose effects are still being felt today.
Michael J. Petrilli is president of the Thomas B. Fordham Institute, research fellow at Stanford University’s Hoover Institution, and executive editor of Education Next.
Racism Comes Home To Roost

It’s been a tough three years for Latinx children in U.S. schools. From the launch of his campaign through to the present, the president has made racism—and attacks on Latinx people in particular—a core feature of his administration. In the meantime, states and the federal government—at least in those areas run by the GOP—have ramped up immigration enforcement and limited the inflow of refugees and spent money on a divisive wall. At the same time, reports of hate crimes based on race/ethnicity are up.
In this context, my prediction for 2019 NAEP is that there will be widening of gaps between Latinx students and white students. I also predict that these differences will appear more in the states where these issues are most fraught—border states and states that are Republican-controlled. How might these effects come about? There are multiple plausible mechanisms, from increased stereotype threat to increased stress levels that impede learning. I hope I’m wrong, but I worry that the growing nativism and racism of the last few years may show up as producing real harmful educational consequences for children.
Morgan Polikoff is associate professor of education at USC Rossier School of Education