
Interactive Graphics
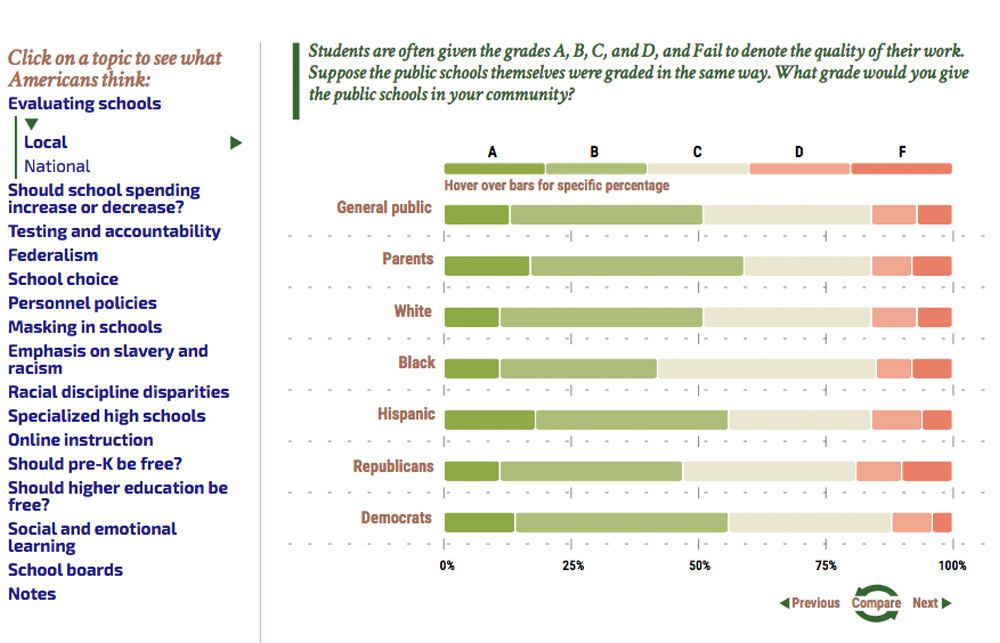 Click through to see interactive results from the 2022 Education Next survey.
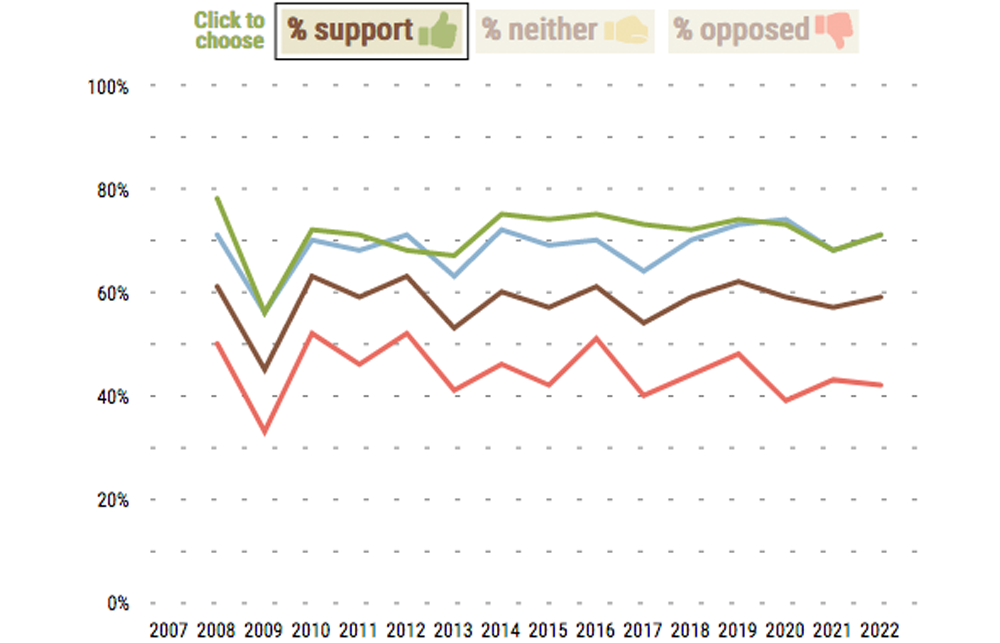 This graphic accompanies “Hunger for Stability Quells Appetite for Change: Results of the 2021 Education Next Survey of Public Opinion,” by Michael B. Henderson, David Houston, Paul E. Peterson, and Martin R. West.
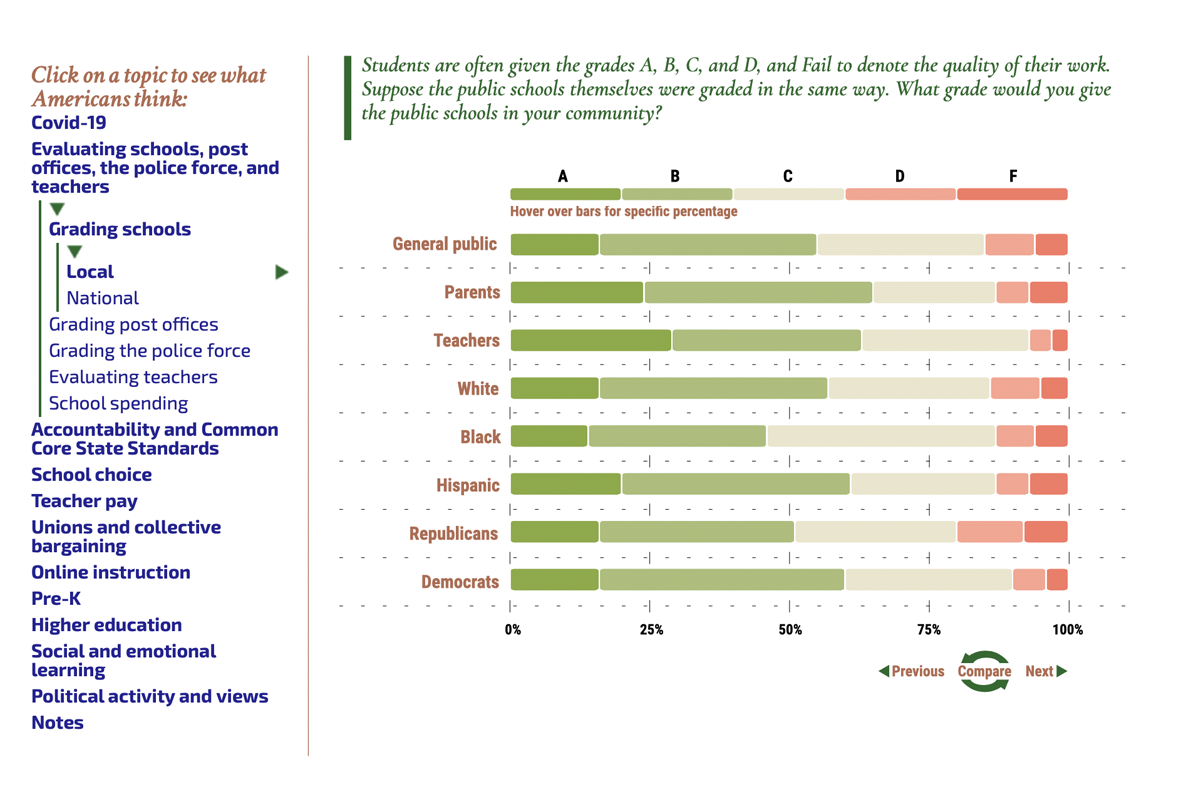 Click through to see interactive results from the 2021 Education Next survey.
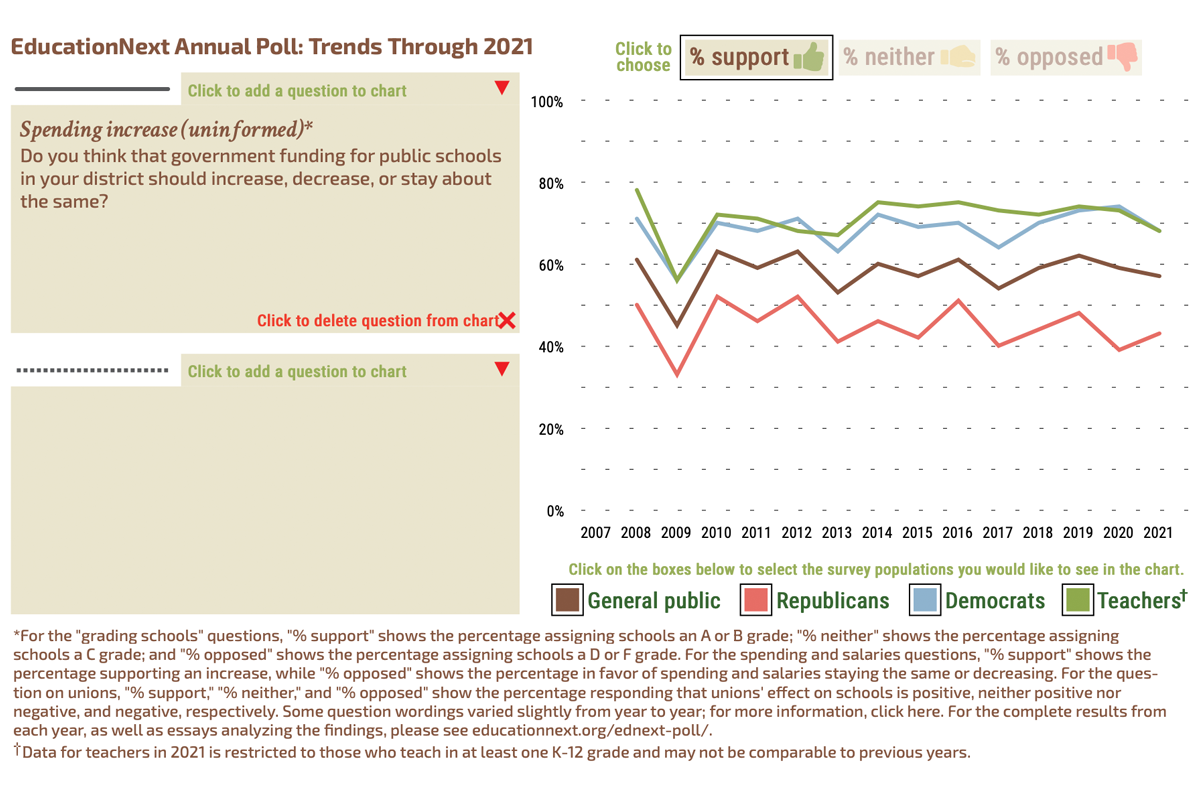 This graphic accompanies “Hunger for Stability Quells Appetite for Change: Results of the 2021 Education Next Survey of Public Opinion,” by Michael B. Henderson, David Houston, Paul E. Peterson, and Martin R. West.
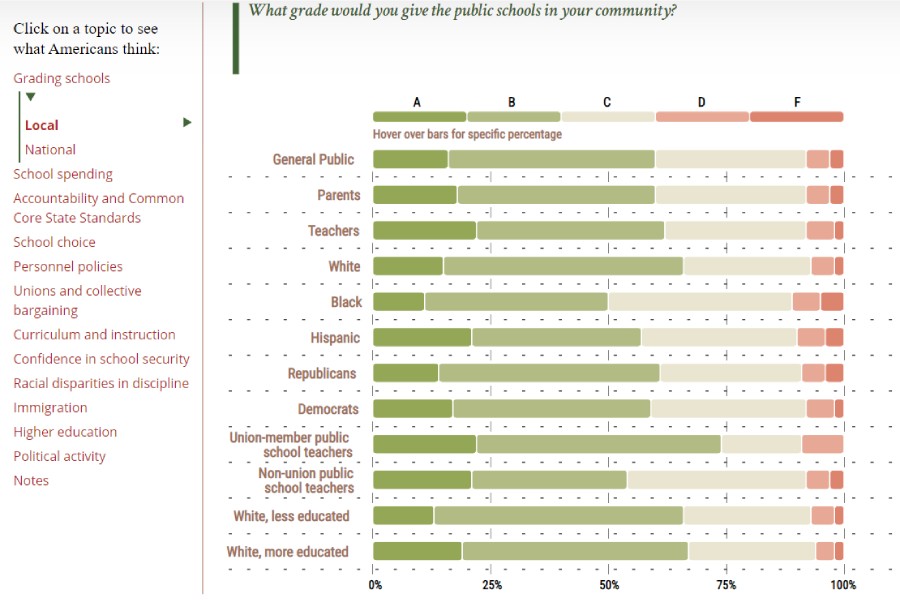 This graphic accompanies “Amid Pandemic, Support Soars for Online Learning, Parent Poll Shows: Results from the 2020 Education Next Survey of Public Opinion.”