For 14 years, the Education Next annual survey has tracked American opinion on education policy. We have gauged people’s views through the throes of the Great Recession, dramatic changes in partisan control in both Washington, D.C., and state capitols, and attendant shifts in the direction of federal and state education policy. None of that compares to the disruption that unfolded this spring, as the Covid-19 pandemic closed schools nationwide and brought the American economy to its knees.
This year’s survey, administered in May 2020, provides an early look at how the experiences of the past few months may shape Americans’ views on education policy going forward. The survey’s nationally representative sample of 4,291 adults includes an oversampling of teachers and of those who identify themselves as Black and Hispanic. (All results are adjusted for non-response and oversampling; see methods sidebar for details.)
In a companion essay, we report parents’ perspectives on their children’s educational experiences during the lockdowns (see “What American Families Experienced When Covid-19 Closed Their Schools,” features). Here we examine public opinion on issues at the core of education-policy debates as we head into the height of the 2020 presidential campaign. We start with a summary of the survey’s top findings.
1. Teacher Pay. Support for teacher pay hikes remains nearly as high as it has been at any point since 2008, when we first surveyed the public on the issue. Among those given information about current salary levels in their state, 55% say teacher salaries should increase—essentially the same as last year and a jump of 19 percentage points over 2017. Among those not given salary information, 65% back an increase.
2. School Spending. Americans are split on whether to increase overall investment in public schools. Among those told current expenditure levels, 45% say that K–12 school spending should increase. This level of support is 5 percentage points lower than last year’s, but it still registers 6 points higher than in 2017. Democrat (56%), Black (63%), and Hispanic (55%) respondents are more likely to back a boost in funding than are Republican (31%) and white (39%) respondents.
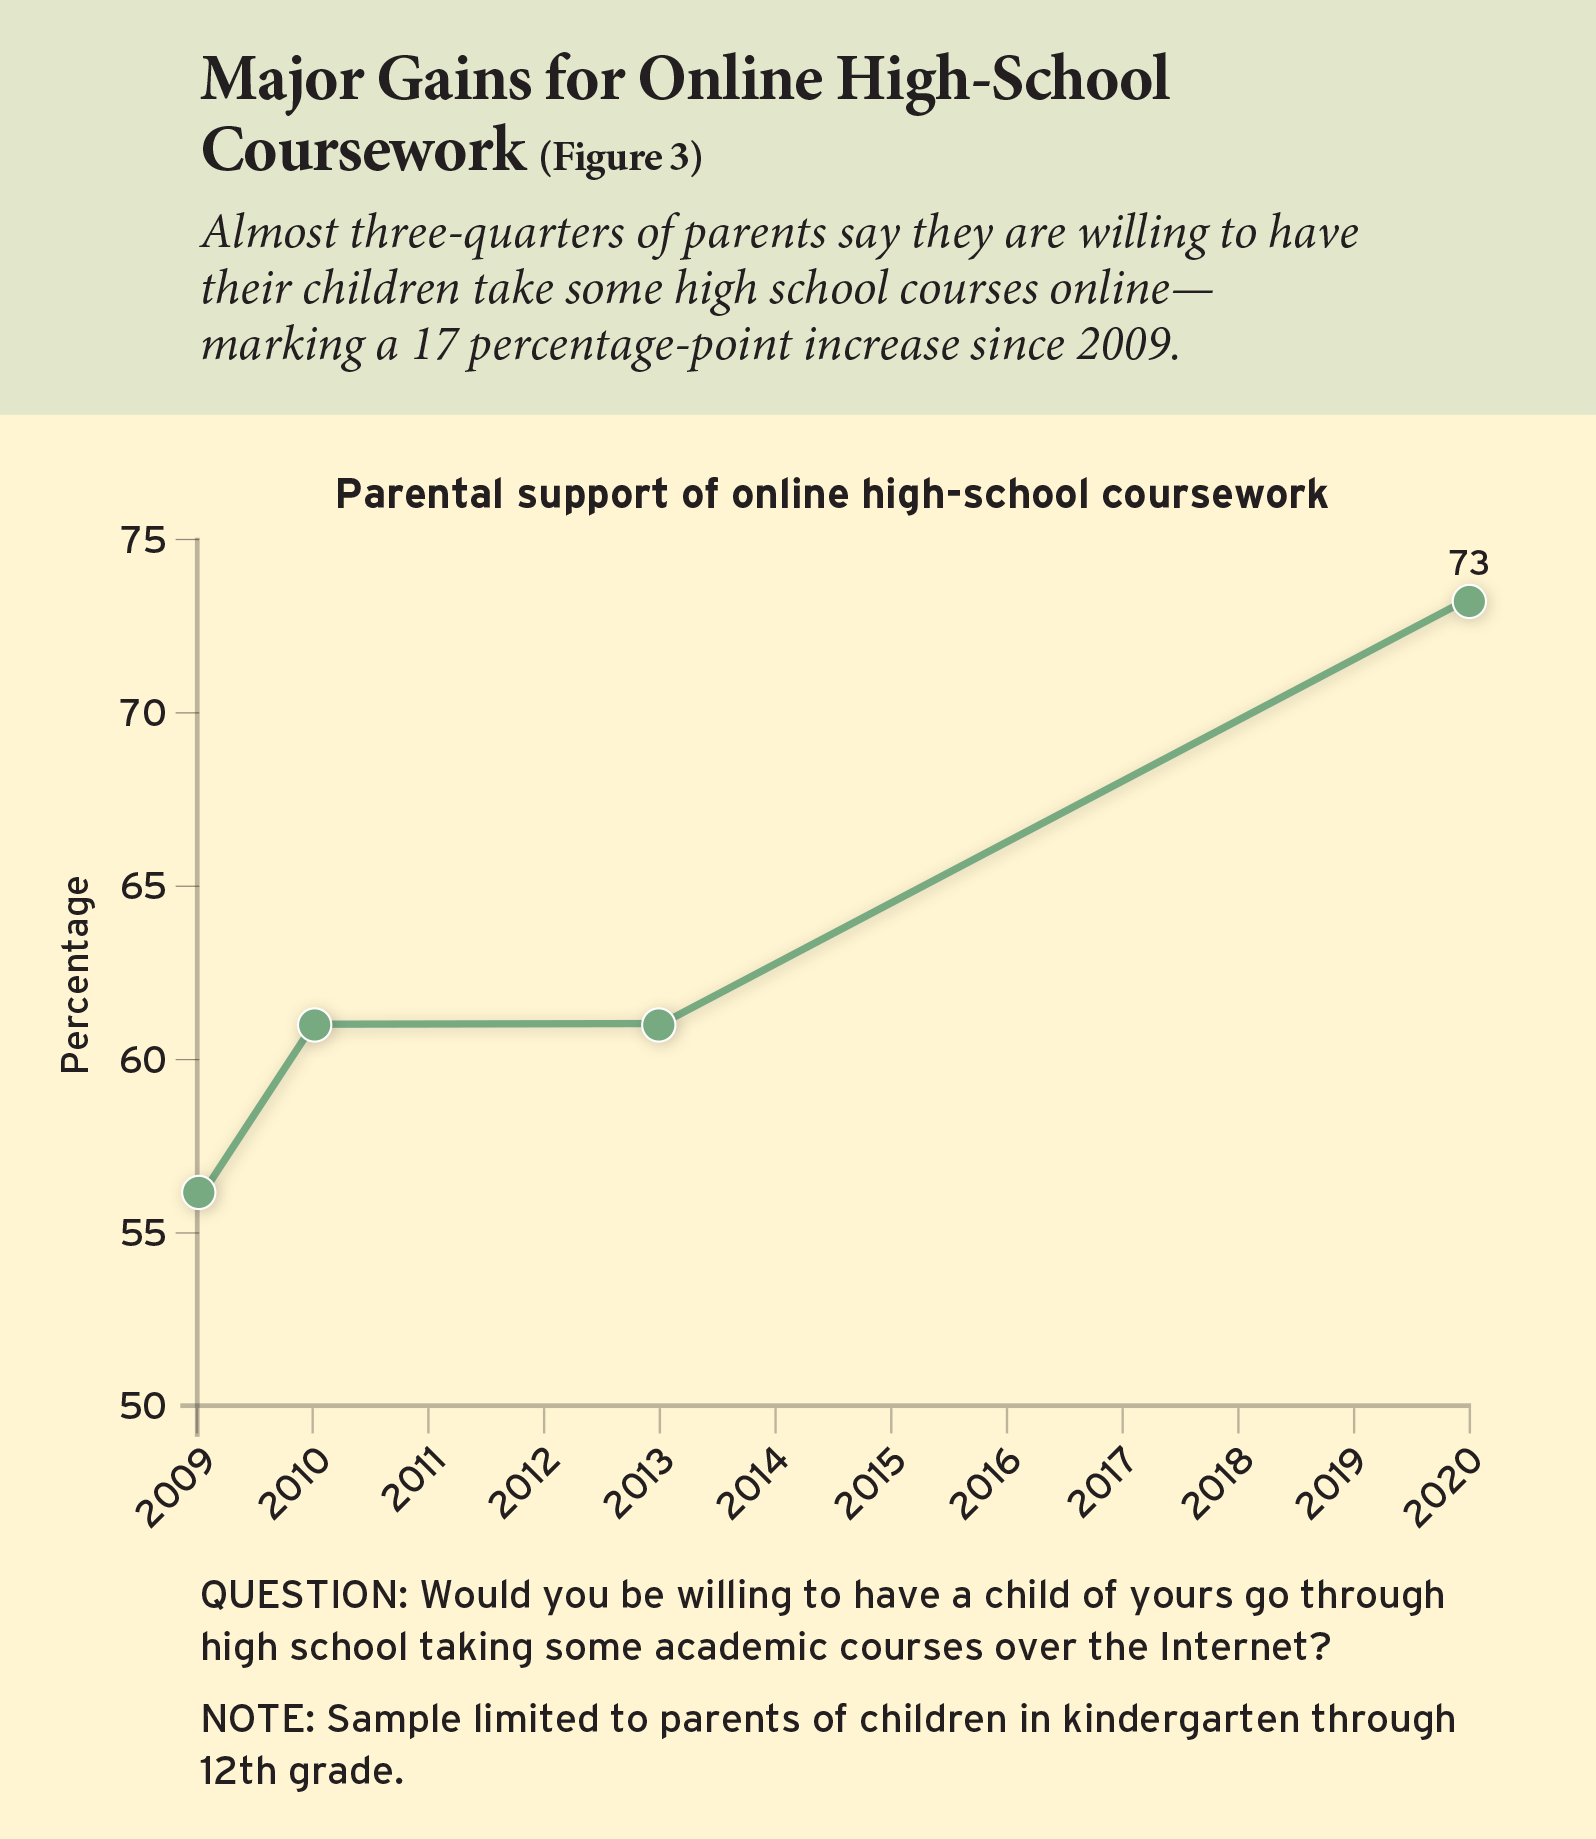
3. Online Education. Americans’ interest in online schooling is on the rise. In 2020, 73% of parents say they are willing to have their child take some high school courses via the Internet—a jump of 17 percentage points over 2009. Parents who report more positive experiences with remote instruction when schools closed this spring are more likely to support online education.
4. School Choice. Support for school-choice reforms either holds steady or declines modestly since last year. The policy of giving tax credits to fund private-school scholarships for low-income students—a concept backed by the Trump administration and recently given a boost by the U.S. Supreme Court’s decision in Espinoza v. Montana Department of Revenue—draws the most support, including from 59% of Republicans and 56% of Democrats. Attitudes toward charter schools divide along party lines: 54% of Republicans support charters, compared to only 37% of Democrats. Vouchers to help pay private-school tuition continue to command strong support among Black (60% for universal vouchers; 65% for low-income vouchers) and Hispanic (62% for universal vouchers; 59% for low-income vouchers) respondents. Universal vouchers are more popular among Republicans than Democrats (56% to 47%), but the reverse is true of vouchers targeted to low-income students (45% to 52%). Neither type of voucher polarizes public opinion as much as charter schools do.
5. Opinion on Public Schools and Teachers. The challenges to schools wrought by the pandemic have not shaken Americans’ confidence in their public schools. Levels of approval remain at or near peak. Fifty-eight percent of respondents give their local public schools a grade of A or B (down 2 points from last year), and 30% give the nation’s public schools a similar grade (the highest level the survey has recorded). The public also gives teachers high marks during this difficult time. On average, respondents rate 61% of local teachers as either excellent or good—a 5-percentage-point increase since 2018. They rate 14% of teachers as unsatisfactory.
6. Free College. Fifty-five percent of Americans endorse the idea of making public four-year colleges free to attend, a dip of 5 percentage points since last year. The concept divides Americans along party lines, with 74% of Democrats but just 29% of Republicans expressing support.
7. Trump Effect. On five issues—Common Core, charter schools, tax-credit-funded scholarships, merit pay for teachers, and in-state tuition for undocumented immigrants—we told a randomly selected group of respondents the president’s position while asking other respondents the same question without mentioning his views. Generally, information about Trump’s positions polarizes opinion, moving Republicans toward the president and pushing Democrats away. These shifts among partisans often offset each other and leave little discernible change in overall public opinion.
8. Populism and Education Policy. To explore the implications of populist sentiment among the American public, we posed a set of questions gauging the extent to which respondents agree with claims such as “elected officials should always follow the will of the people” and then identified the most- and least-populist respondents. We find that populism is a distinctive brand with adherents in both parties. Though 56% of Republicans rank above the median in terms of populism, so do 46% of Democrats. Moreover, populism is a strong predictor of education-policy views: The most-populist Americans assign lower grades to public schools locally and nationally and express greater approval for measures to expand school choice.
Teacher Pay and School Spending
This past spring, Education Next conducted its annual public-opinion survey during an unprecedented economic shutdown wrought by the coronavirus pandemic. The national unemployment rate had peaked in April at a seasonally adjusted 14.7%. State and local tax revenues were in free fall. The National Bureau of Economic Research announced that the nation had entered recession in February.
A dozen years ago, when the nation experienced a similar economic contraction at the outset of the Great Recession, public support for raising teacher pay and spending on education fell sharply. Support for increasing teacher pay dropped to 40% in 2009 from 54% in 2008, when we administered our survey at the peak of the housing bubble and just prior to the financial crisis that followed its rupture. Support for higher school spending also dropped by 14 percentage points, to 37% in 2009 from 51% in 2008. The downturn had long-lasting effects on public opinion: only in the past two years, after nearly a decade of steady economic growth, did support for increased public investment in education recover to match or exceed pre-crisis levels.
Will the Covid-19 recession have similar consequences? If so, they had not materialized as of mid-May, when the survey was conducted. Indicators of support for higher teacher salaries and more spending did tick downward in 2020 compared to last year. These changes are small, however, and often within the survey’s margin of error. School systems will undoubtedly face heightened competition for resources in the years to come. Yet the schools seem to maintain the public’s backing as that struggle begins.
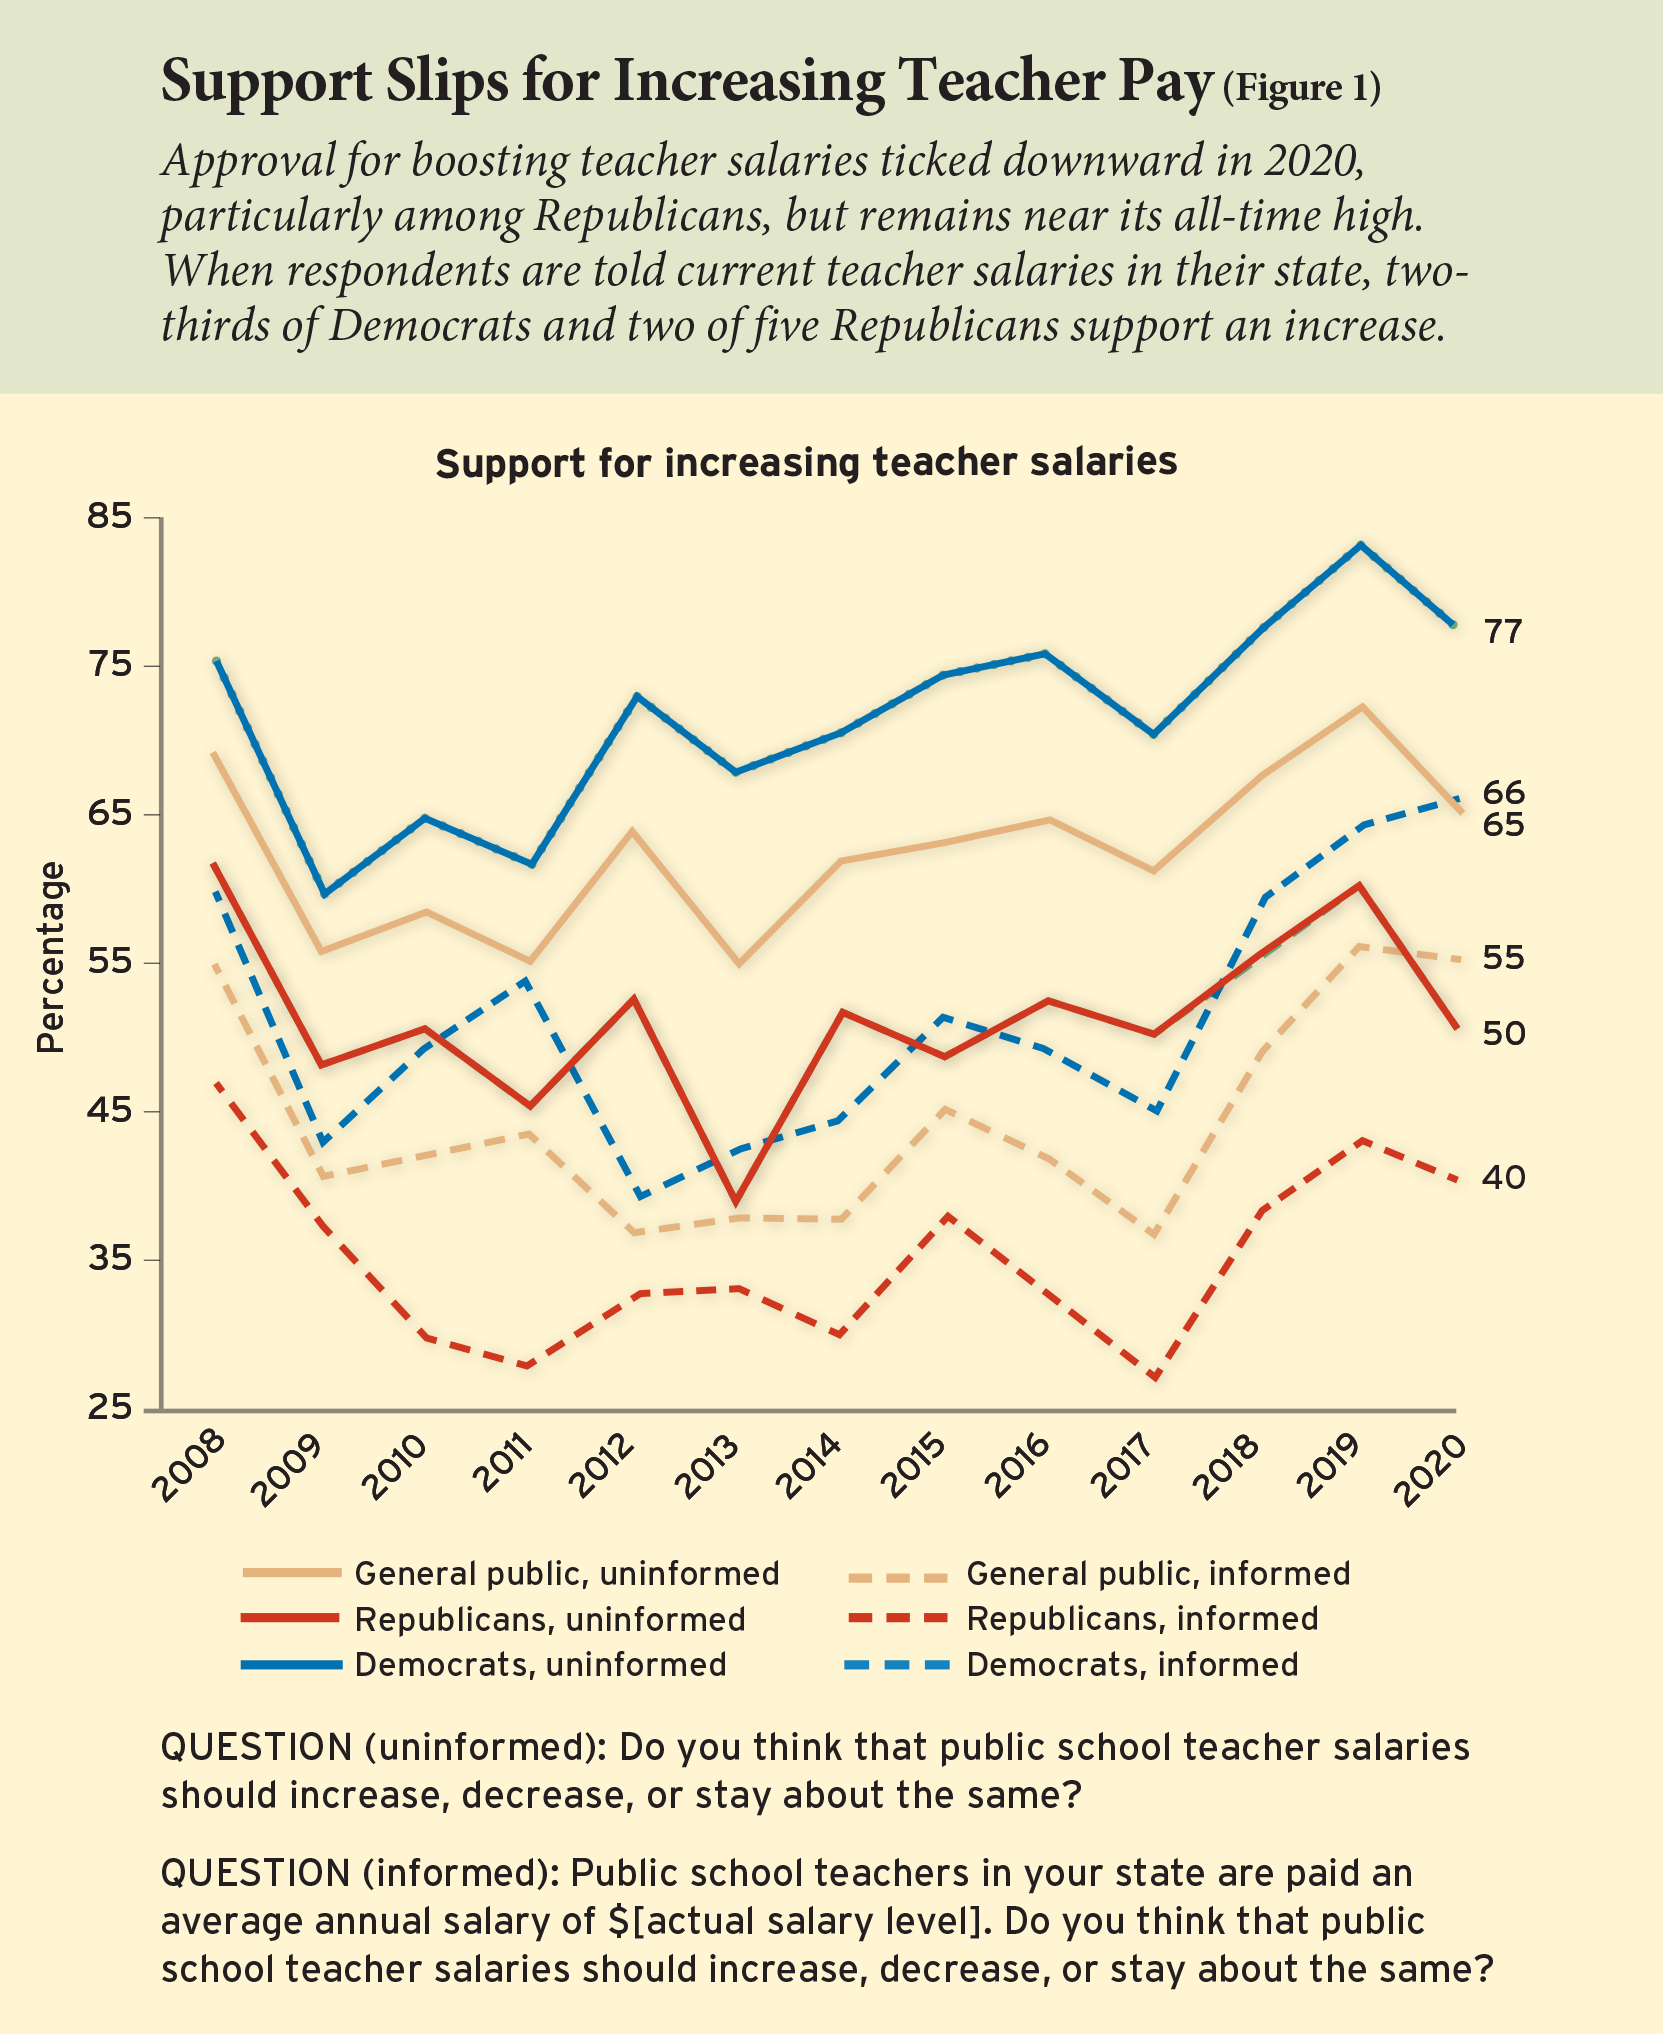
Teacher salaries. We asked all survey respondents whether they thought that salaries for public-school teachers in their home state should increase, decrease, or stay about the same. As in past years, before asking this question we first told a random half of respondents what teachers in their state actually earn. Among those provided this information, 55% say teacher salaries should increase—essentially even with the 56% who gave that response last year (see Figure 1). Thirty-nine percent of “informed” respondents say teacher salaries in their state should remain about the same, while just 7% say they should decrease. In short, the share expressing support for increasing teacher pay is up 19 percentage points since 2017 and nearly as high as it has been at any point since 2008, when we first surveyed the public on the issue.
More Democrats than Republicans favor increasing teacher salaries, and that divide appears to have widened modestly over the past year. Support rose to 66% this year from 64% in 2019 among Democrats, and fell to 40% from 43% among Republicans. Meanwhile, teachers are even more convinced about the merits of increasing their own salaries, with 81% of them registering support, up from 76% last year.
Among those who are not first informed of what teachers currently earn, an even larger proportion of the public favors increasing teacher salaries. Sixty-five percent of this segment say that salaries should increase, 30% say they should remain the same, and 5% say they should decrease. These numbers reflect a modest 5-percentage-point decline in support since 2019, when 70% of “uninformed” respondents supported an increase. The higher level of endorsement for boosting teacher salaries among the “uninformed” respondents reflects the fact that most Americans believe that teachers are underpaid and earn far less than they actually do. When asked to estimate average annual teacher salaries in their state, respondents’ average guess came in at $42,816—30% less than the actual average of $61,018 across the participants in our survey.
School Spending. We also asked survey respondents whether government spending on public schools in their local district should increase, after first informing a randomly chosen half of respondents about current spending levels. Forty-five percent of those given this information say that spending should increase. This represents a 5-percentage-point decline since last year, but still leaves support up 6 percentage points over 2017. Forty-six percent of “informed” respondents say that spending on their local schools should stay about the same, while 10% say that spending should decrease.
As in the case of teacher salaries, the partisan gap in support for spending more on local schools widened a bit in the past year. Support for higher spending fell by just 3 percentage points among Democrats, to 56% in 2020 from 59% in 2019. Meanwhile, support dropped to 31% from 38% among Republicans, increasing the partisan gap to 25 percentage points. Fifty-nine percent of teachers favor spending more on their local schools, a 3-percentage-point increase since 2019.
Americans continue to underestimate dramatically what the government already spends on their local schools. On average, respondents to our survey guessed $8,140 per pupil annually—44% less than the average $14,504 actually spent.
Consistent with this, respondents not given information on current spending are more enthusiastic about spending more. Among the “uninformed,” 59% favor a boost in spending, 34% say it should stay about the same, while just 7% think it should decrease. The 59% of the public supporting an increase represents a modest decline of just 3 percentage points since 2019.
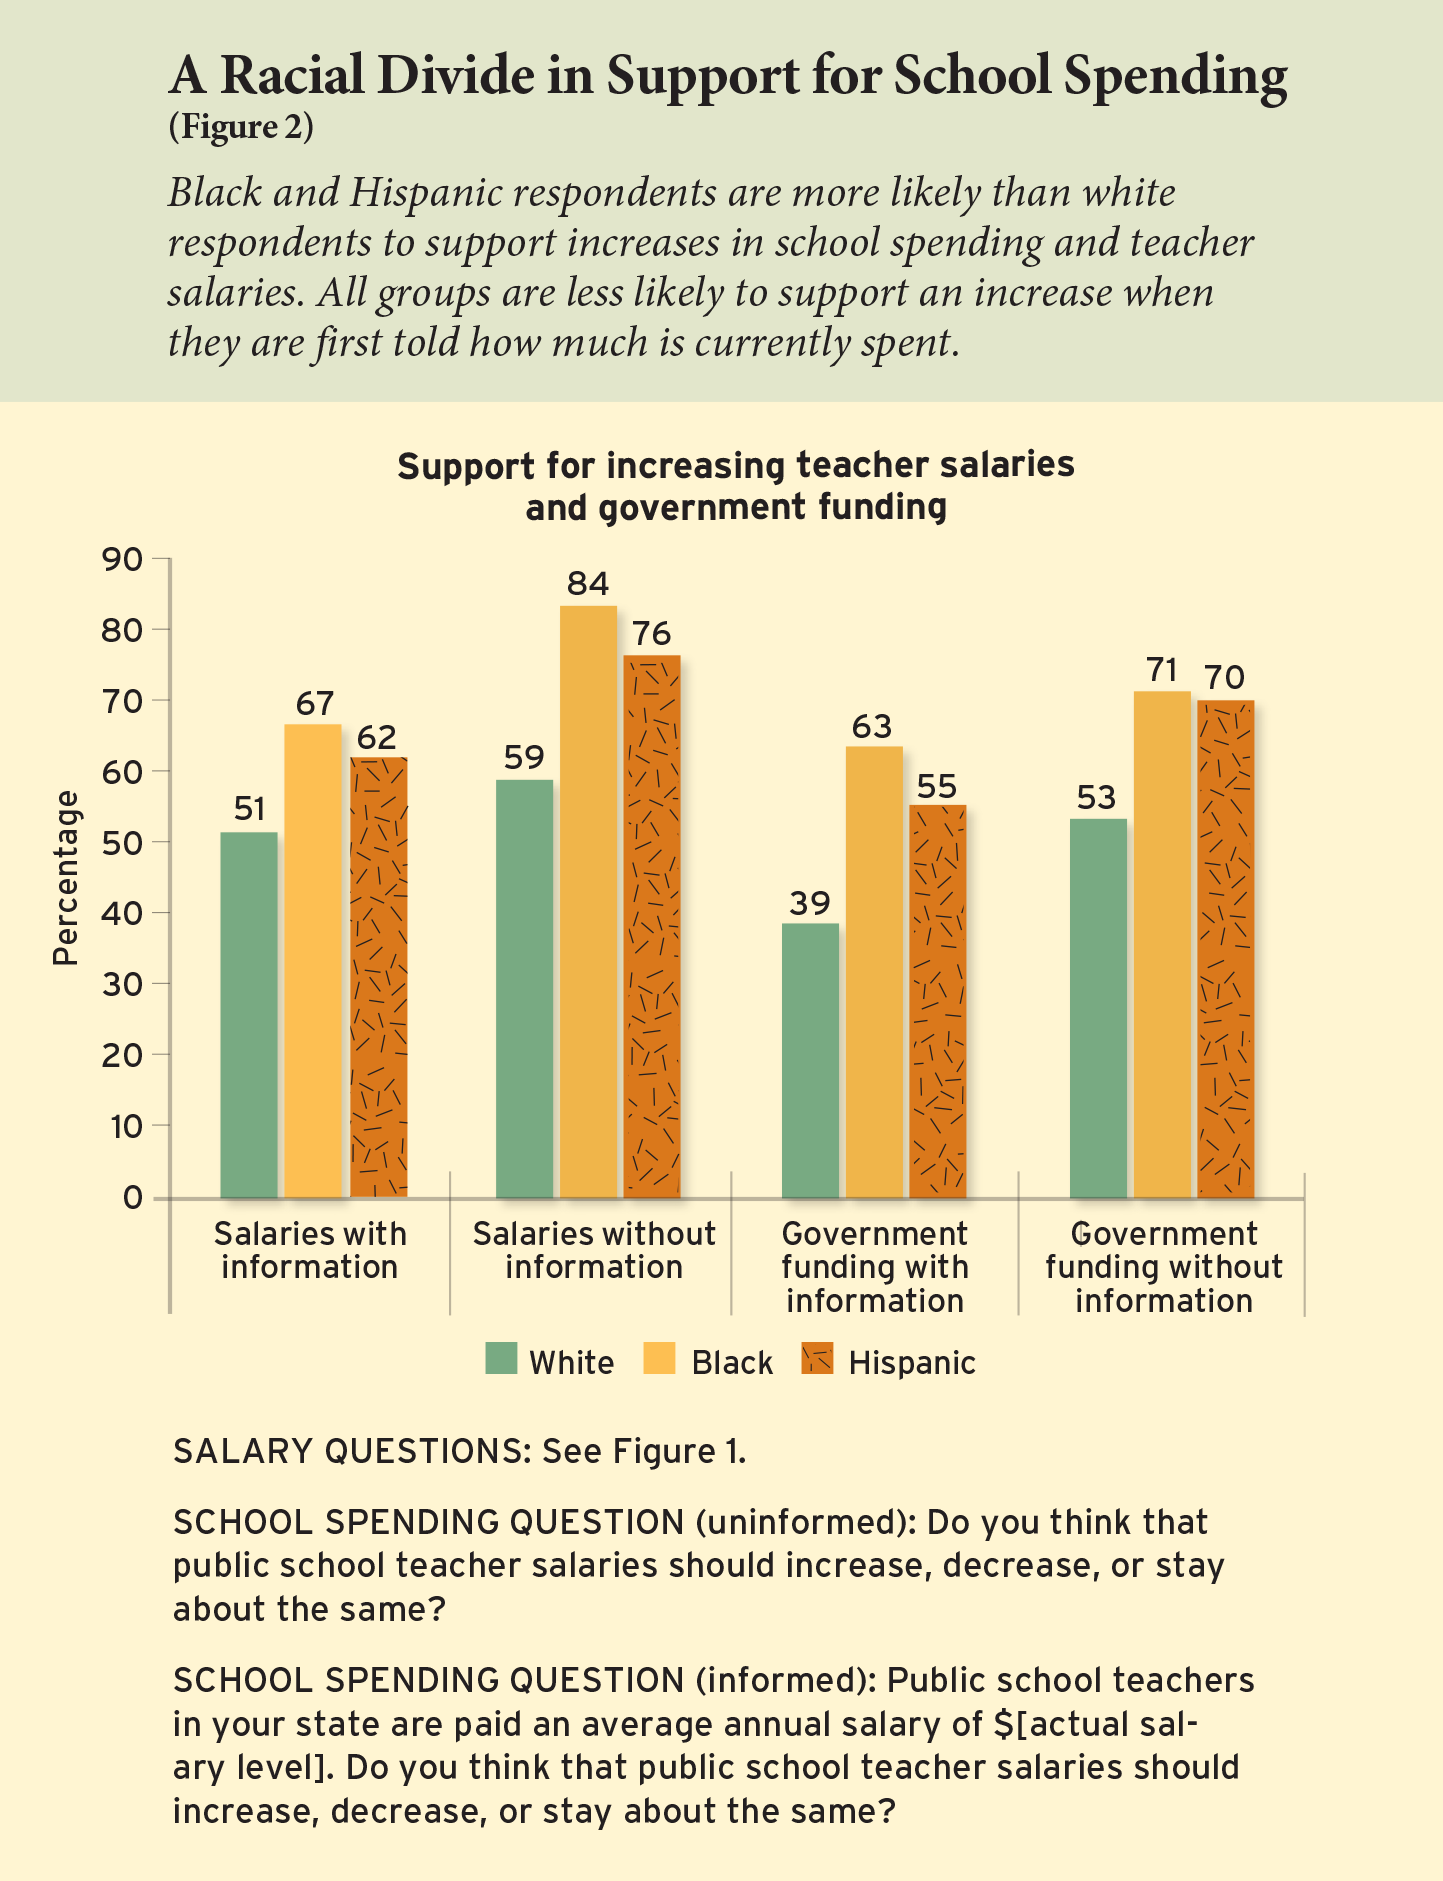
Support by race and ethnicity. The question of investing more money in the schools clearly divides respondents along racial and ethnic lines. While strong majorities of Black and Hispanic respondents support raising teacher salaries and spending more on their local schools, white respondents are less enthusiastic (see Figure 2). For example, 63% of Black respondents who are told current spending levels favor an increase, as do 55% of Hispanic respondents. The corresponding figure for white respondents is just 39%. Similar differences emerge among “uninformed” respondents on both school spending and teacher pay.
Online Education and Homeschooling
Online schooling. Americans’ openness to online education has increased in recent years (see Figure 3). In 2009, 56% of American parents said they would be willing to have their child take some academic courses online during high school. This share edged up somewhat to 61% in 2010 and remained at that level in 2013. In 2020, however, 73% of parents say they are willing to have their child take some high school courses online—a 17-percentage-point jump since 2009. The growth in approval for online schooling for secondary school students is even more dramatic among the public as a whole, for whom the share willing to have a child take such courses rose to 71% from 54% during the past 10 years.
We also approximated the extent of this support by asking how many courses a high school student should be allowed to take for credit online. Typically, students must complete 24 courses in high school to graduate. On average, Americans say that high school students should be allowed to take 11 courses online. This is a 22% increase from the average response of 9 courses in 2017. The pattern is identical when focusing on parents only—an increase to 11 courses from 9.
Does Americans’ growing support for online schooling reflect their recent experiences when most schools closed amid the pandemic? Our data do not offer conclusive evidence that these experiences changed attitudes, but those parents who reported more-positive experiences during school closures are more likely to support online schooling.
The 2020 Education Next survey included a battery of questions asking parents of children in kindergarten through 12th grade whose schools closed during the pandemic about their children’s experiences during the closure (see “What American Families Experienced When Covid-19 Closed Their Schools”). According to these parents, 88% of students primarily participated in their school’s remote instruction or activities on a computer, tablet, or similar device (as opposed to in other ways, such as using workbooks or worksheets). Among parents whose children primarily participated digitally in instruction during the closure, those who report more satisfaction with this instruction also express greater willingness to have their child go through high school taking some academic courses online. Among the top quartile in satisfaction, 85% are willing to have their children take such courses; among the bottom quartile, 58% are willing.
Furthermore, the parents who were least satisfied with instruction during the closure say high school students should be allowed to take 9 online courses, on average, for graduation credit, while the most-satisfied parents say high school students should be able to take 11 courses for such credit.
Homeschooling. Support for homeschooling has remained stable in recent years. Approximately half (49%) of Americans are in favor of allowing parents to educate their children at home instead of sending them to school; 35% of Americans say that they oppose that practice. In hopes of gauging what people think about homeschooling generally (as opposed to having children learn from home during a pandemic), we specifically referred to “ordinary circumstances when schools are open” when asking this question in 2020. The 49% approval share is statistically indistinguishable from the 45% who supported homeschooling when we last asked about it in 2017. The share of Americans who think parents should be required to receive approval from their local school district to homeschool their children was 54% in 2017 and is 54% in 2020. The share of Americans who support requiring parents to notify their local school district if they intend to homeschool their children was 73% in 2017 and is 70% in 2020.
School Reform
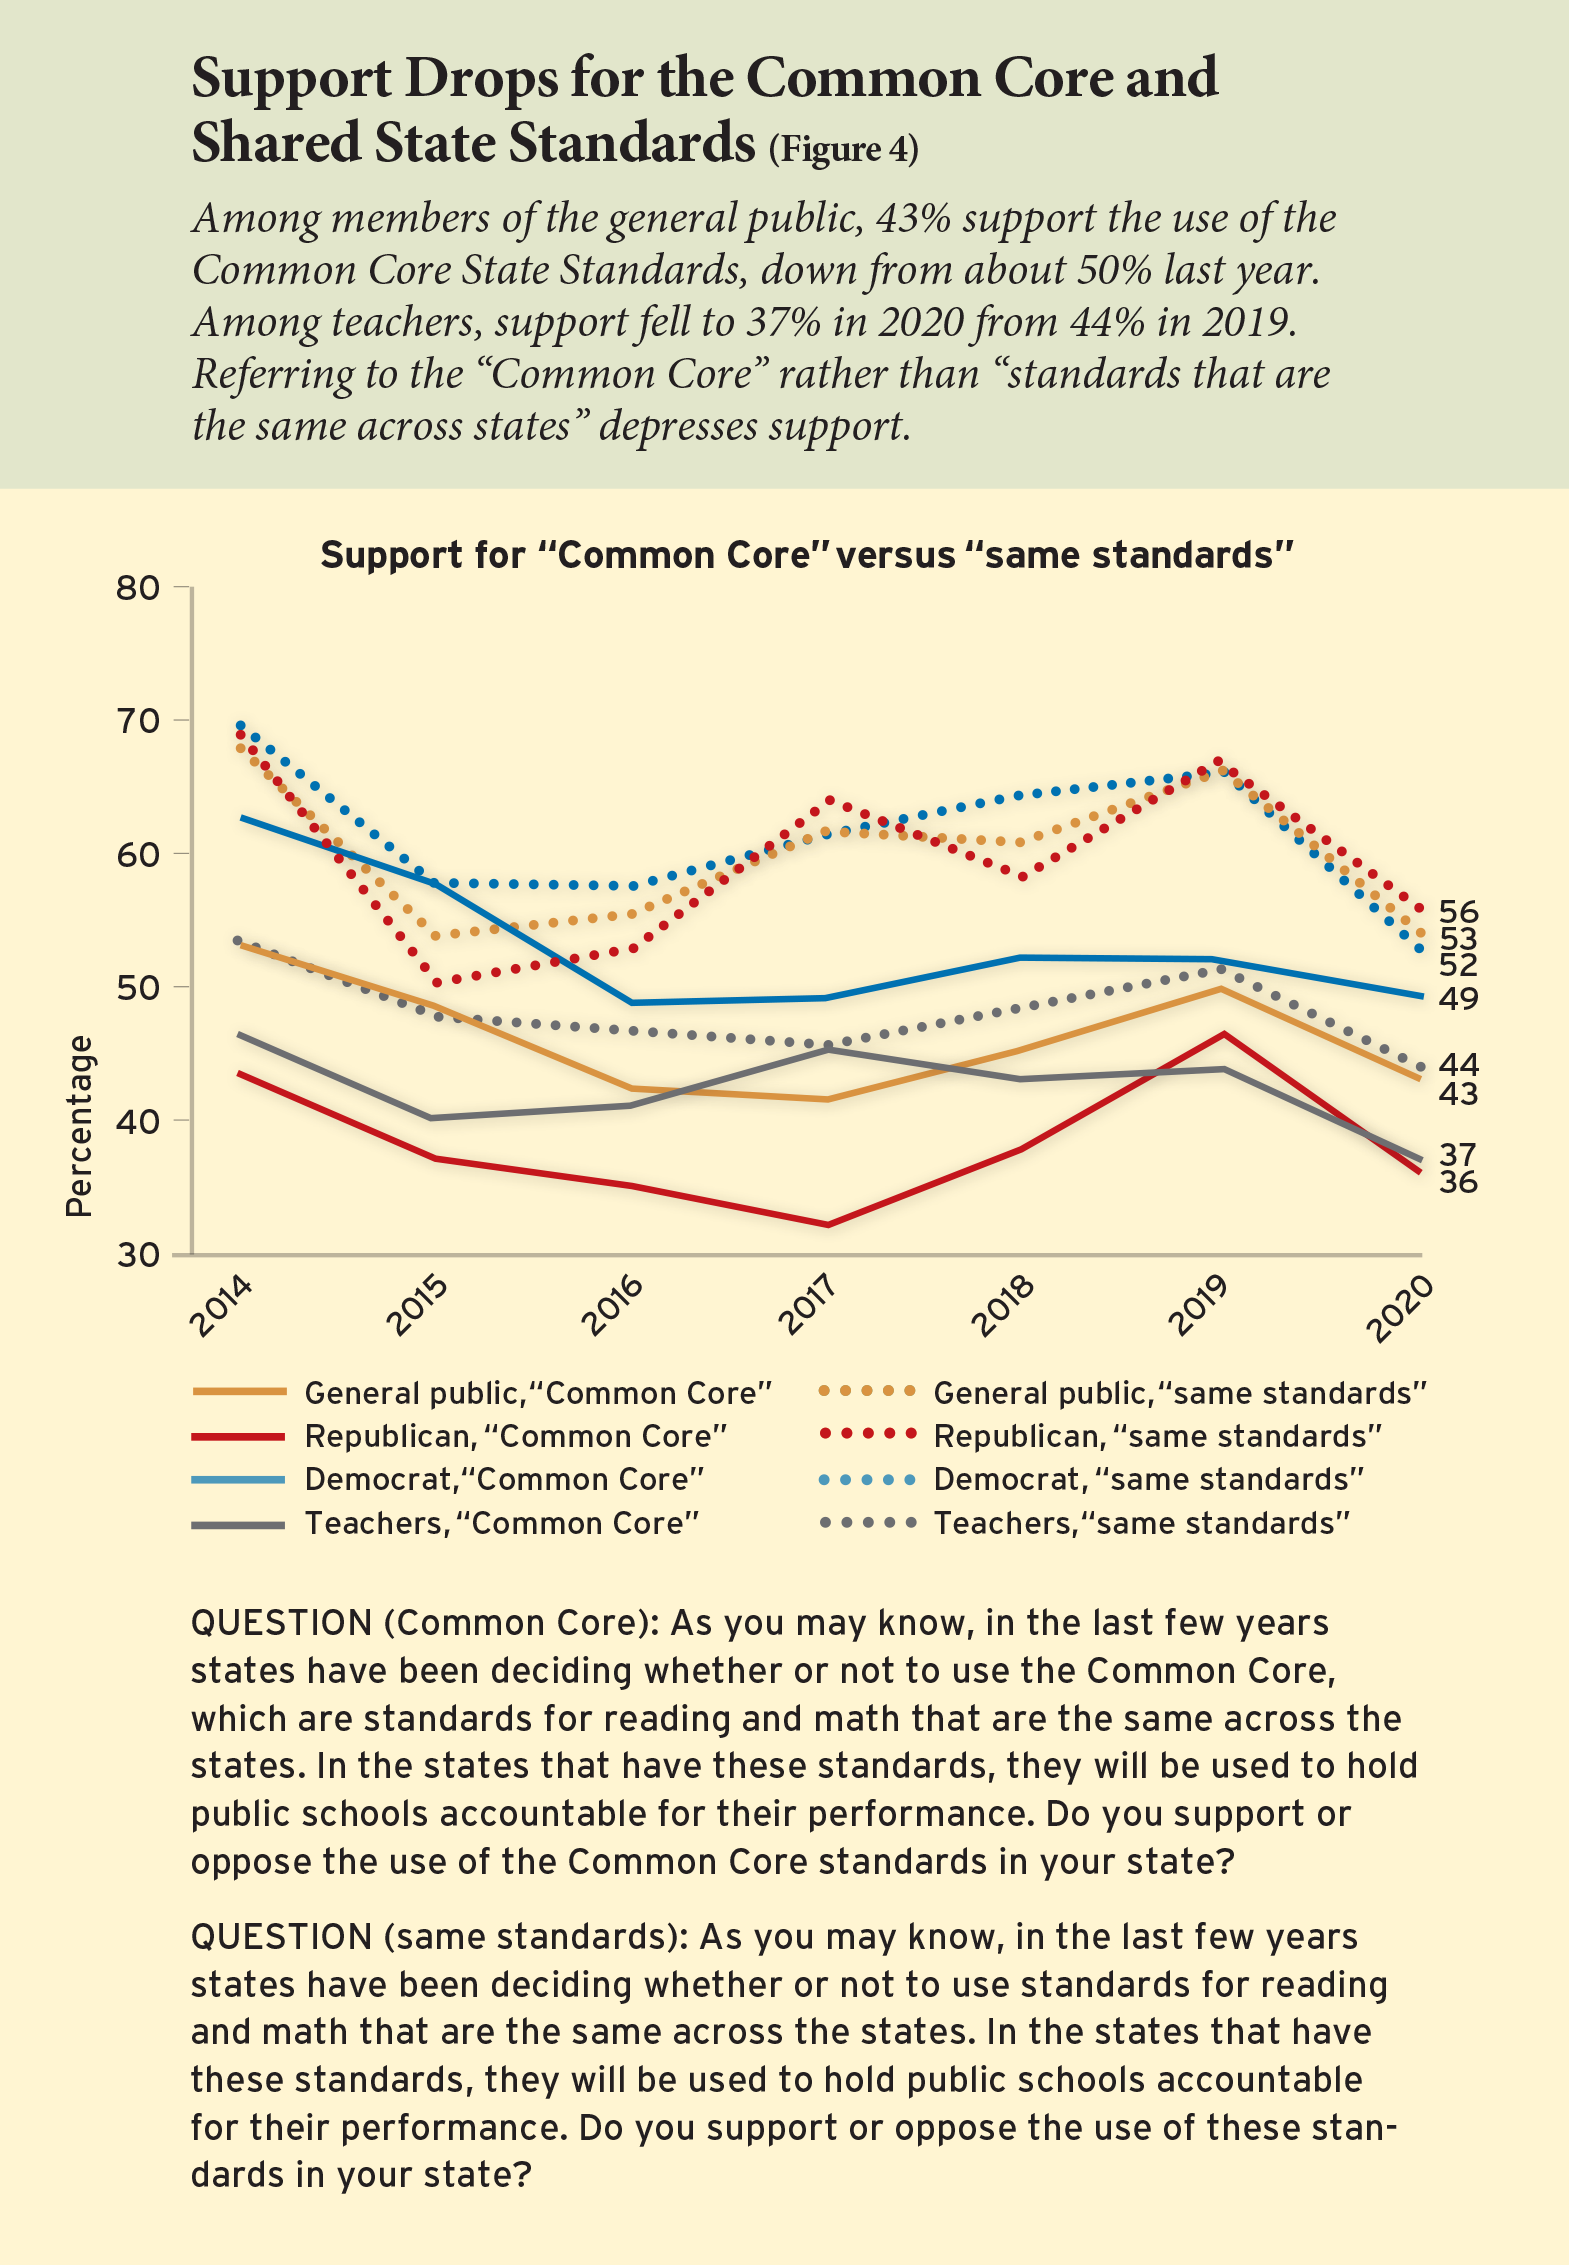
Common Core. In every annual survey since 2014, we have conducted a simple experiment to understand public attitudes toward the Common Core State Standards. We ask some respondents about their views on the Common Core, while other respondents receive the same question about a generic set of national math and reading standards. After rising to 50 percent in 2019, support for the Common Core (explicitly named) has dipped again to 43 percent (see Figure 4). This level of support aligns more closely with the results from the three years preceding 2019, perhaps suggesting that last year’s uptick was the result of chance rather than representing a true change in public opinion. An alternative explanation for this year’s decline in approval is that language in the question noting that the standards would be used to “hold public schools accountable for their performance” may have been a turn-off, given people’s awareness of the challenges schools have faced during the pandemic.
Among subgroups, neither teachers (37%) nor Republicans (36%) are particularly enthusiastic about the standards. Black (54%), Hispanic (52%), and Democratic (49%) support remains somewhat more robust. When we ask about generic national standards—the Common Core “brand” holds negative connotations for some people—support among the general public rises to 53%, but this too is a substantial decrease from the 66% favorability we observed last year.
School choice. Support for school choice reforms either holds steady or declines modestly from last year. Support for “the formation of charter schools” among the general public has slipped to 44% from 47% last year. Opposition to charter schools has also declined, however, to 37% from 40%. Meanwhile, the share of respondents who say they neither support nor oppose charters has grown to 19% from 13%. One way of looking at this is that more than 60% of people either support charter schools or may be open to persuasion on the topic.
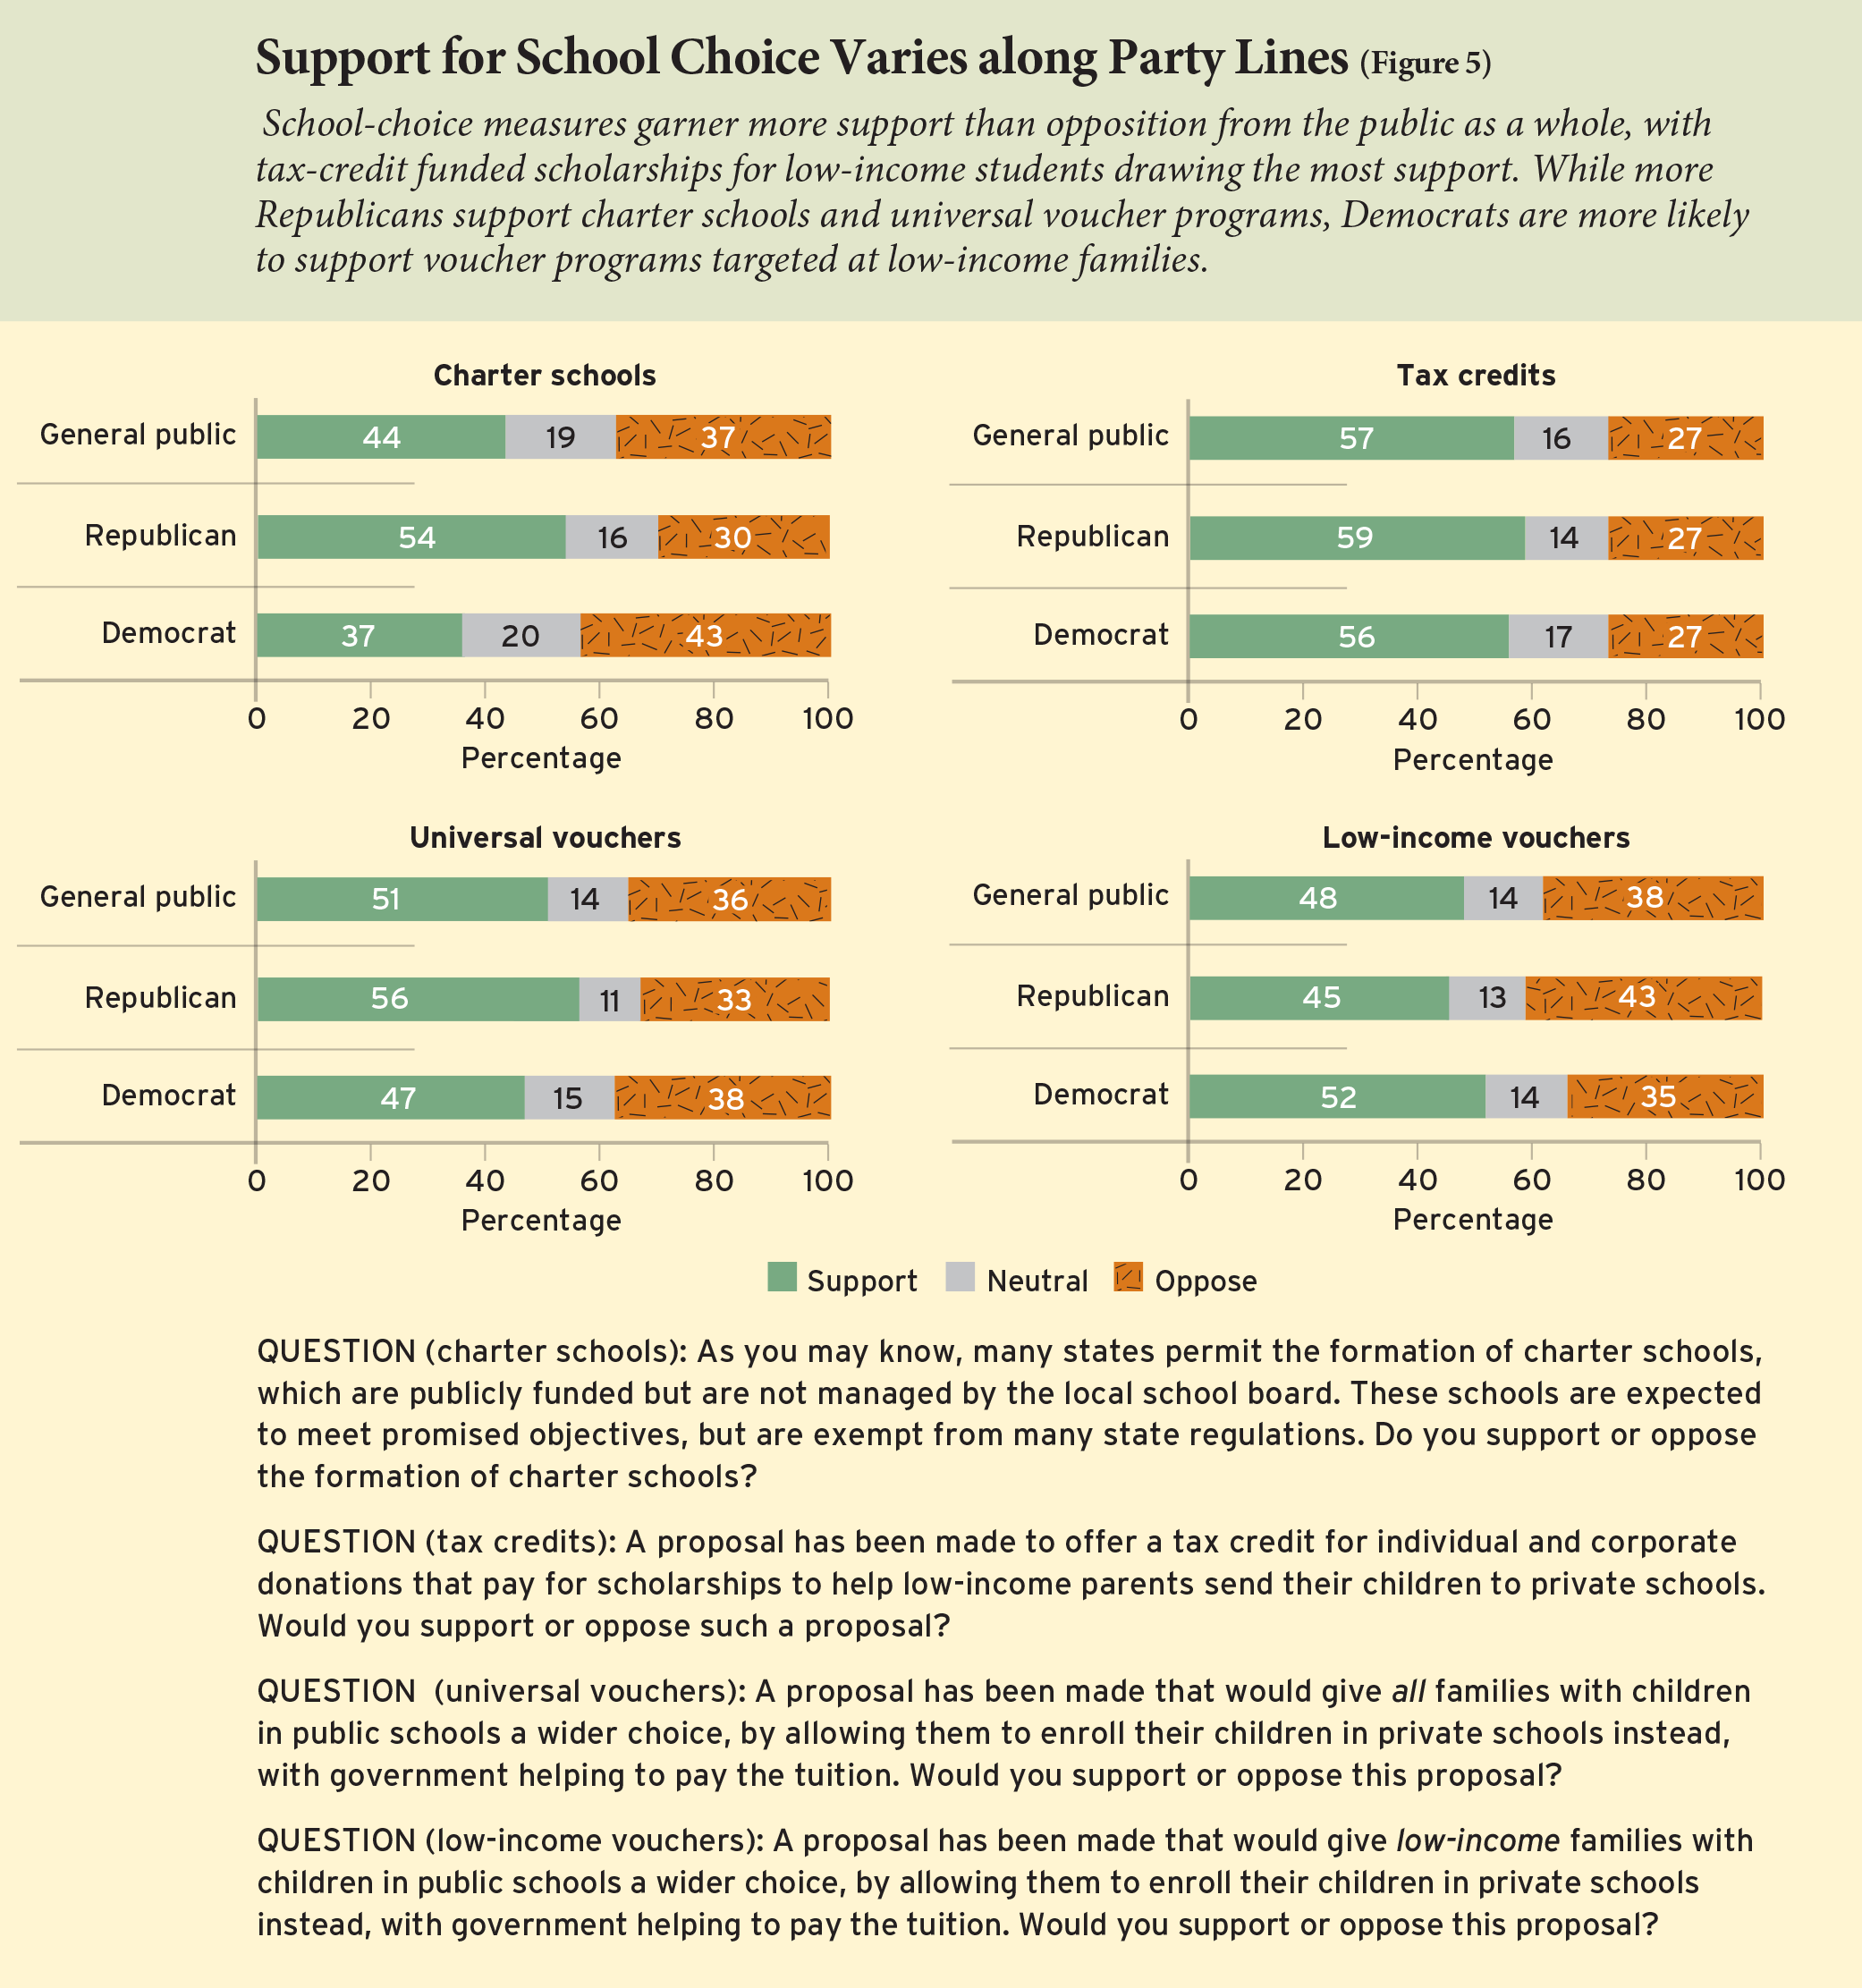
Democrats and Republicans remain sharply divided on the issue of charter schools (see Figure 5). A policy that has enjoyed steady support from presidents of both parties, charters are now supported by only 37% of Democrats compared to 54% of Republicans.
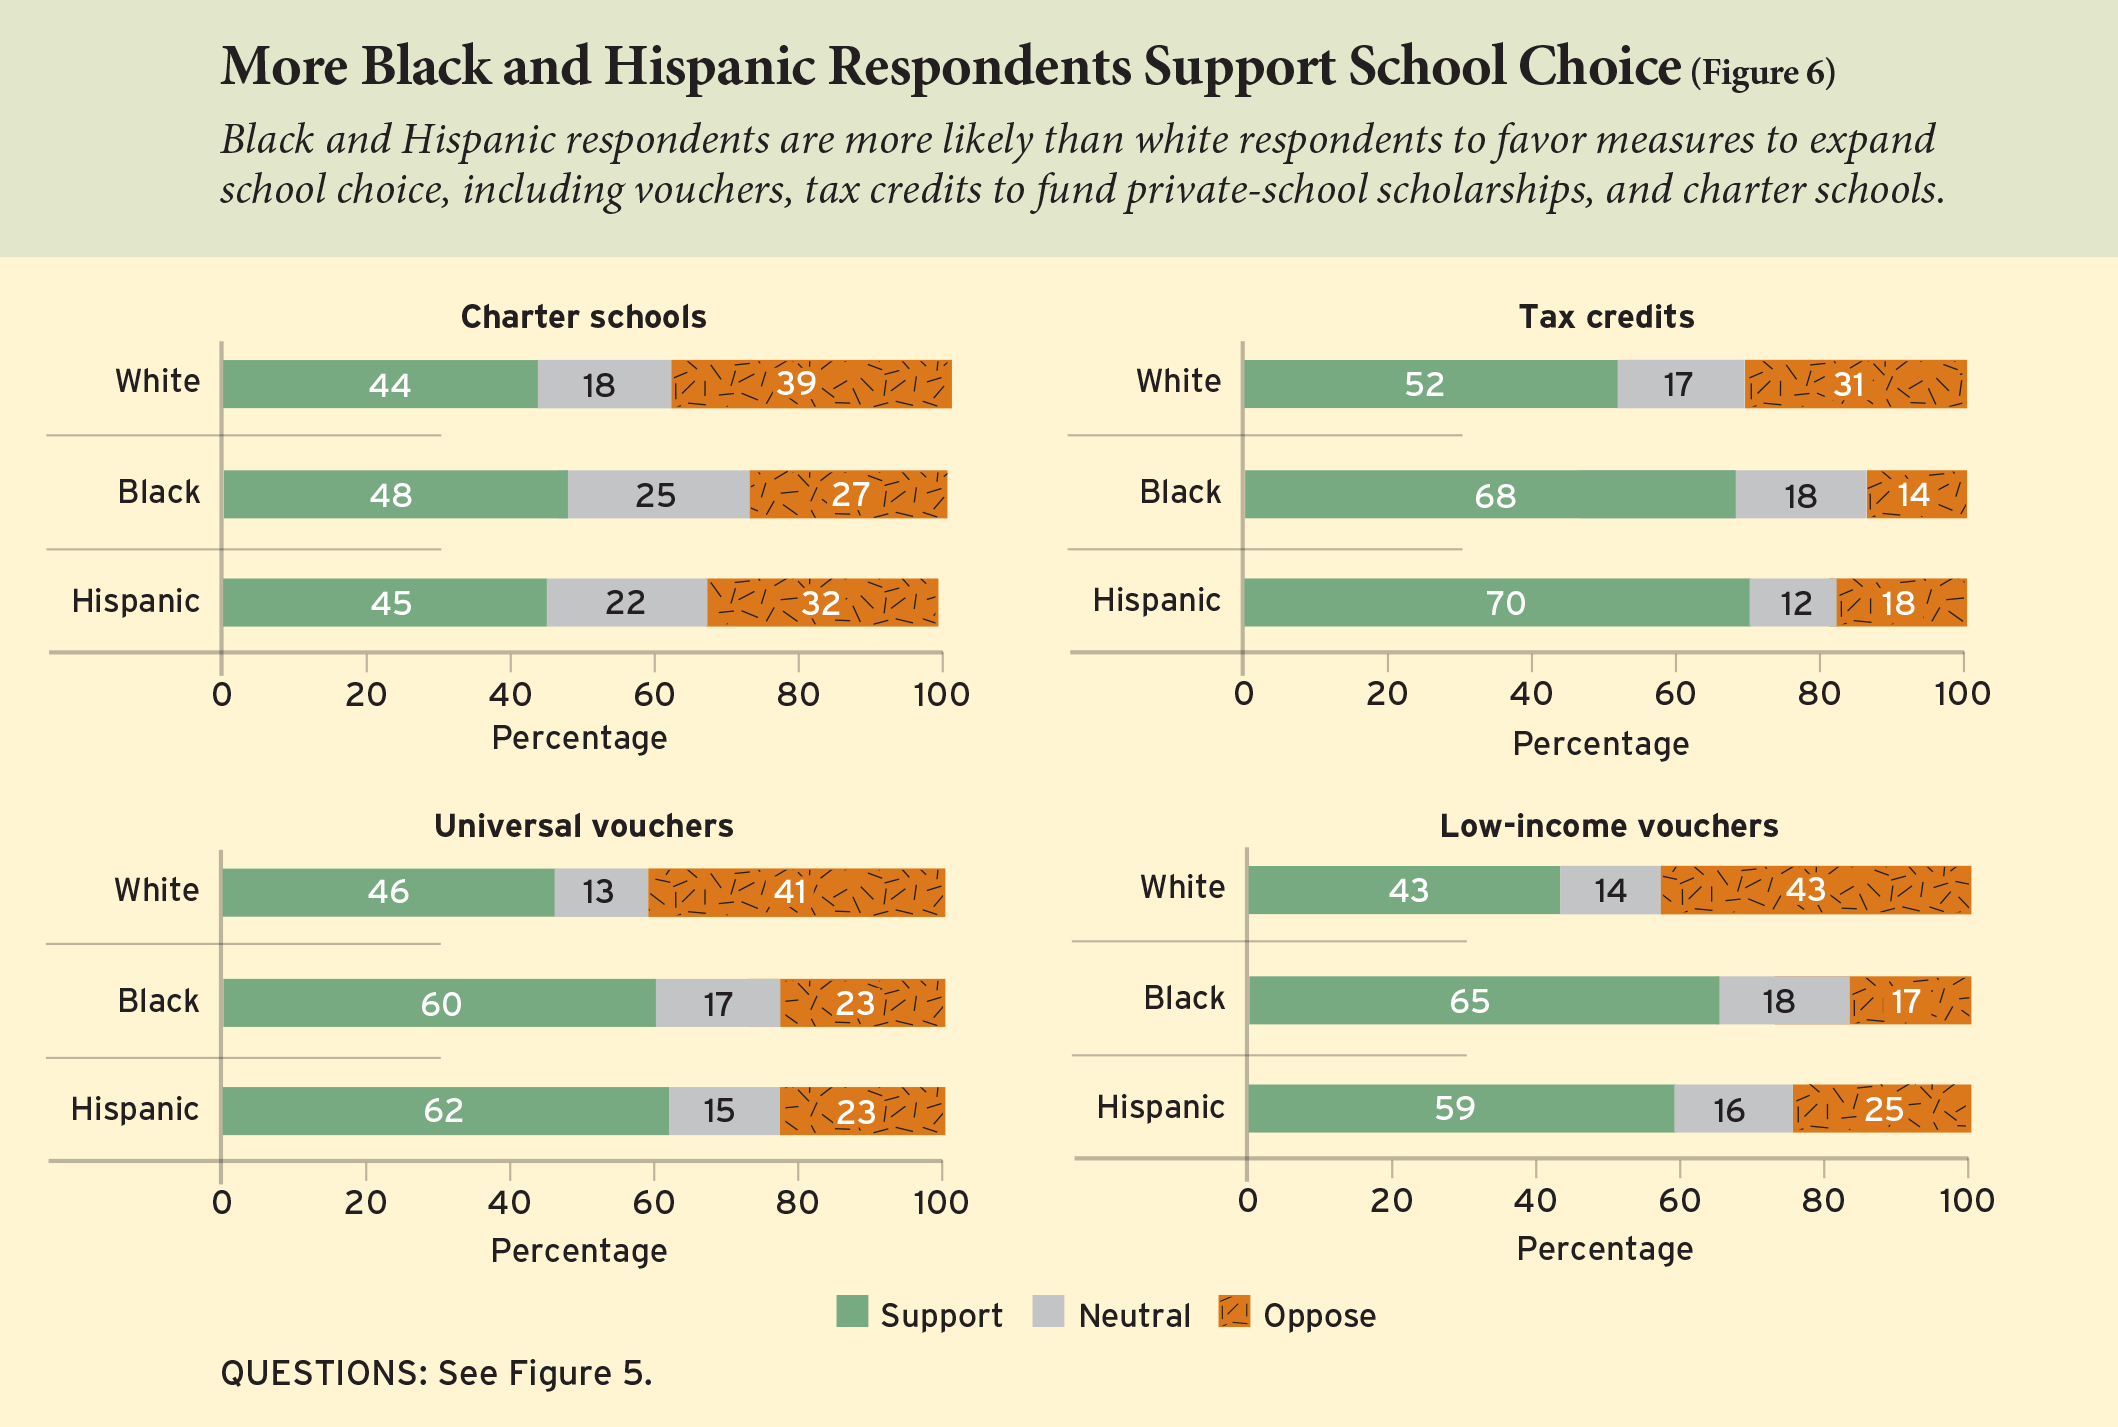
Among the Black community, only 48% now favor charter schools, down from 55% in 2019 (see Figure 6). Yet opposition to charters has also declined, to 27% from 30% last year. One in four Black respondents now say they neither support nor oppose charter schools, perhaps reflecting continuing debate on the issue among civil rights groups. Hispanic respondents favor charter schools by a 45% to 32% margin, with 22% taking a neutral stance. White respondents are more evenly split, with 44% in support and 39% opposed.
Compared to charters, publicly funded vouchers to attend private schools command slightly higher support from adherents of both parties and from the public as a whole. A slim majority (51%) favor a “universal” voucher program that extends the benefit to all families with children in public schools—and 48% support offering vouchers exclusively to low-income students. Vouchers continue to draw strong approval from Black respondents (60% for universal vouchers; 65% for low-income vouchers) and Hispanic respondents (62% for universal vouchers; 59% for low-income vouchers). Universal vouchers are more popular among Republicans than Democrats (56% to 47%), but the reverse is true of vouchers targeted to low-income students (45% to 52%). Perhaps surprisingly, neither type of voucher program proves to be as polarizing as charter schools.
Tax credits to subsidize donations to private-school scholarship funds—which recently received a strong boost from the U.S. Supreme Court’s decision in Espinoza v. Montana Department of Revenue—continue to be the most popular school-choice reform investigated in our survey. Fifty-seven percent of the general public favor such credits. Black (68%) and Hispanic (70%) Americans form key constituencies of this policy tool. Tax credits also span the political divide, commanding majorities from adherents of both parties (56% of Democrats and 59% of Republicans).
Teacher policies. Merit-based pay, the practice of compensating teachers in part on how much their students learn, garners support from 47% of the public—identical to last year and statistically indistinguishable from the two years prior. Parents are somewhat more skeptical of this approach, with 42% in support. Meanwhile, only 15% of teachers favor structuring their pay along these lines. Merit pay maintains majority support among Republicans (55%) compared to only 41% of Democrats.
Coinciding with the teachers strikes for higher pay over the last few years, positive views of teachers unions rose to 44% in 2019 from 32% in 2016. In 2020, this enthusiasm ticked downward slightly, to 41%. Teachers themselves are considerably more likely to say that their unions have a positive effect on local schools (66%), but nearly one in five educators hold negative views of teachers unions (18%).
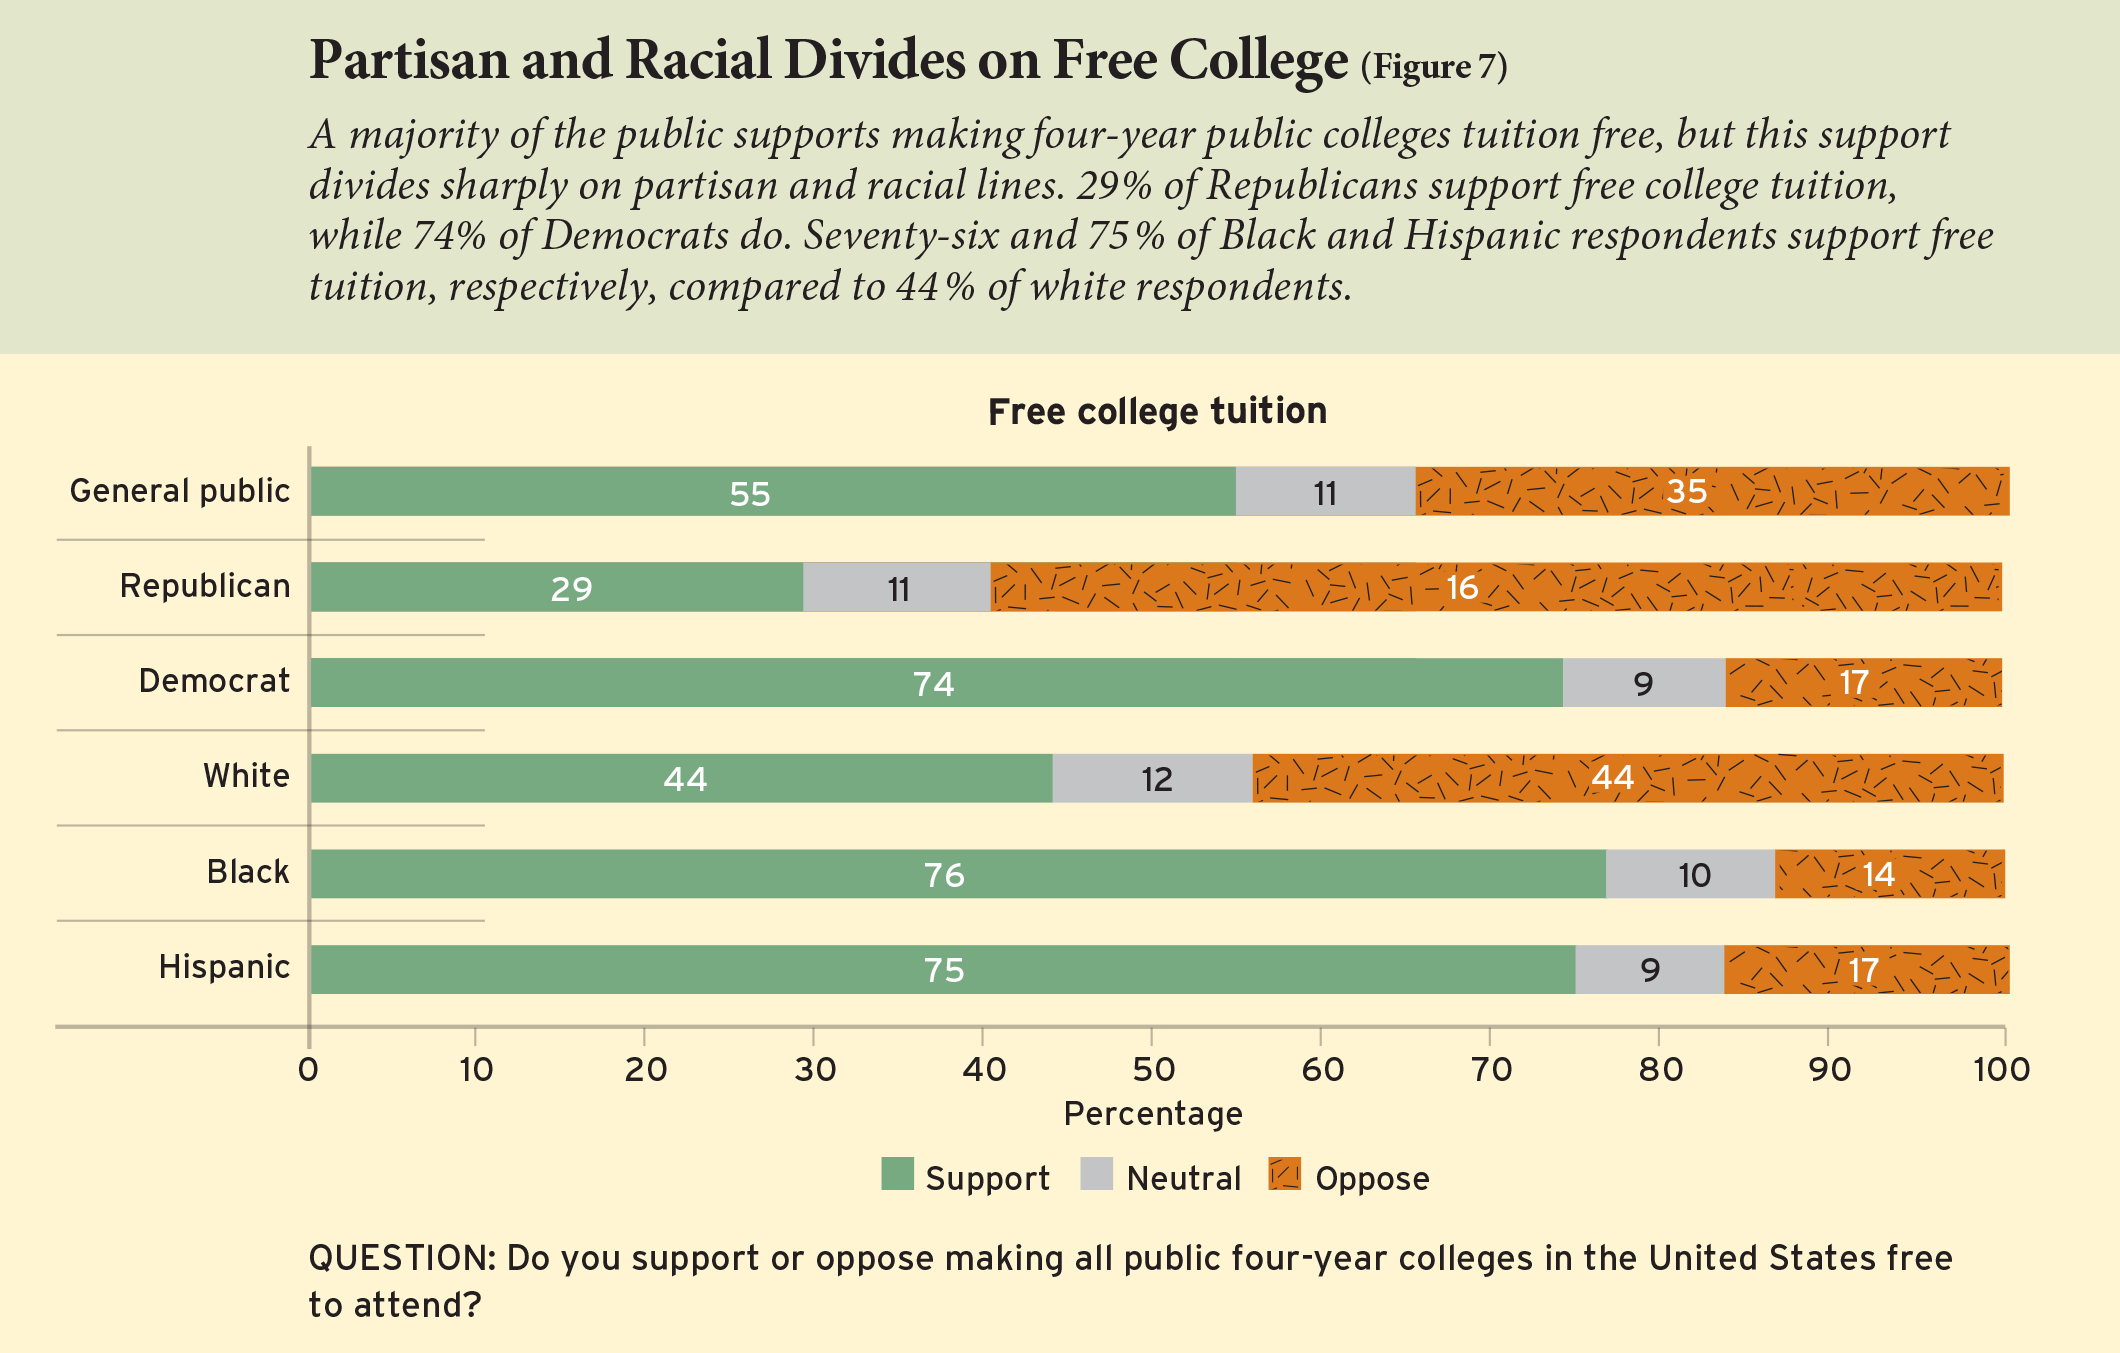
Higher education. During the Democratic presidential primary campaign, U.S. Senator Bernie Sanders called for making all public four-year colleges tuition-free. Many of his competitors advanced similar proposals for increasing college affordability. Last year’s Education Next survey, administered at the height of this debate, found that fully 60% of Americans agreed with Sanders’s position. Now that the Democratic nomination process is effectively over and the political conversation has shifted to other topics, support for free public college has slipped to 55% (see Figure 7). This proposal is considerably more popular among Black (76%) and Hispanic (75%) respondents than white (44%) respondents. Fully 74% of Democrats favor free public college, compared to only 29% of Republicans.

We also asked respondents whether they support allowing undocumented immigrants—including the “Dreamers” recently protected by the Supreme Court’s decision in Department of Homeland Security v. University of California—to be eligible for in-state college tuition rates if they graduate from a local high school. Forty-six percent of respondents say they do favor this policy (see Figure 8). Support is notably higher among Hispanic respondents (73%) than among white respondents (37%). Democrats (66%) are also more favorably inclined toward granting in-state tuition rates to undocumented immigrants than are Republicans (22%).
Grading Schools, Colleges, and Universities
K–12 public schools. The Education Next survey has asked Americans to “grade” their public schools every year since 2007. Never before have our survey respondents been asked to make this assessment during a global pandemic that has shuttered nearly every school building, sending educators and families scrambling to piece together workable distance-learning options. How do Americans think their public schools performed during this extraordinary moment of upheaval?
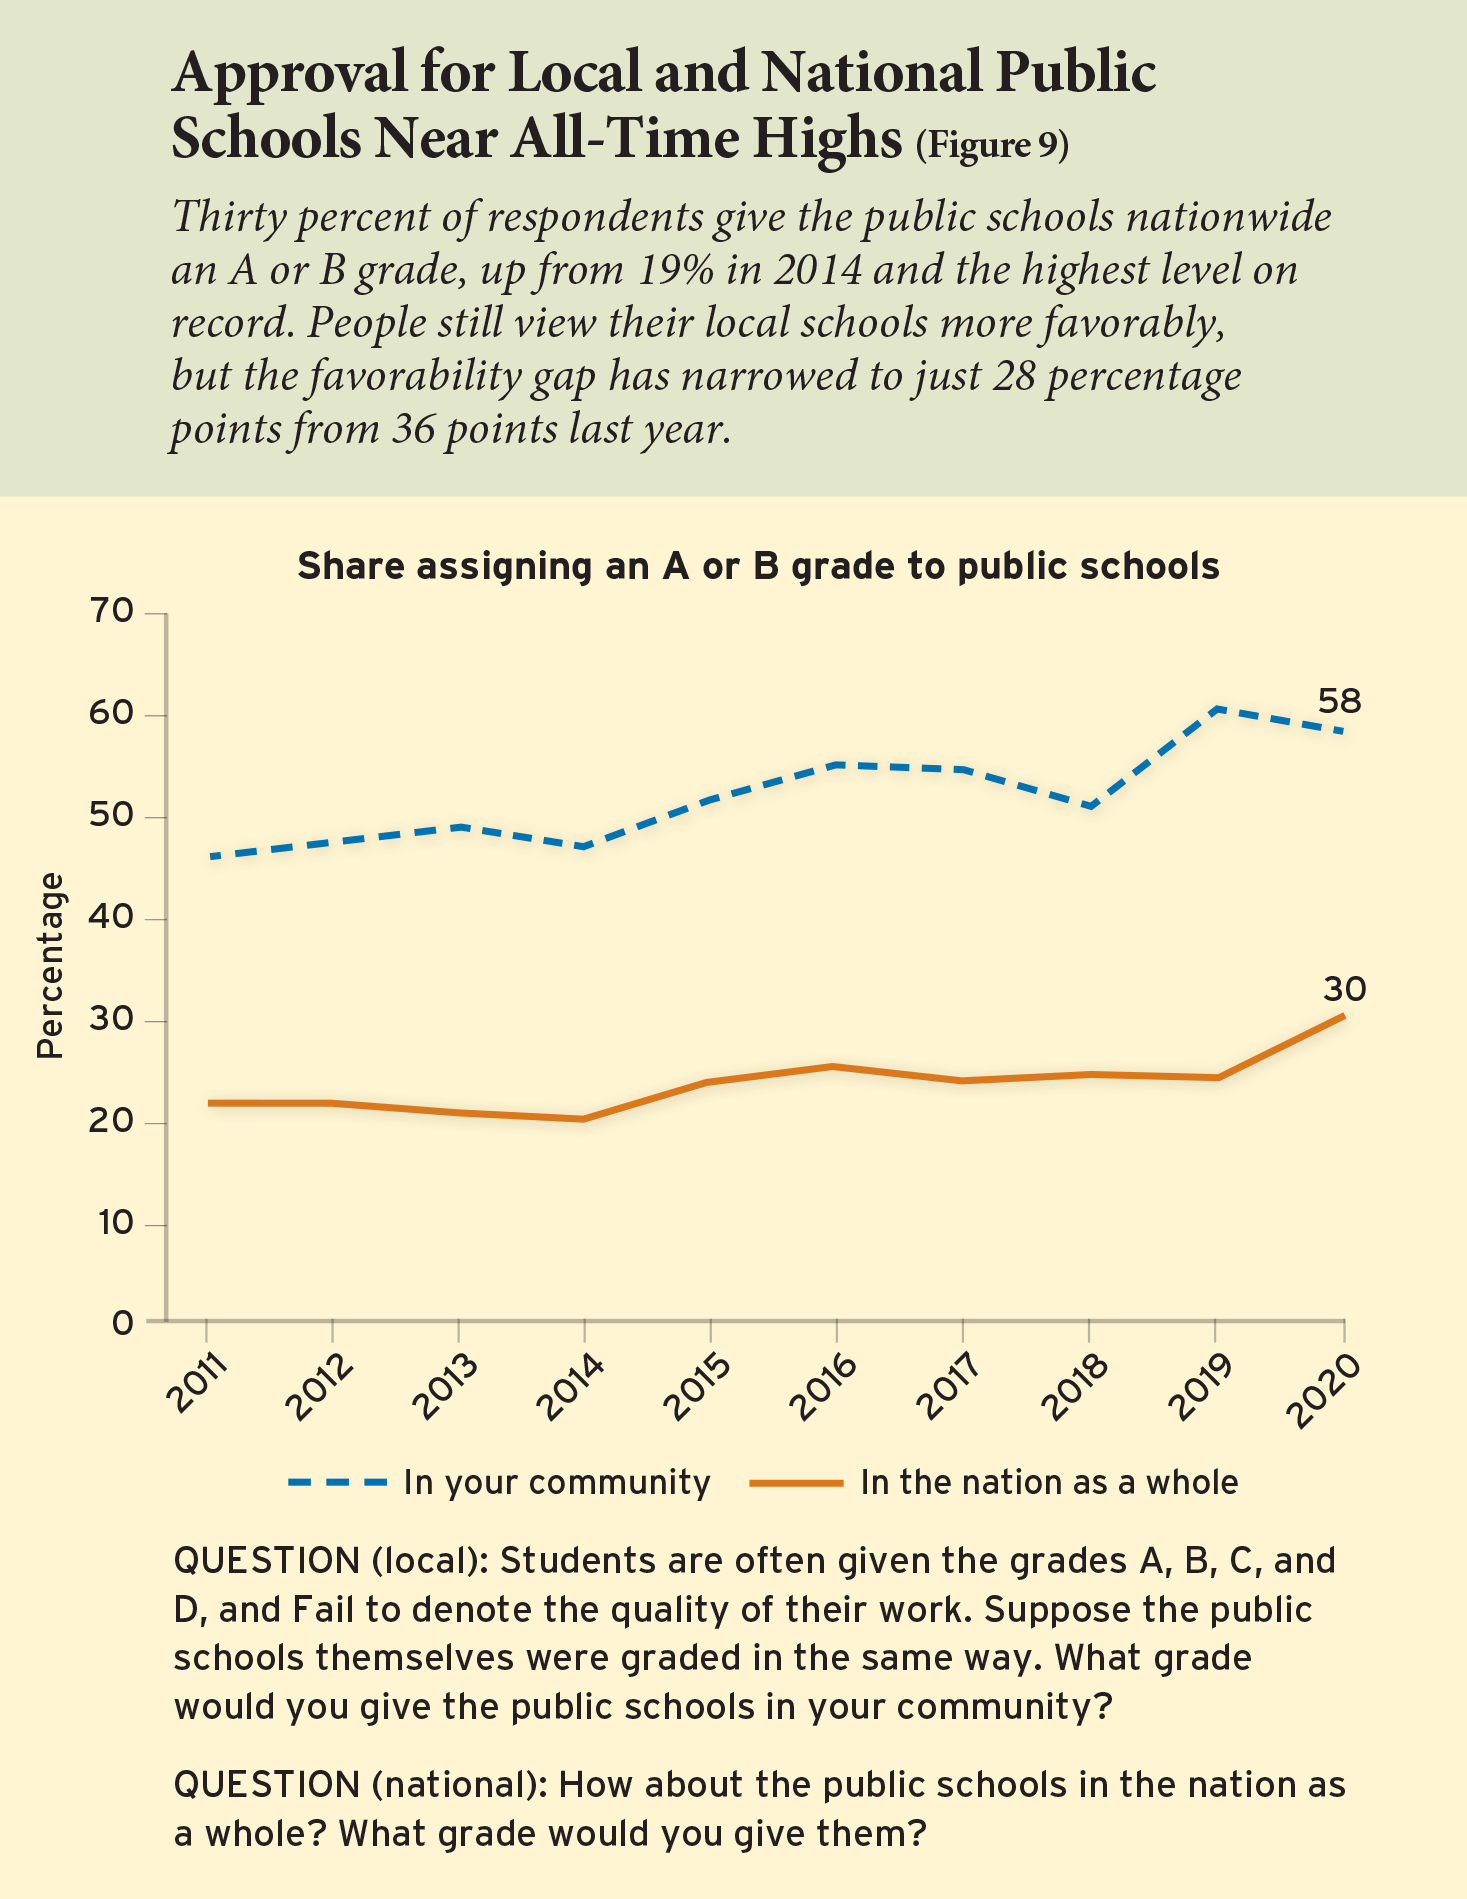
Despite the challenges, confidence in public K–12 schooling remains at a record-high level. Fifty-eight percent of respondents give their local public schools a grade of A or B (see Figure 9). This level of approval is only 2 percentage points lower than it was in 2019, when it reached the highest point in the history of the survey. Americans have long viewed their local public schools more positively than they do public schools in the nation as a whole. This holds true in 2020, but the opinion gap has narrowed. This year, 30% of respondents give the nation’s public schools a grade of A or B. This rating represents a 6-percentage-point increase from 2019 and is the highest level the survey has ever recorded, reducing the local-national opinion gap by 8 percentage points.
We also asked respondents to evaluate the quality of teachers in their local schools by assigning a percentage of them to the following four categories: excellent, good, satisfactory, or unsatisfactory. In 2018, the last time our survey featured this question, respondents categorized 56% of teachers as either excellent or good and 16% of teachers as unsatisfactory. In 2020, the public’s view of teachers ticks upward. Respondents categorize 61% of teachers as either excellent or good and 14% as unsatisfactory. Views about teacher quality are generally consistent across racial/ethnic, economic, and political lines. Only teachers themselves place a meaningfully larger proportion into the excellent or good categories (71%) and a smaller proportion into the unsatisfactory category (9%).
Does this robust confidence in the schools reflect stalwart support for the institution of public education, or does it perhaps indicate something else—an enthusiasm for the alternative modes of learning that the pandemic has suddenly introduced to a larger audience? Our data suggest that both interpretations may contain an element of truth. From our analysis of parents who experienced school closures, we know that satisfaction remains strong despite widespread perceptions that students are learning less at home than they would have if schools were open as usual. At the same time, we observe that support for online learning is also up. What is overwhelmingly clear, however, is that Americans’ views of their public schools are undimmed by the unprecedented challenges wrought by the school closures.
Colleges and universities. In the early days of the coronavirus crisis, prominent universities like Harvard and Stanford made headlines by closing their campuses and sending students home to finish the semester online. Nearly all colleges and universities eventually followed suit, resulting in a massive interruption of the college experience of students across the country. The survey allows us to discover how attitudes toward institutions of higher education have shifted in the wake of the pandemic.
Last year, we introduced a new set of questions asking respondents to evaluate four-year colleges and universities in the same way they evaluate elementary and secondary schools for the survey. Respondents are randomly assigned to receive one of four possible versions of the question, focusing on either public or private institutions and either institutions in their state or in the nation as a whole. As with K–12 education, Americans hold more positive views of nearby institutions than those in the nation as a whole. However, these views may be converging. The percentage of respondents giving in-state public colleges and universities an A or B dropped to 69% in 2020 from 78% in 2019. The analogous response for in-state private colleges and universities fell to 74% from 79%. Meanwhile, for institutions of higher education nationwide, the pattern reversed. The proportion of respondents giving an A or B to public and private colleges and universities in the nation as a whole both rose by 4 percentage points this year to 62% and 70%, respectively. Since this time last year, Americans appear to have grown more critical of in-state institutions but more supportive of their counterparts around the country.
The Trump Effect
The Trump era has seen ever-widening fissures between members of America’s two major political parties. Just as previous Education Next surveys have measured how the contemporaneous president’s views might shape those of the electorate, we once again set about examining this topic—this time looking at the possible influences of both President Donald Trump and former President Barack Obama.
To assess these influences, we examined the results from a series of experiments in which we randomly divided our survey sample into groups who received slightly different versions of the same question. One group of respondents was simply asked to register an opinion on an issue, while another group was first told Trump’s position on it. We conducted these experiments on five topics: Common Core, charter schools, tax credits, merit pay for teachers, and in-state college tuition rates for undocumented immigrants who graduate from high school in the respondent’s state. Trump opposes the Common Core and allowing undocumented immigrants to be eligible for in-state college tuition rates, but he supports the other three policies. We conducted similar experiments with Trump’s views in 2017 as well as with former President Barack Obama’s positions in 2009 and 2010, allowing us to compare the persuasive effects of presidential views over time.
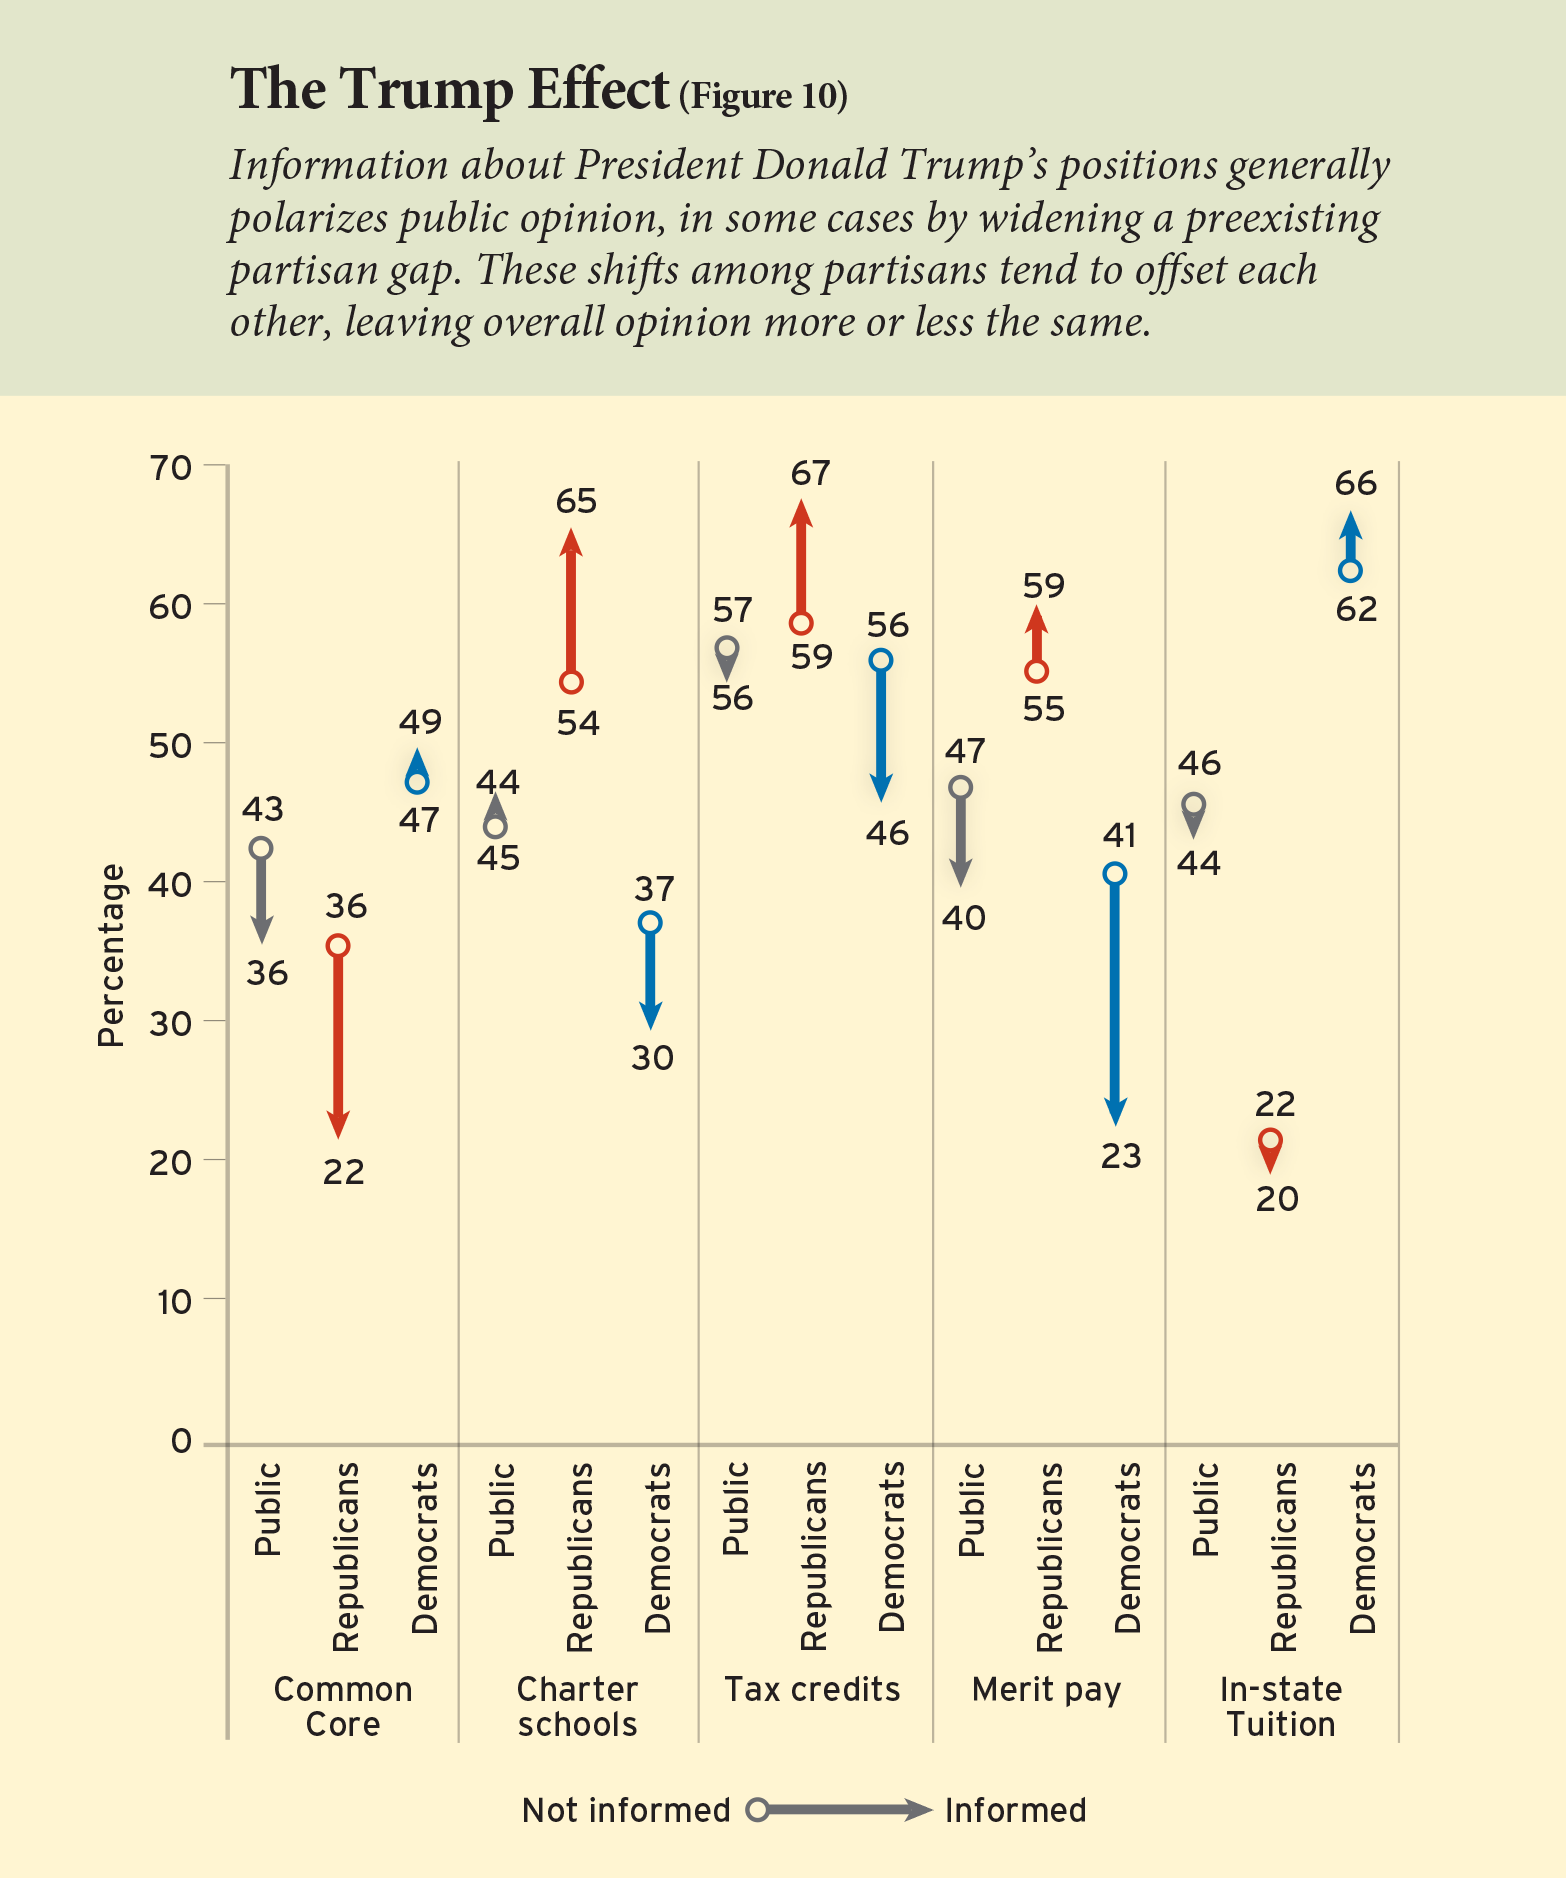
Generally, information about Trump’s positions polarizes opinion—as it did in 2017 and as similar information about Obama did a decade ago. For example, there is no overall difference in support between those who are informed of Trump’s stance (45%) and those who are not (44%)—but this finding masks important crosscutting effects. Information about Trump’s position suppresses support for charter schools among Democrats by 7 percentage points (to 30% from 37%) while boosting support among Republicans by 11 percentage points (to 65% from 54%). As a result, the 17-percentage-point gap between Republicans and Democrats without information about Trump’s position doubles to a 35-percentage-point gap among those who receive this information (see Figure 10).
The same pattern holds for attitudes toward tax credits for donations to fund scholarships for low-income students to attend private schools. In this case, there is no discernible difference between Democratic support (56%) and Republican support (59%) when respondents are not informed of Trump’s support for this proposal. Information about Trump’s support decreases Democratic support to 46% and increases Republican support to 67%, opening a gap of 21 percentage points between parties. These shifts among partisans offset each other and leave no discernible change in overall opinion.
In other cases, information about Trump’s position widens the gap between Democrats and Republicans by shifting opinion among followers of one party but not the other. For example, information about Trump’s opposition to the Common Core standards reduces overall support by 7 percentage points, to 36% from 43%, but the drop is almost entirely among Republicans, whose support falls by 14 percentage points, to 22% from 36%. By contrast, Trump’s opposition to the Common Core has no significant effect among Democrats. As a result, the gap between party adherents widens from 13 percentage points among respondents not told of Trump’s position, to a 25-percentage-point difference. Among the public at large, support for Common Core drops to 36% from 43% when respondents are told about Trump’s position.
On the issue of merit pay, Trump’s support repels Democrats, whose approval drops to 23% from 41%. Yet, the president’s position has no significant effect among Republicans, 55% of whom support merit pay without information about Trump’s position and 59% of whom support it with this information. The partisan gap expands to 36 percentage points from 14 percentage points among respondents informed about Trump’s position. Among the population overall, this information depresses support to 40% from 47%.
On only one issue—a policy allowing undocumented immigrants to be eligible for the in-state college tuition rate if they graduate from a high school in the state—does information about Trump’s position fail to influence the attitudes of Democrats or Republicans. In fact, learning of Trump’s stance on this policy makes no statistically discernible impact among Democrats, Republicans, or the public as a whole.
We conducted four of these experiments in the 2017 Education Next survey—for charter schools, tax credits, Common Core, and merit pay. With the exception of the Common Core (where Trump’s position had no statistically identifiable effects for either party), the 2020 results parallel those from 2017, indicating that information about Trump’s positions are as polarizing in the fourth year of his administration as it was in the first year.
How does the Trump effect on public opinion compare to that which Obama exerted? In 2009 and 2010 surveys, we conducted a similar experiment with information about former President Barack Obama’s position on merit pay. In his first year in office, information about Obama’s support for merit pay boosted approval among both Democrats (+16 percentage points) and Republicans (+11 percentage points). However, by the next year, this information moved Democrats and Republicans in opposite directions. Democratic support for merit pay grew by 7 percentage points when they were told of Obama’s position, while Republican support dropped by 11 percentage points.
In the 2020 survey, we set out to compare the Trump effect and the Obama effect more directly. In addition to randomly assigning some respondents to be informed of Trump’s position, we randomly assigned a third group to be told Obama’s position and a fourth to learn both presidents’ positions. The Obama effect is a mirror image of the Trump effect. Information about Obama’s support for merit pay boosts support among Democrats by 9 percentage points but decreases Republican support by 20 percentage points. When respondents are told both Trump’s and Obama’s position, the effect for adherents of each party closely resembles the effect we observe when respondents are told just the position of their co-partisan president. Democrats increase support by 8 percentage points, similar to their 9-percentage-point boost, when they are told only Obama’s position. The difference among Republicans is 5 percentage points, similar to the 4-percentage-point difference among them when they are told only Trump’s position. In other words, it appears partisans tend to gravitate toward the position of a leader from their own party more than they move away from the position of a leader from the opposite party.
Populism and Education Policy
The American Revolution was a populist affair. Colonials tossed tea into Boston Harbor, erected liberty poles in town squares, and dragged a statue of King George III to the ground. The new nation’s first constitution, the Articles of Confederation, banned delegates from serving in Congress for more than three years out of six. That legacy has proved enduring. The Twenty-Second Amendment to the U.S. Constitution restricts presidents to two terms, and many states have placed term limits on governors, members of state legislatures, and even their federal Congressional representatives.
Political observers in both the media and academia have noted a rise of populist movements and leaders in American and global politics over the past decade. While definitions of populism differ somewhat, most pundits agree that it involves a belief that political leaders too often neglect the interests of “the people.” In the United States, the current rise of populism is most often associated with President Trump, but some observers also point to Democrats Bernie Sanders and Elizabeth Warren as populist voices. Is the rise of populism shaping the politics of American education?
To find out, we asked respondents whether they thought “elected officials should always follow the will of the people,” whether the “people, not elected officials, should make our most important policy decisions,” whether they “would rather be represented by an ordinary citizen than by an experienced elected official,” and three more such questions. To all of them, large majorities give an affirmative response.
Still, some respondents are more emphatically populist than others. A sizable share “strongly agree” with many of the items, while others give a more moderate “somewhat agree” response or say they neither agree nor disagree. A small percentage—often less than a quarter—disagree. We constructed a “populism scale” based on the responses to these questions, and then divided respondents into four quartiles according to their rankings on that scale. This technique allowed us to look at how the opinions of the most- and least-populist respondents differ on various education-related topics.
Who are the populists?
The demographics of populism are in many ways consistent with conventional thinking about this emerging political force in American politics. The older, less-educated, lower-income, Evangelical segments of the population are more likely to be suspicious of elected officials than the younger, more educated, affluent, and secular segments. Only 45% of those under the age of 30 rank above the median of the distribution on the populism scale, as compared to 59% over the age of 60. Fifty-four percent of those without a bachelor’s degree rank above the median, while only 43% of those with a college degree share that degree of populist fervor. Similarly, only 46% those who report an income of $75,000 or more rank above the median on the populism scale, while 51% of those who report incomes below $25,000 and 56% of those who report incomes between $25,000 and $75,000, are found in the top two populist quartiles. Fifty-five percent of those who say they have been “born again” are populist, as compared to 48% who do not report that religious experience.
Some demographic segments, however, defy the conventional portrait. For one thing, ethnic differences are not great, and do not necessarily occur in the direction one might predict. Hispanic Americans are more populist (55% rank above the median) than white Americans (50%) or Black Americans (48%). Even more surprising is the fairly modest correlation between political ideology and populism. While it is true that 57% of conservatives score above the median in their populist orientation, so do 43% of liberals. And even though 56% of Republicans fall into the more populist categories, so do 46% of Democrats. In other words, populism seems to form its own distinctive brand. While it overlaps Republican conservatism, its principles do not wholly align with the conventional fault lines of party and ideology. Finally, it is incorrect to view populists as alienated outsiders who want nothing to do with contemporary political battles. On the contrary, populists are just about as likely to be engaged in politics as others. While 51% of those who say they never or almost never participate in politics affirm a more populist position, so do 47% of those who say they are sometimes or often engaged in politics.
What do populists think about schools and school policy?
To see whether populists hold distinct views on policy, we compared the survey responses of those in the highest and lowest quartiles of the populist distribution. We found that the most-populist group is more critical of schools, thinks less well of Common Core, and is more in favor of school choice. In other words, populists are applying their more general political beliefs to the educational issues of the day.
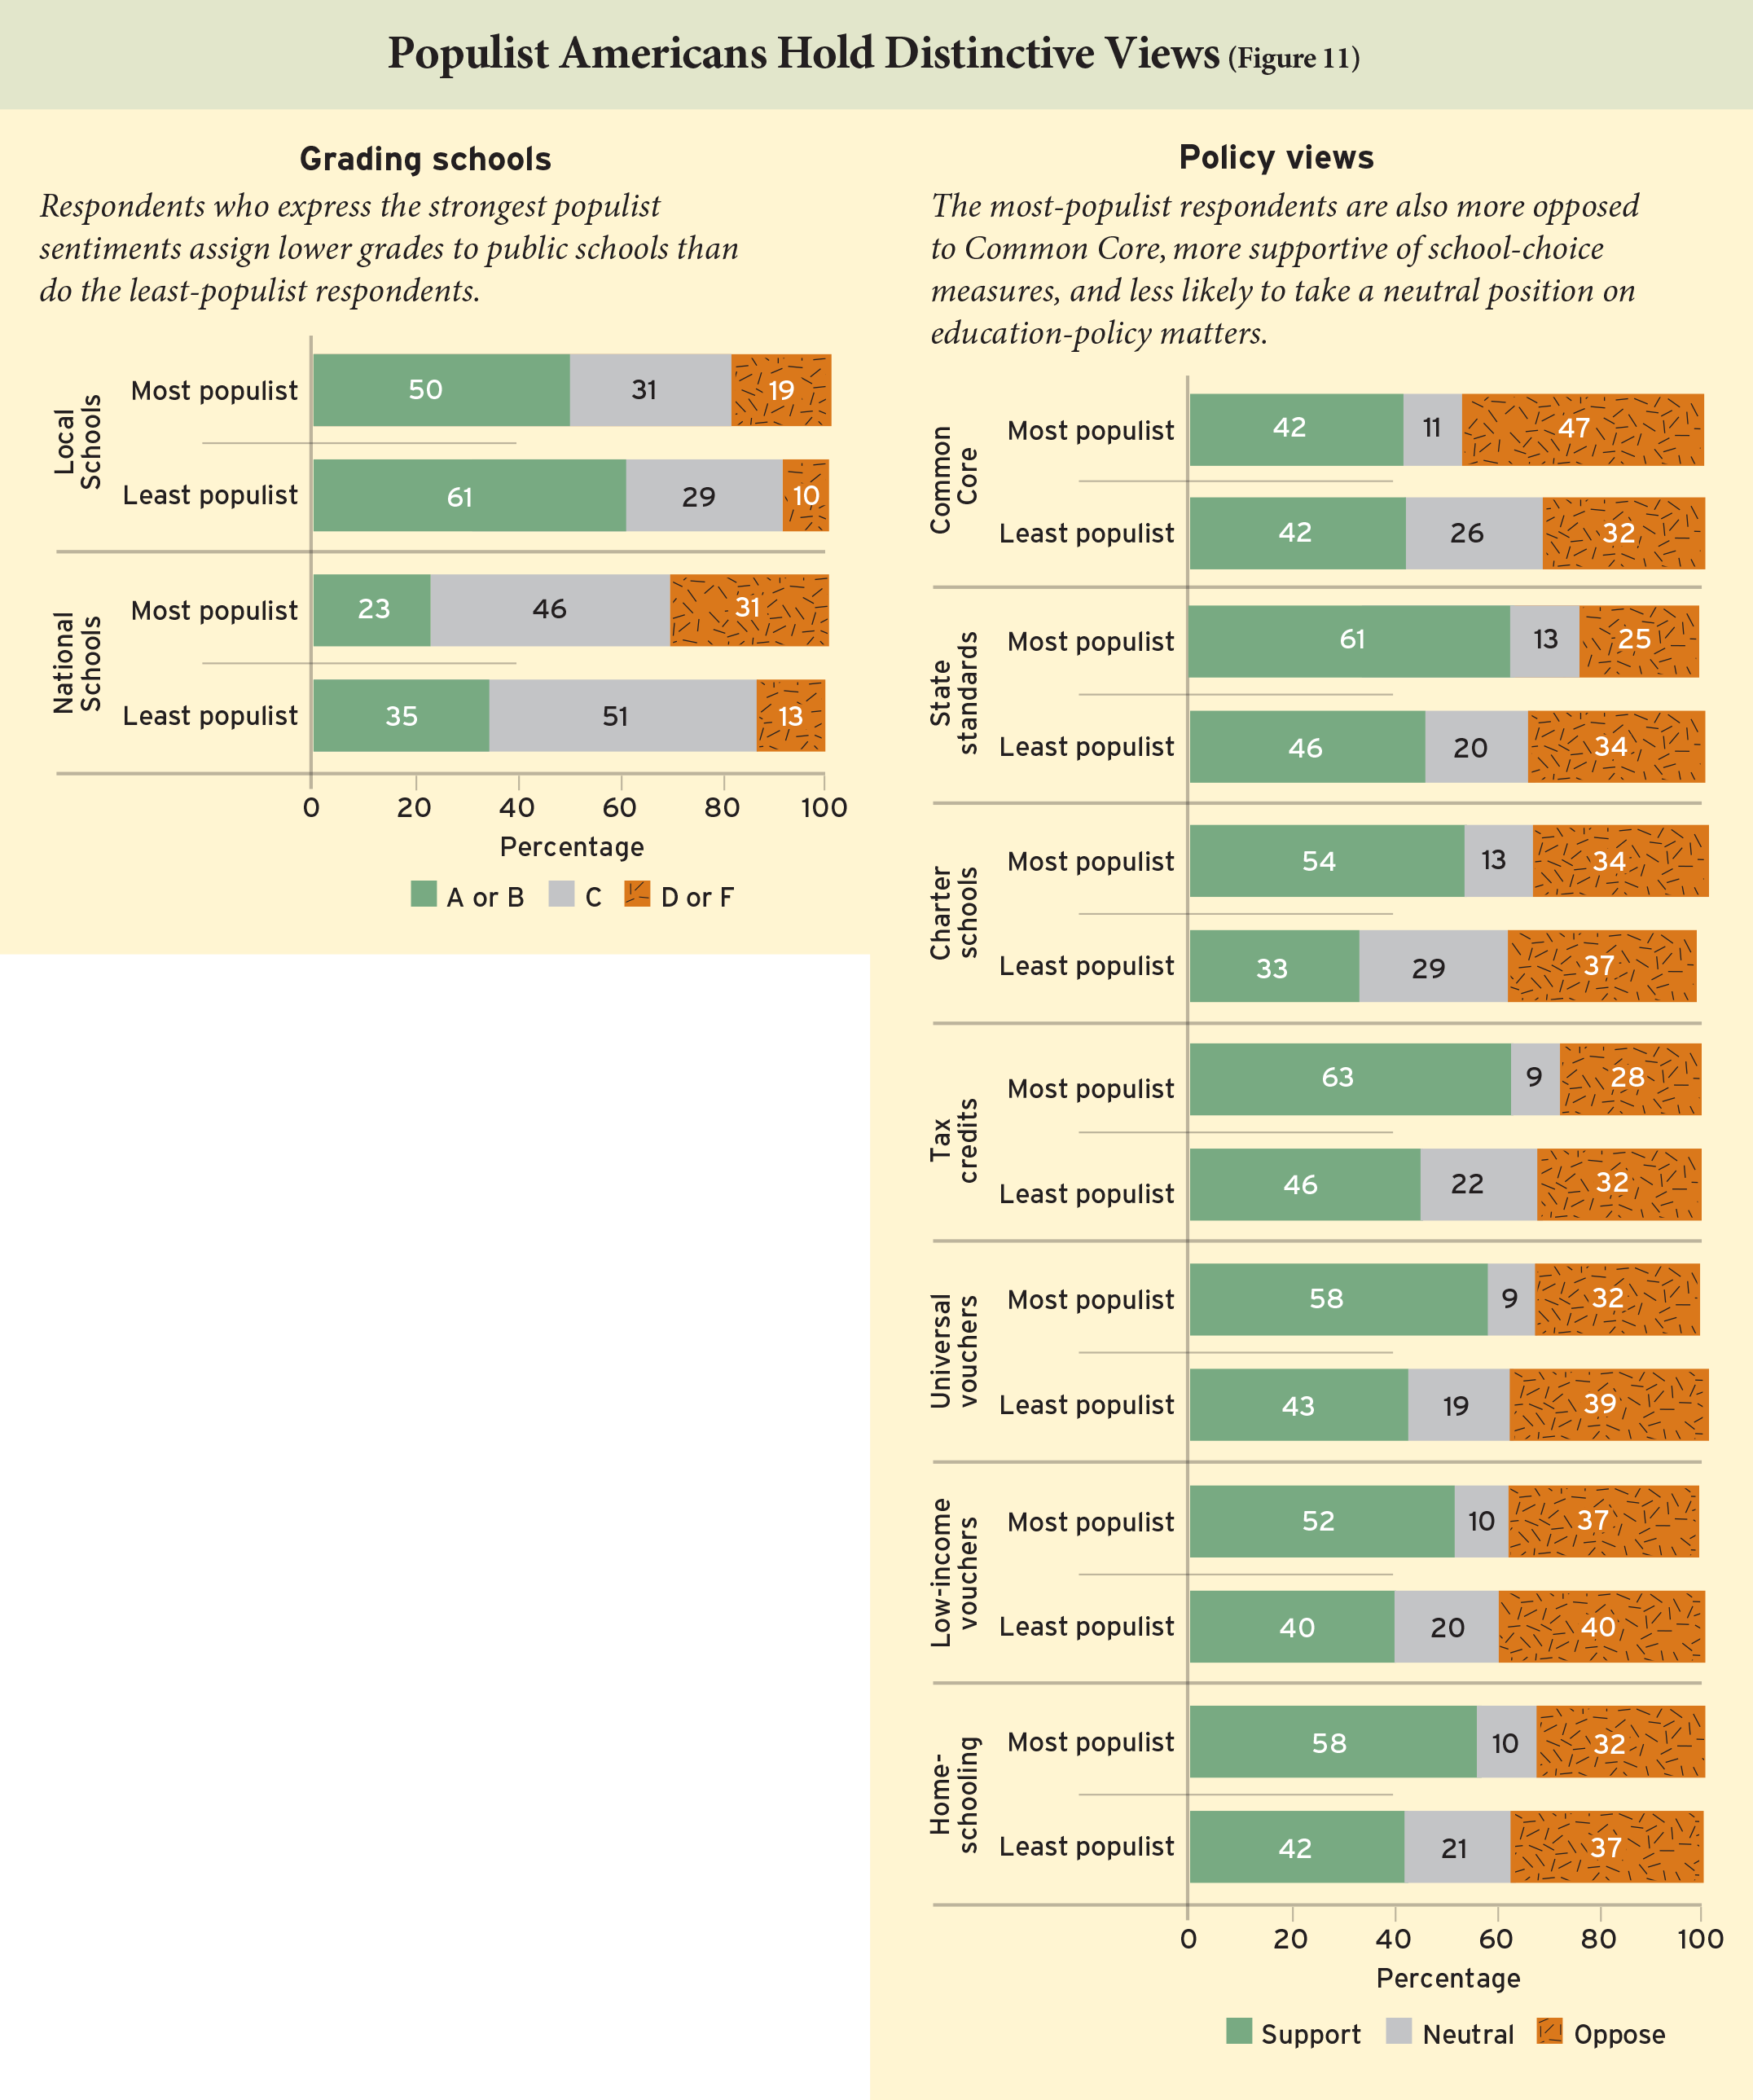
Populists are less happy with public schools. The Education Next survey asked respondents to assign grades of A to F to public schools in the nation as a whole. Among those in the most-populist quartile, only 23% give schools a grade of A or B, while 31% assign them a D or fail them. In the least-populist quartile, 35% award the nation’s schools one of the top two grades, while only 13% stick them with one of the worst two (see Figure 11). Populists give higher grades to schools in their local communities, but even in this instance populists are more critical than others. Among those in the most-populist quartile, 50% of respondents award a grade of A or B, while 19% give them a D or an F. By comparison, 61% of those in the least-populist quartile gave schools in their community one of the two highest grades, while only 10% found them worthy of no better than a D. The conventional wisdom that populists are unhappier with the status quo seems vindicated.
Populists support school choice. Since populists are less happy with the state of public schools nationwide, they might be expected to support school choice. To see if that is so, we looked at responses to questions related to vouchers, charters, tax credits and homeschooling. In every case we found that the most-populist quartile is much more supportive of greater school choice than the least-populist quartile. The differences in the level of support is 21 percentage points for charter schools, 17 percentage points for tax-credits for scholarships for low-income students, 16 percentage points for allowing parents to educate their children at home, 15 percentage points for vouchers for all, and 12 percentage points for vouchers for low-income students. Among respondents who are told that Trump favors charters and tax credits, the differences enlarge only marginally. In other words, populists seem willing to translate their ideals into actions. Just as they want the people to govern, so are they more likely to think people should have options when it comes to their children’s education.
Finally, on all the choice questions, the least-populist respondents were the most likely to take a neutral position, saying they neither favored nor opposed a policy. The average difference between the least-populist and the most-populist groups on all these questions was a sizable 12 percentage points. Those who are less likely to insist that elected officials respond to the will of the people are also less likely to take one side or the other on educational issues. Just as populists are consistent in thinking that the people should be in charge, those who are not populist are more willing to let others make the call.
Populists register more opposition to Common Core standards but more support for generic national standards. If populists distrust elites, they can be expected to oppose reforms they perceive as mandates from higher tiers of government. To see if this thesis applies to populists’ views on education policy, we asked randomly assigned respondents one of three variations on a question about common academic standards. The first version inquired about Common Core standards. Surprisingly, 42% of those in both the most-populist and least-populist quartiles say they favor the standards. However, opposition to the Common Core is much higher among the most populist (47%) than among the least populist (32%). Further, the least populist are more likely to say they neither support nor oppose the Common Core (26% to 11%), still another example of their reluctance to take a position on one or another side of an issue.
In the second version of the Common Core question, another randomly chosen group of respondents was told that Trump opposes the Common Core. That information reduces levels of support for the policy to 35% among both those in the highest and lowest quartiles on the populism scale, but it has little effect on opposition to the policy. Forty-four percent of the most populist register disapproval, as do 34% of the least populist, about the same as responses to Common Core when the president’s views go unmentioned. Again, the least-populist respondents are more likely to choose the neutral position.
In the third version of the common standards question, the name “Common Core” is omitted while everything else in the question remains the same. Levels of support for common standards soars among the most-populist group to 61%, while those in the least-populist group remain more or less unchanged (at 46%). Either populists think that such policies are better left to the states, or the Common Core brand continues to be especially toxic for them. Once again, the least-populist group is more likely to hold a neutral position.
In sum, populism is an identifiable set of ideas that help shape an individual’s policy positions. Populist sentiments are widespread, but those who hold them with the greatest intensity also view American schools more critically at both the national and local levels. They are more likely to support all forms of school choice, and they are more likely to disapprove of Common Core, but not of generic national standards. The least populist are more likely to say they neither support nor oppose a policy, a position that is consistent with their quite un-populist readiness to defer to the leadership of elected officials.
Michael B. Henderson is assistant professor at Louisiana State University’s Manship School of Mass Communication and director of its Public Policy Research Lab. David M. Houston is assistant professor of education policy at George Mason University. Paul E. Peterson is the Henry Lee Shattuck professor of government at Harvard University, director of Harvard University’s Program on Education Policy and Governance (PEPG), and senior editor of Education Next. M. Danish Shakeel is a postdoctoral research fellow at PEPG. Martin R. West, William Henry Bloomberg professor of education at Harvard University, is deputy director of PEPG and editor-in-chief of Education Next.
Survey Methodology
The data for this report come from the 14th annual Education Next survey, a series that began in 2007. Results from all prior surveys are available at www.educationnext.org/edfacts.
The survey was conducted from May 14 to May 20, 2020, by the polling firm Ipsos Public Affairs via its KnowledgePanel®. In its KnowledgePanel®, Ipsos Public Affairs maintains a nationally representative panel of adults (obtained via address-based sampling techniques) who agree to participate in a limited number of online surveys. Ipsos Public Affairs provides Internet access and a device to any participants in the KnowledgePanel® who lack them. Those who participated in the Education Next survey could elect to complete it in English or Spanish.
The total sample for the survey includes a nationally representative, stratified sample of adults (age 18 and older) in the United States (1,827), as well as representative oversamples of the following subgroups: parents of children in kindergarten through 12th grade (1,329), teachers (663), Blacks (811), and Hispanics (913). The total sample size for the 2020 Education Next survey is 4,291.
The completion rate for this survey is 49%. Survey weights were used to account for non-response and the oversampling of specific groups.
We report separately on the opinions of the general public, teachers, parents, Black respondents, Hispanic respondents, white respondents without a four-year college degree, white respondents with a four-year college degree, and self-identified Democrats and Republicans. We define parents as any respondent with a child under the age of 18 (1,677). We define Democrats and Republicans to include avowed partisans as well as respondents who say they “lean” toward one party or the other. In the 2020 EdNext survey sample, 54% of respondents identify as Democrats and 41% as Republicans; the remaining 4% identify as independent, undecided, or affiliated with another party.
We define teachers differently than in previous iterations of the survey. As in past years, we begin with an oversample of KnowledgePanel® members who work in a profession that Ipsos Public Affairs codes as teaching—a broad category that includes college professors, daycare teachers, and substitute teachers. However, this year we further screened this group by asking them which grades they teach. We define teachers as those who teach in at least one grade from kindergarten to 12th grade. This yields 523 K–12 teachers.
In general, survey responses based on larger numbers of observations are more precise, that is, less prone to sampling variance, than those based on groups with fewer numbers of observations. As a consequence, answers attributed to the national population are more precisely estimated than are those attributed to groups (such as teachers, Black respondents, or Hispanic respondents). The margin of error for binary responses given by respondents in the main sample in the survey is approximately 1.5 percentage points for questions on which opinion is evenly split. The specific number of respondents varies from question to question, owing to non-response on items and to the fact that, for several survey questions, we randomly divided the sample into multiple groups to examine the effect of variations in the way questions were posed. The exact wording of each question is available at www.educationnext.org/edfacts. Percentages reported in the figures and online tables do not always sum to 100, as a result of rounding to the nearest percentage point.
Information used in the experiments involving school-district spending and revenue were taken from the 2016–17 National Center for Education Statistics (NCES) Common Core of Data’s Local Education Agency Finance Survey for fiscal year 2017, version 1a, the most recent one available at the time the survey was prepared. Information used in the experiments involving state teacher salaries were drawn from the NCES Digest of Education Statistics, 2018 (Table 211.6), the most recent data available at the time the survey was prepared.
This article appeared in the Winter 2021 issue of Education Next. Suggested citation format:
Henderson, M.B., Houston, D.M., Peterson, P.E., Shakeel, M.D., and West, M.R. (2021). Amid Pandemic, Support Soars for Online Learning: Results from the 2020 Education Next survey of public opinion. Education Next, 21(1), 6-21.