
Very little in American life has remained the same since the release of A Nation at Risk. Automobiles run cleaner and safer, with the invention of the catalytic converter and the air bag. The Internet, fax, and cell phone have transformed communications. New pharmaceuticals, screening equipment, and surgical techniques have improved people’s health outcomes and quality of life. Recreational equipment has become so sophisticated that sports can reach new extremes. All tastes and preferences in food are being catered to, from whole-bean coffee and organic foods to frozen pizzas that rival the quality of Domino’s or Papa John’s.
Indicators of social health have also moved in positive directions. The average child today is growing up in a more learning-friendly family environment than ever before. For one thing, parents are more educated. By 1999, the share of the population over age 25 with a high-school diploma or its equivalent had risen to 83 percent, up from 52 percent in 1970. A quarter of adults now hold college degrees, compared with just 11 percent in 1970. In addition, families are smaller, allowing parents to focus more attention on each child. The share of American families with three children or more declined from 36 percent in 1970 to 15 percent in 2000. Children also spend more of their lives in school: 69 percent of four-year-olds are now enrolled in preschool, compared with 29 percent in 1970. True, immigration has increased, and more children now live in homes where English is not the primary language (17 percent of all children today, compared with 8 percent in 1980). Today, 31 percent of all children do not live with both of their parents, up from 15 percent three decades ago. Yet poverty rates have remained essentially unchanged, average incomes have risen steeply, welfare dependency has declined, murder rates have dropped, and drug dependence has abated.
In short, many areas of American life have changed for the better during the past two decades-except, it appears, the K-12 education system. Data from various sources-the SAT, the National Assessment of Educational Progress (NAEP), and international comparisons such as the Third International Mathematics and Science Study (TIMSS)-all reveal the same trend: despite 20 years of agitation and reform, much of it sparked by the Risk report, student achievement has at best stagnated, if not declined.
The Standard Deviation
The standard deviation is a statistical concept that will help to compare findings from a variety of assessments. This concept provides a measure of how much scores are spread around their average. In general, a full standard deviation (or 1.0 standard deviations) is considered very large. On the NAEP, for example, a standard deviation is equivalent to roughly the four years of learning between the 4th and 8th grades. If 4th graders score one standard deviation higher than average on the NAEP 4th-grade test, they are performing as well as the average 8th grader would have. Conversely, if low-performing 8th graders score a standard deviation below average on the 8th-grade exam, they are performing no better than the average 4th grader would have.
A full standard deviation also represents the amount by which the performance of Japanese middle schoolers exceeds that of their American peers on the TIMSS math exam. In a more home-grown example, it is the difference between the performance of white and African-American children in math-the so-called black-white test-score gap. This helps to explain why a change of just 50 percent of a standard deviation (0.5 of a standard deviation) is considered substantial, particularly if the change occurs within a few years. Changes of 10 percent of a standard deviation are usually considered to be quite small, but even small changes can become big ones if they accumulate over time. If student achievement in America had increased by an average of just 4 percent of a standard deviation in each year of the past two decades, overall test scores would have climbed by nearly 120 percent of a standard deviation. Such a dramatic transformation of the education system surely would have inspired a raft of popular books, with titles like $chool Dayz: What Corporate America Can Learn from Public Education. Instead, schools are being asked to take lessons from the business world.

The SAT
The SAT, the admissions exam that most college-bound high schoolers take during their junior or senior years, has several advantages as a yardstick. For one thing, it has been used to measure student performance for decades, giving psychometricians many opportunities to refine the test. For another, it is a high-stakes test. Students’ performance on the SAT affects their chances of getting into the colleges of their choice and of earning a scholarship. As a result, many students take the test seriously, studying sample questions to familiarize themselves with its general format and approach.
It also has certain limitations. Foremost is the fact that the SAT is generally taken only by college-bound high schoolers. Indeed, not even all of these students take the test. Many four-year colleges don’t require the SAT for admission; some colleges accept the ACT Assessment instead. Most junior or community colleges don’t require either test. The upshot: in 2000, only 46 percent of high-school seniors took the SAT.
To the extent that the percentage of seniors taking the test varies from year to year, scores can fluctuate for this reason alone. Critics of school reform often ascribe the drop in SAT scores to the fact that the share of high-school seniors taking the test has been increasing during the post-World War II period, potentially diluting the skills of the test-taking pool. However, studies have found that the decline in SAT scores during the 1960s and 1970s was only partially caused by a change in the social composition of those taking the test. The percentage of high-school seniors taking the test hovered at around 33 percent between 1972 and 1984, after which the share climbed to about 45 percent in 1990 and then essentially leveled off. Meanwhile, the drop in SAT scores occurred during the 1970s, when participation rates were stable. The modest revival in SAT scores occurred during the 1980s, when participation rates were actually rising.
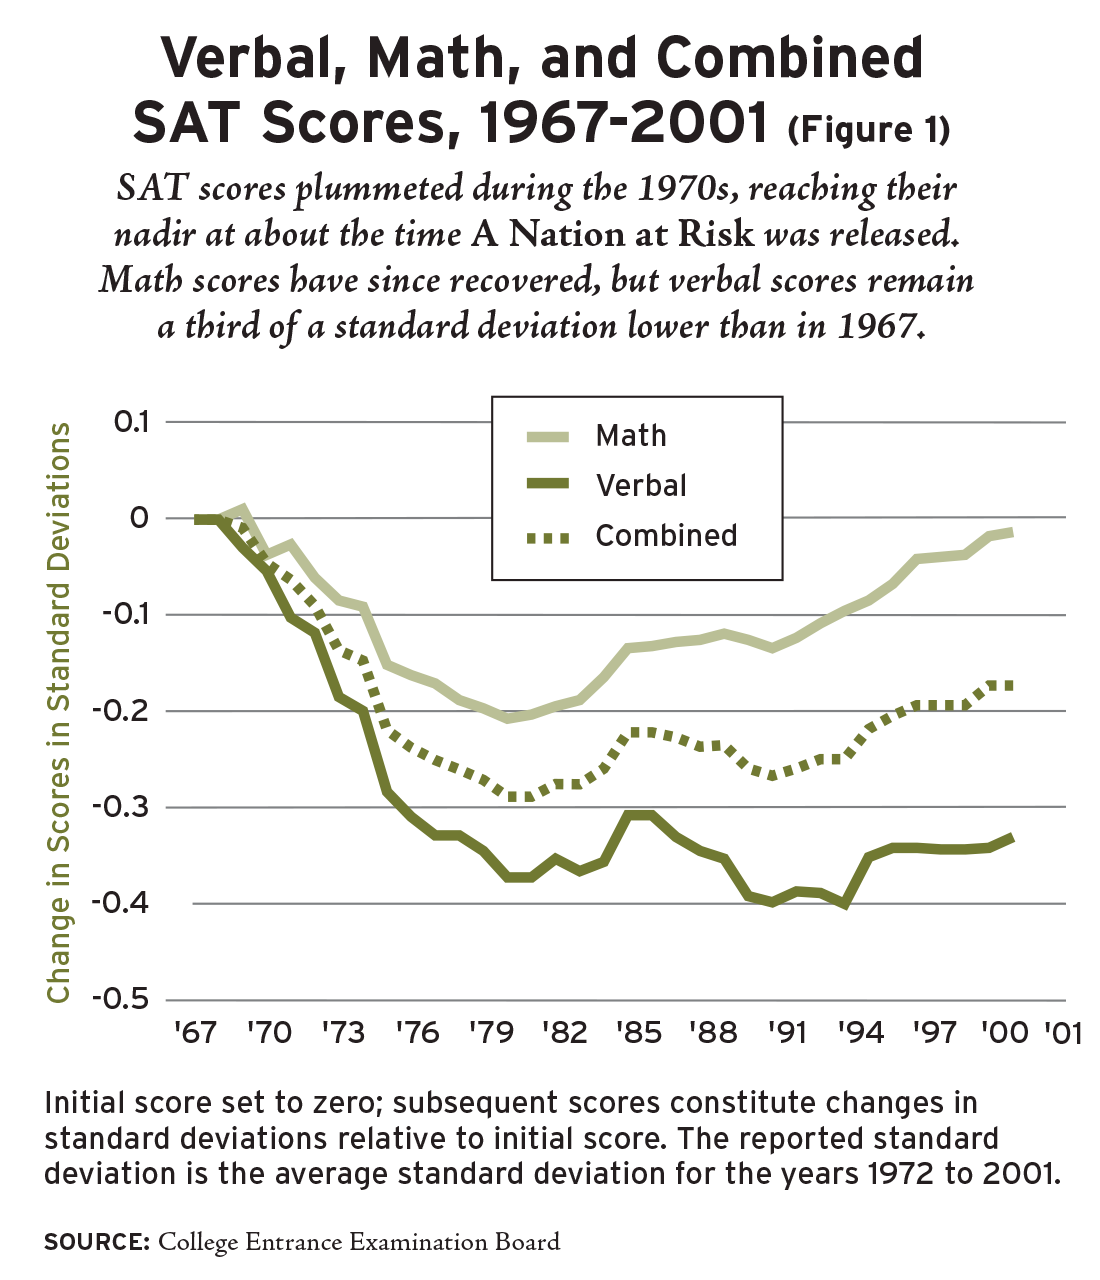
Figure 1 illustrates the trend in average SAT scores between 1967 and 2001. Between 1967 and 1982, students’ combined math and verbal scores fell by nearly 30 percent of a standard deviation, a troubling slide that precipitated the writing of Risk. Scores began to rise again in 1982, but the gains were modest: only about 15 percent of a standard deviation by 1999, or less than 1 percent per year, leaving the country well below its standing in 1967.
Now let’s look at the trends in math and verbal skills separately (see Figure 1). The difference is striking. The decline in math was never as steep, just 20 percent of a standard deviation. And by 2001, math scores were back to their 1967 levels. Meanwhile, average verbal scores remain 35 percent of a standard deviation below their 1967 levels.
Can we thank Risk for the more positive trend in math, at least as compared with verbal scores? On the one hand, Risk called attention to the shortage of qualified math and science teachers, but, as Caroline Hoxby reports in this issue (see “Reforms for Whom?” on page 47), teachers were even less likely to have a degree in these subjects in 1999 than in 1982. On the other hand, Risk promoted a more rigorous academic curriculum, and the 1980s and 1990s witnessed an increase in the number of academically oriented math and science courses taken by high-school graduates (see Hoxby). Nonetheless, even SAT math scores are no higher today than they were in 1967.
If more academic courses in math had positive effects on student learning in this subject area, why didn’t the introduction of more high-school English courses after the release of A Nation at Risk have a similar effect? The answer to this question remains elusive. Perhaps, as E. D. Hirsch Jr. suggests (see “Not So Grand a Strategy” on page 68), elementary schools’ adoption of the “whole language” approach to reading instruction in lieu of phonics left many high schoolers unequipped to read challenging material. Maybe high-school teachers have given up trying to provide rigorous instruction in reading comprehension, letting students focus instead on their personal responses to the material. The syntax and range of expression in students’ textbooks may have been unduly simplified. Perhaps instruction in math, with its more structured curriculum and clearer set of standards, has remained much the same, though Williamson Evers and Paul Clopton (see “The Least Common Denominator” on page 73) suggest otherwise. Whatever the causes, the results are clear-the verbal skills of the college-bound, even more than their mathematical ones, have remained well below those of their predecessors a couple of generations ago.
National Assessment of Educational Progress
While the SAT captures only the performance of high-school seniors who are thinking of going to college, NAEP is more inclusive. It surveys samples of students representing all high-school seniors-and two younger cohorts as well. Known as the “Nation’s Report Card” and housed within the Department of Education’s National Center for Education Statistics, NAEP tests in math, science, and reading have been regularly administered to a representative sample of students at ages 9, 13, and 17 since the early 1970s.
NAEP’s limitations differ importantly from those of the SAT. Most significant is the fact that individual schools may elect not to participate in NAEP. Even when a school agrees to participate, not every student does. And participation rates have fallen noticeably since the 1970s, especially among older students. The joint school-student participation rate for 17-year-olds dropped from 68 percent in 1973 to 58 percent in 1999. At the same time, the participation rate for 13-year-olds slid from 79 percent to 74 percent. (Changes in participation rates were less pronounced for the 9-year-olds.)
In general, one expects low-performing schools to be the most likely to refuse to participate and students who are performing poorly to be the most likely to be excused from participation or absent on the day of the test. If this expectation is correct, then apparent performance gains could be due simply to declines in participation rates. The Educational Testing Service attempts to account for nonparticipation by statistically adjusting NAEP scores, but its efforts are limited by the data available, making it likely that declining rates have by themselves elevated test scores. Among 17-year-olds especially, year-to-year changes in participation rates are correlated with year-to-year fluctuations in average test-score performance, suggesting that falling rates have inflated recent NAEP scores.
Bearing this in mind, let’s examine the pattern of change in NAEP test scores among 17-year-olds, most of whom were tested in their last year of high school. Between 1973 and 1999, their NAEP math scores climbed by about 10 percent of a standard deviation (see Figure 2). During roughly the same time period, their reading scores rose by about 8 percent. However, the gains may be apparent, not real, due simply to the 10 percentage point slide in participation rates.
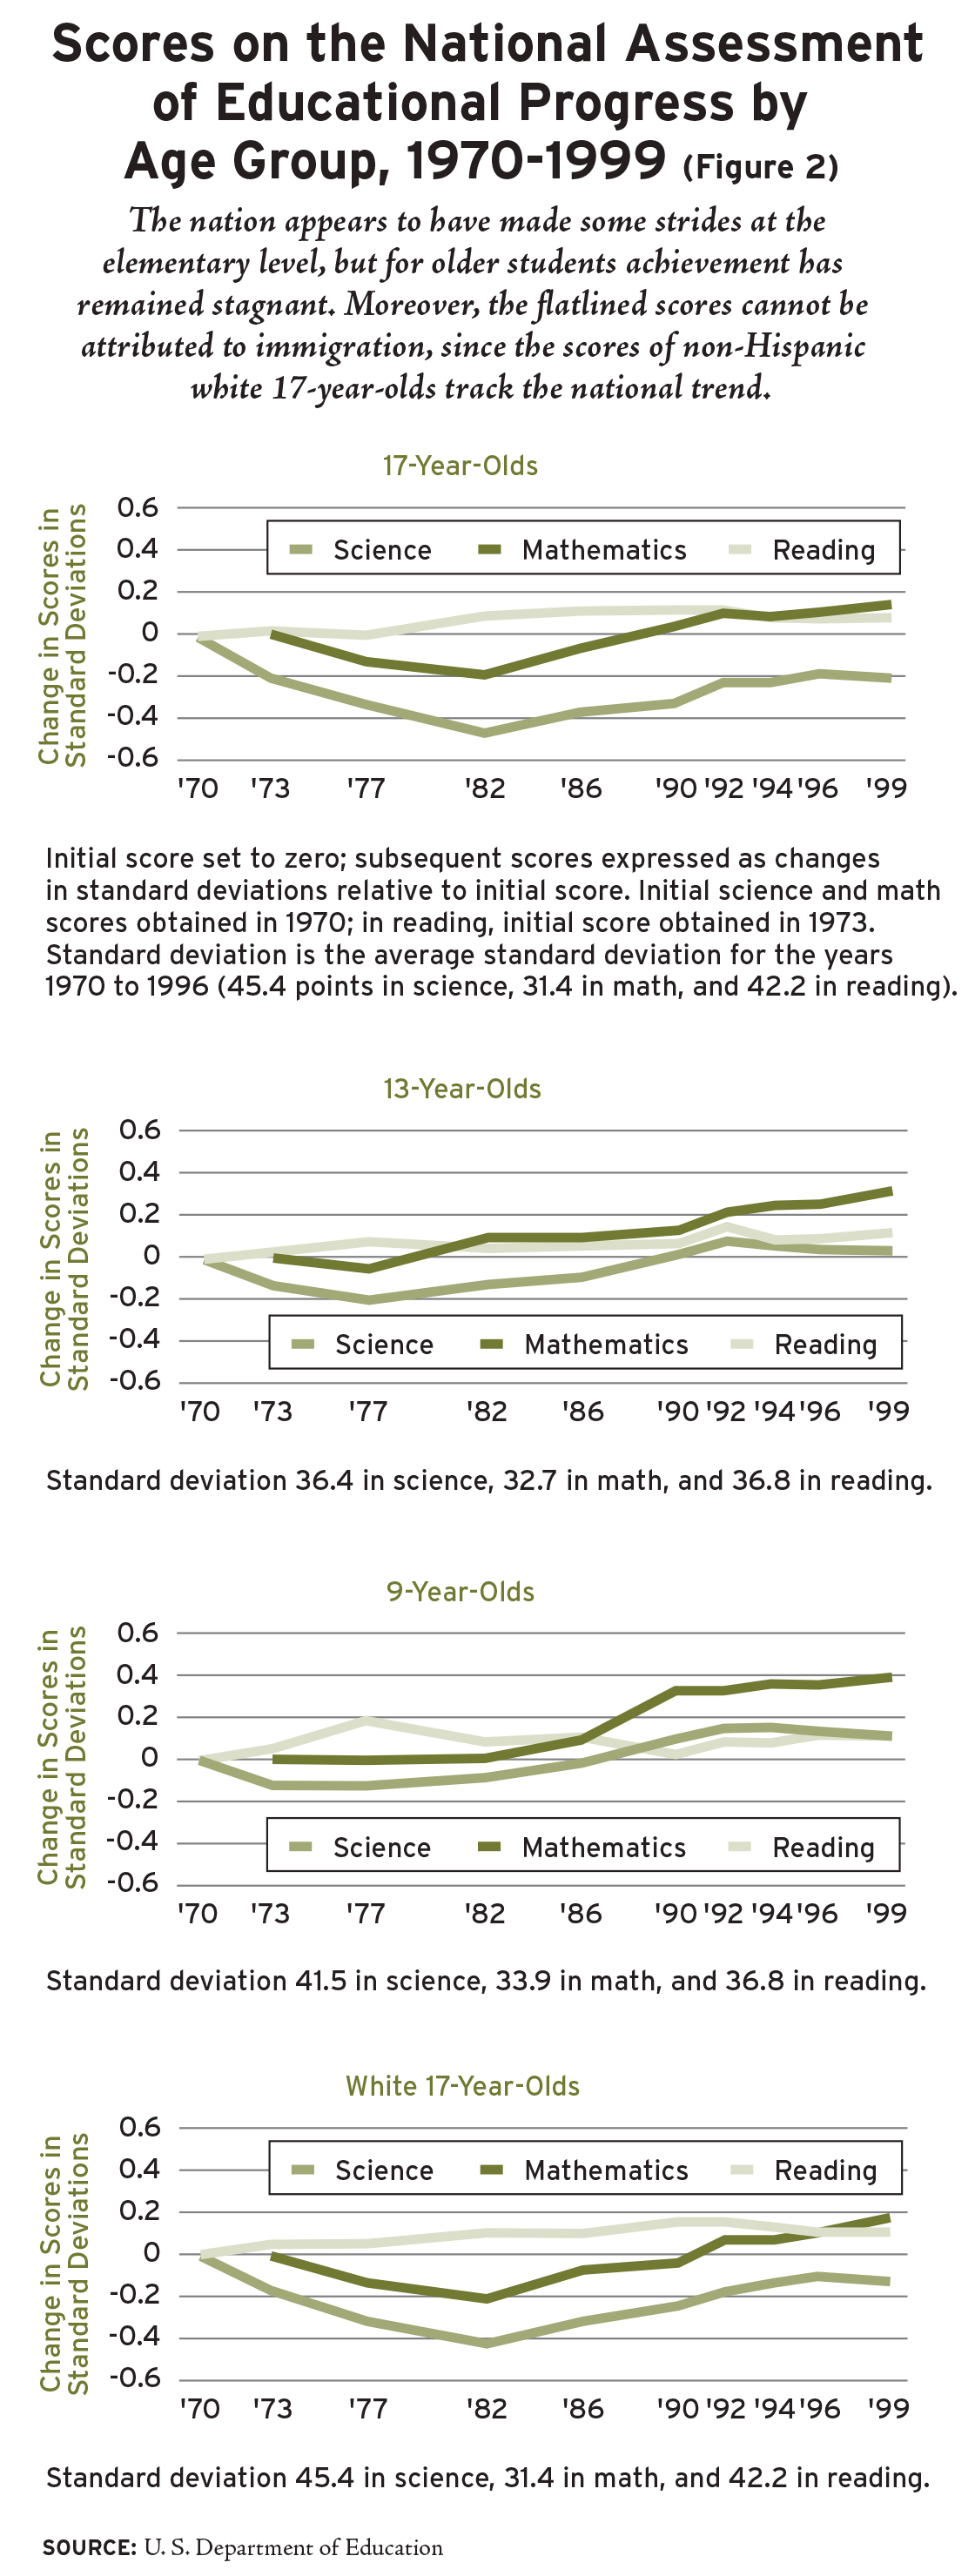
Meanwhile, the NAEP science scores of 17-year-olds dropped by 20 percent of a standard deviation. The downward shift occurred during the 1970s, when scores fell by as much as 50 percent of a standard deviation. Though they gained some ground in the past two decades, students in 1999 were still not performing as well in science as they had been in the early 1970s. Furthermore, some of the apparent recovery may have been artificial, once again the by-product of declines in participation. Taken as a whole, NAEP results for 17-year-olds, like results from the SAT, suggest that the performance of the nation’s schoolchildren has hardly moved in the course of 30 years.
The picture is only slightly brighter among 13-year-olds (see Figure 2). Their reading scores barely improved between 1970 and 1999, a gain so small it, too, may simply be due to the drop in participation. Meanwhile, science scores dropped by 20 percent of a standard deviation during the 1970s, recovered during the 1980s, and then slipped in the 1990s, ending up about where they had been in 1970. The lone bright spot is in math, where scores rose by as much as 30 percent of a standard deviation over the three decades.
Scores improved the most among 9-year-olds, the youngest cohort tested by NAEP (see Figure 2). Their math scores rose by nearly 40 percent of a standard deviation between 1973 and 1999, an encouraging sign. However, their gains in reading and science were much smaller, only 5 percent and 10 percent of a standard deviation, respectively.
Some critics have attributed the stagnation of test scores to social phenomena outside the schools’ control, especially the influx of immigrants from third world countries in the past three decades. After all, if these families have weak educational backgrounds and speak little English, their children may perform poorly on standardized tests. To explore this possibility, let’s examine the achievement trend of white 17-year-olds, a group that includes only a few immigrants, most of whom came from advanced industrialized societies where the schools are at least as good as those in the United States. Trends in NAEP performance among 17-year-old white students, as Figure 2 shows, closely track the trends for all students. Their reading scores rose slightly (10 percent of a standard deviation) before A Nation at Risk was issued, but have not increased since. Math scores declined noticeably (20 percent of a standard deviation) before the release of Risk, but have climbed back to somewhat above their 1970 level. Science scores fell sharply before 1983 and have recovered only about half their losses. Taking into account the declining participation rates, one must conclude that the performance of white 17-year-olds remained essentially flat over the past 30 years. The influx of immigrants from third world countries is not to blame for stagnation in education.
An optimist might still argue that schools have offset family deterioration or other social trends. But this ignores the dramatic improvements in family education, economic well-being, and family size mentioned earlier-as well as the fact that family effects should be most noticeable among the youngest students, the very group where stagnation is least apparent. The optimist may also interpret these results as showing that the reforms recommended by A Nation at Risk are taking hold slowly, initially influencing the education of young students, who will sustain-and perhaps accelerate-their gains as their schooling continues. But there is little basis for such comforting notions. The science scores of 9-year-olds shifted upward between 1986 and 1992, but this did not translate into gains when they reached the age of 13. Likewise, 9-year-olds made dramatic gains in math between 1986 and 1990, but the performance of 13-year-olds was far less impressive. When the same cohort became 17 in 1996, no gain could be detected. What had been achieved by age 9 had been lost altogether by age 17.
To the pessimist, these results reveal a school system in decline. Today’s students are being raised in families that are smaller and better educated than the families of students in the 1970s. Inasmuch as research has shown that family size and parents’ education are the most important family-based determinants of a child’s cognitive ability, positive changes there could in fact account for the test-score gains of 9-year-olds. But in subsequent years, schools are not making use of what young children are learning-at home or at school.
Internationally Speaking
The American education system has elicited few, if any, achievement gains in recent decades. Of course, this wouldn’t be of much concern if the United States was a world-beater in international comparisons of student performance.
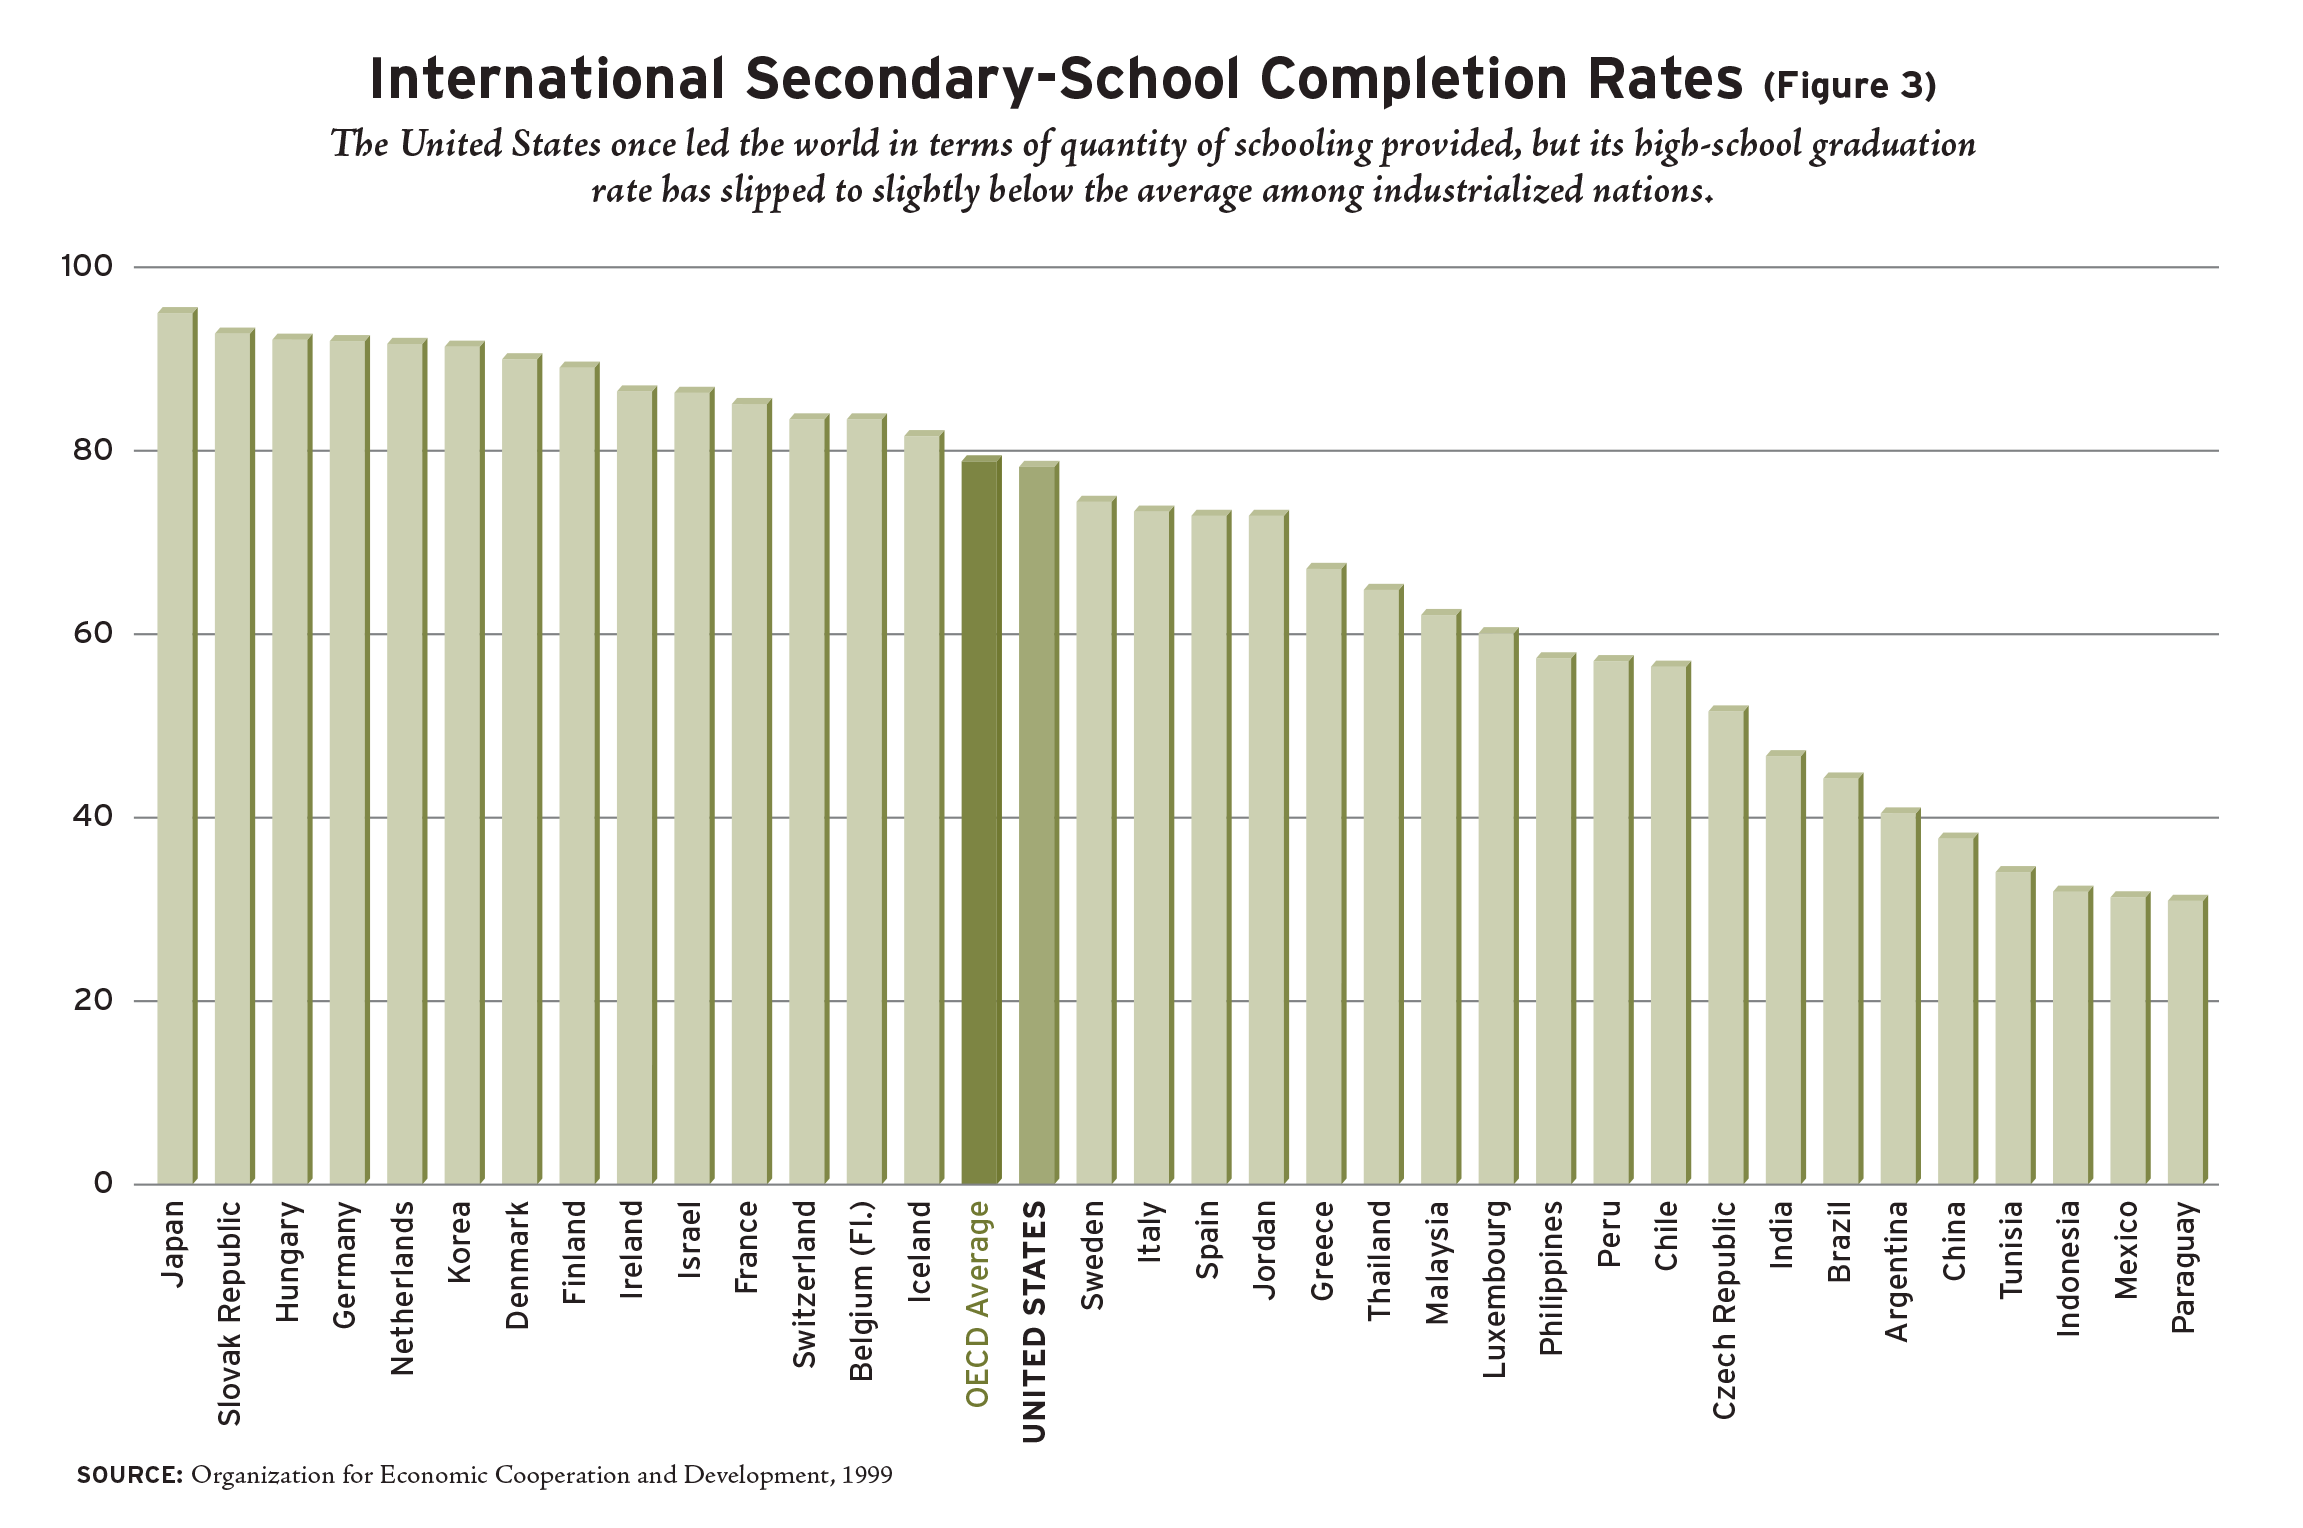
Historically, the United States has compared favorably with other nations in its education practices. It was the first country to achieve universal elementary education, the first to expand its secondary system to include the vast majority of students, and the first to establish an open, highly competitive, and world-renowned system of higher education. As late as 1970, a higher percentage of U.S. teenagers completed secondary education than did their peers in any other nation.
By the late 1990s, however, the United States no longer held the advantage in secondary-school completion rates; it had fallen to the average among the advanced industrial democracies that are members of the Organization for Economic Cooperation and Development (OECD), ranking behind Japan, Korea, Germany, France, Ireland, and other European countries (see Figure 3). Moreover, this is just a measure of the quantity of schooling provided by a nation; the United States also trails other industrialized nations in the quality of education it provides.
The International Association for the Evaluation of Education Achievement (IEA) has administered tests of math and science in countries around the world since the 1960s. The most recent of these is the TIMSS. (IEA has forgone tests of verbal skill because it thinks that language differences might invalidate international comparisons of verbal ability.) Most of the advanced industrial democracies participate in the survey, along with several developing countries.
Results from the IEA tests place the United States in the middle of the pack internationally, scoring well below the average of the highest-performing countries-Singapore, Korea, Japan, Belgium, Hong Kong, the Netherlands, and Austria. The U.S. average scores were almost exactly the same in the mid-1990s as they were in the early 1970s (see Figure 4). In other words, the IEA tests reveal the same stagnant pattern as the SAT and NAEP.
More troublesome is the fact that the U.S. standing in the world deteriorates as students advance through their education. As Eric Hanushek has shown, they score above the international average at age 9, though their average score is still 60 percent of a standard deviation below that of the highest-performing country (Korea) and 20 percent below that of the Netherlands. At age 13, however, they slip below the international average, a full standard deviation behind world-leading Singapore and 50 percent below the Netherlands. By age 17, the United States outranks only Lithuania, Cyprus, and South Africa, falling nearly a full standard deviation behind the Netherlands (Korea and Singapore did not participate in this survey). These results are consistent with those from the NAEP: progress among younger American children, but not sustained as they age. These outcomes cannot be explained away by claiming that the United States is testing, at age 17, a broader swath of students than other nations are. As we have seen, the United States is no longer the world leader in secondary education.
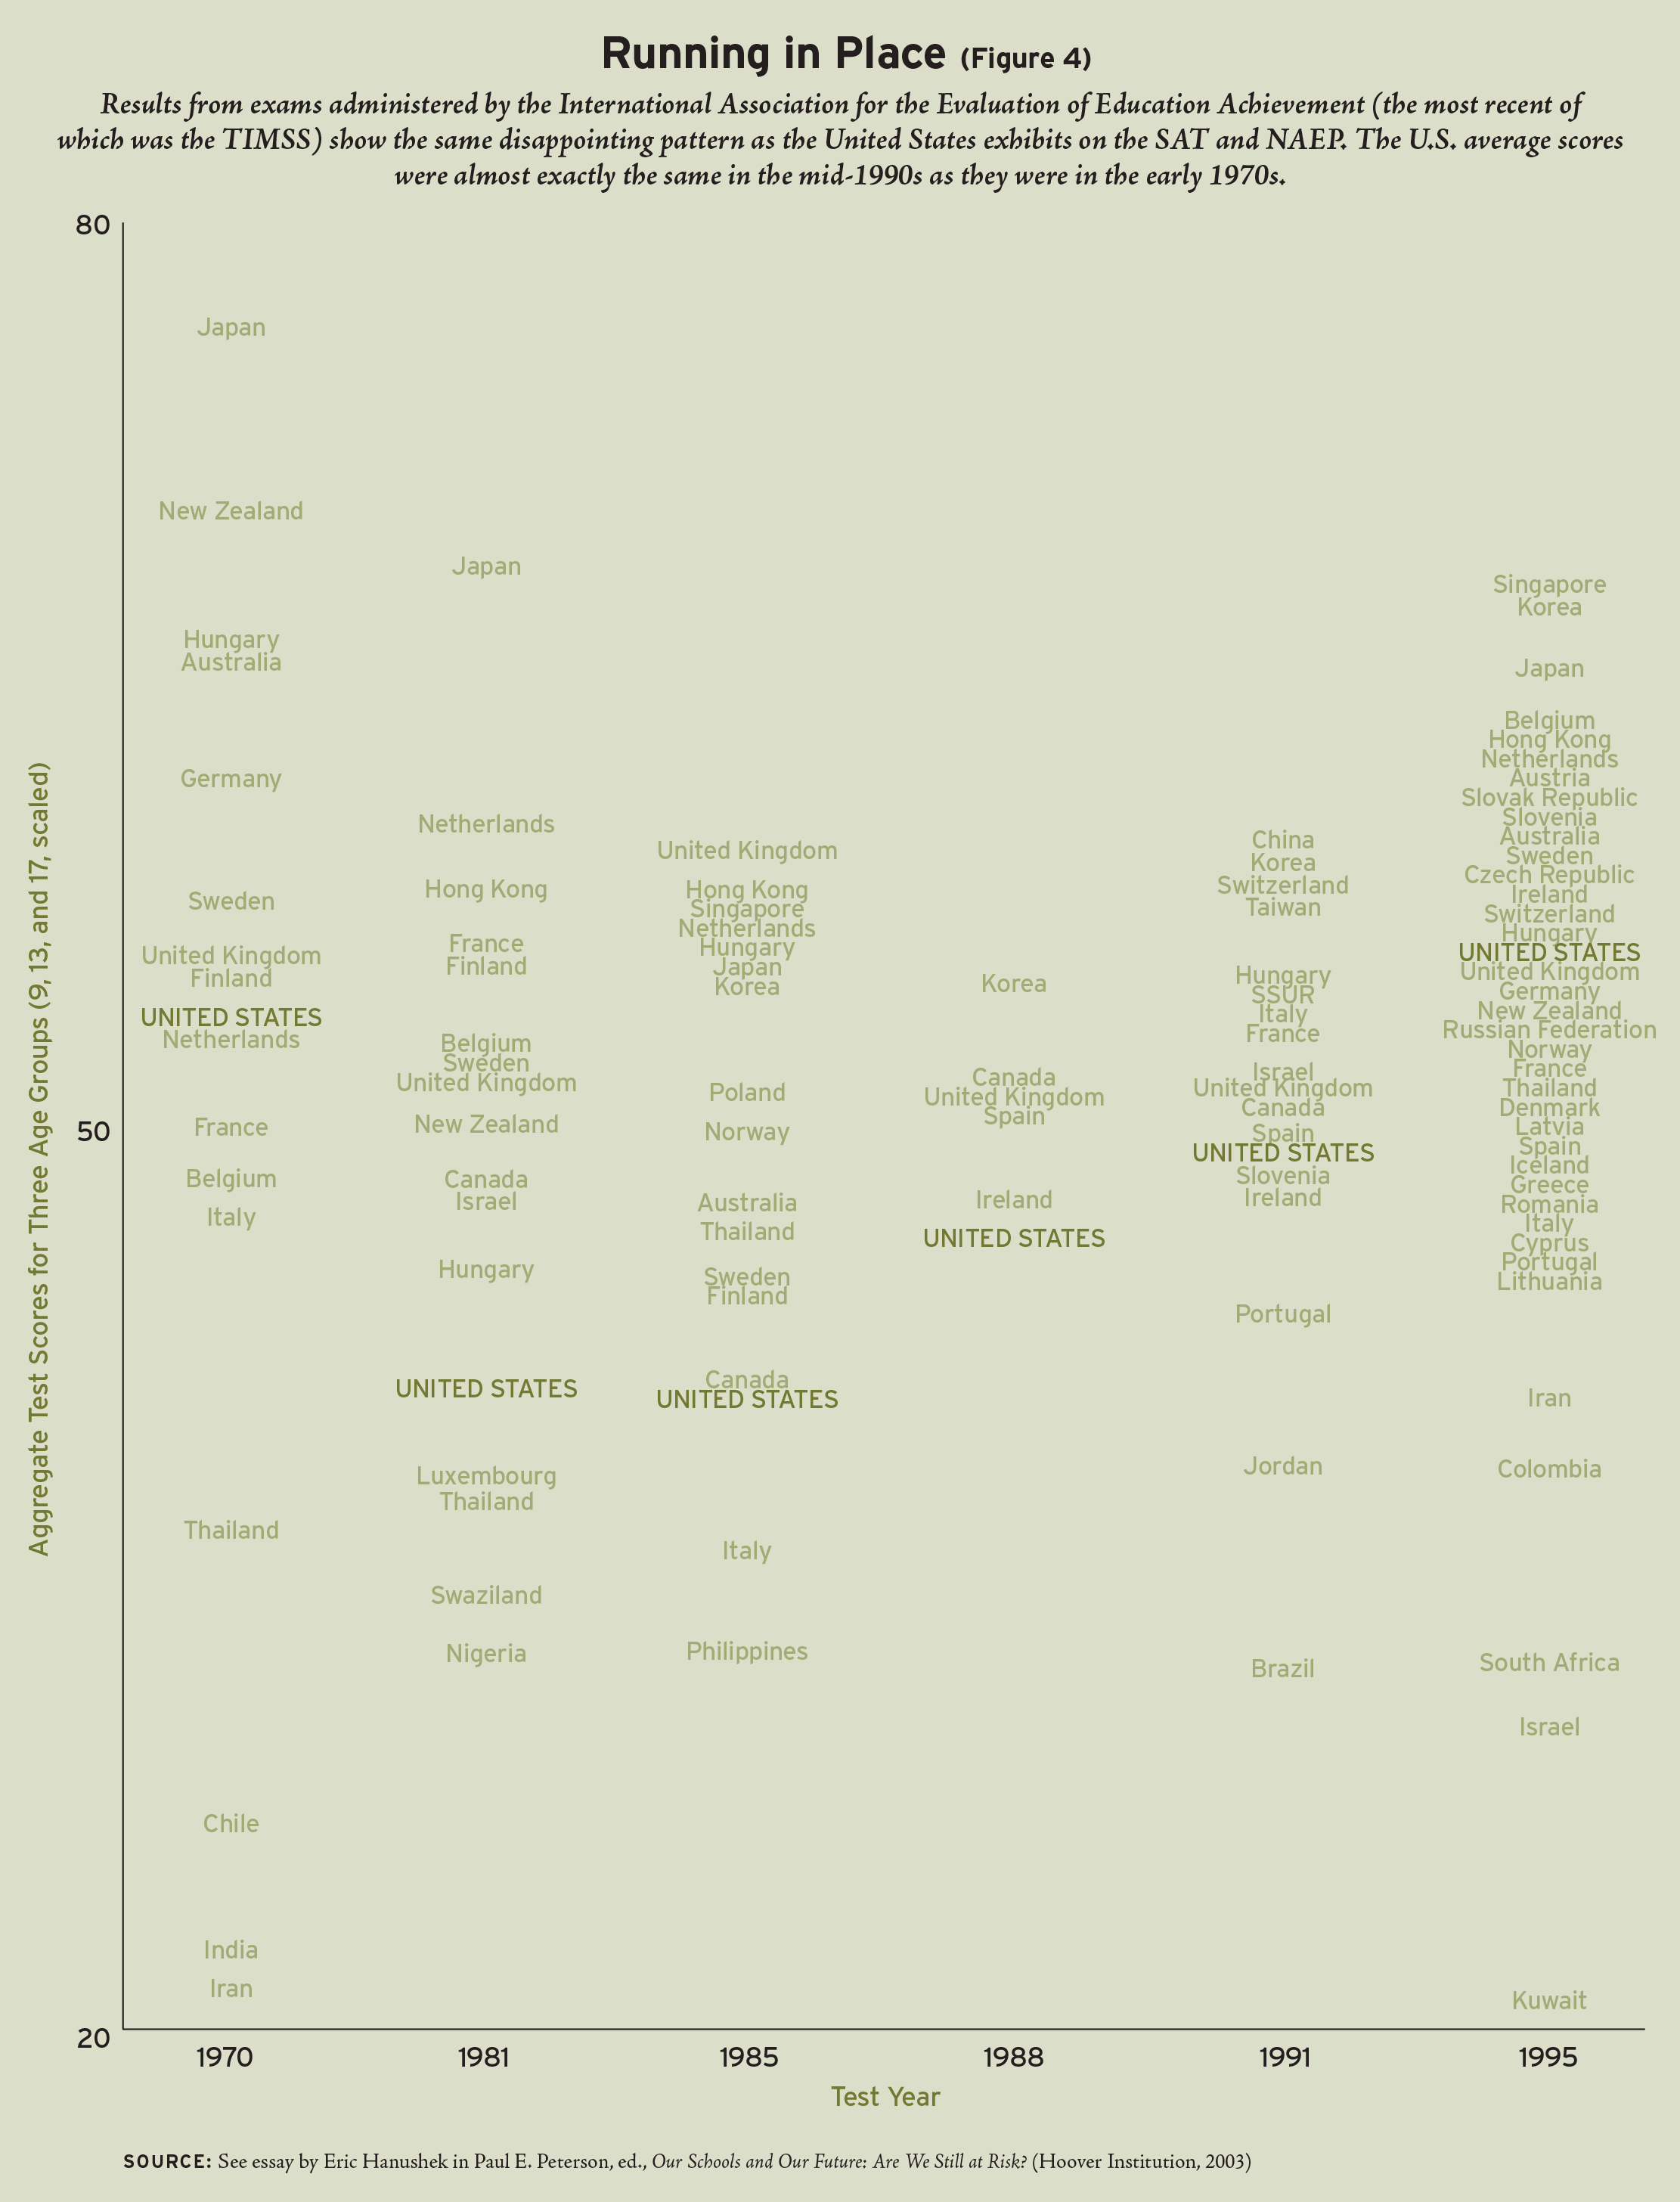
Source: See essay by Eric Hanushek in Paul E. Peterson, ed., Our Schools and Our Future: Are We Still at Risk? (Hoover Institution, 2003)
Making matters worse is the fact that the IEA tests students in math and science, areas where U.S. students have made some gains in the past two decades. Meanwhile, according to the data from the SAT, American 17-year-olds have never really recovered from their precipitous drop in verbal scores 30 years ago. Until recently, no international testing student survey had been conducted in reading. But in 2000, the OECD conducted its own international survey of what it refers to as reading, math, and science literacy. It surveyed 15-year-olds in 31 countries, almost all of them advanced industrial democracies.
Overall, the findings from the OECD and IEA surveys are very similar: the average combined score of U.S. students in all three subjects falls at about the international average, trailing students in the highest-performing countries, Japan, Korea, and Finland, by more than 40 percent of a standard deviation (see Figure 5).
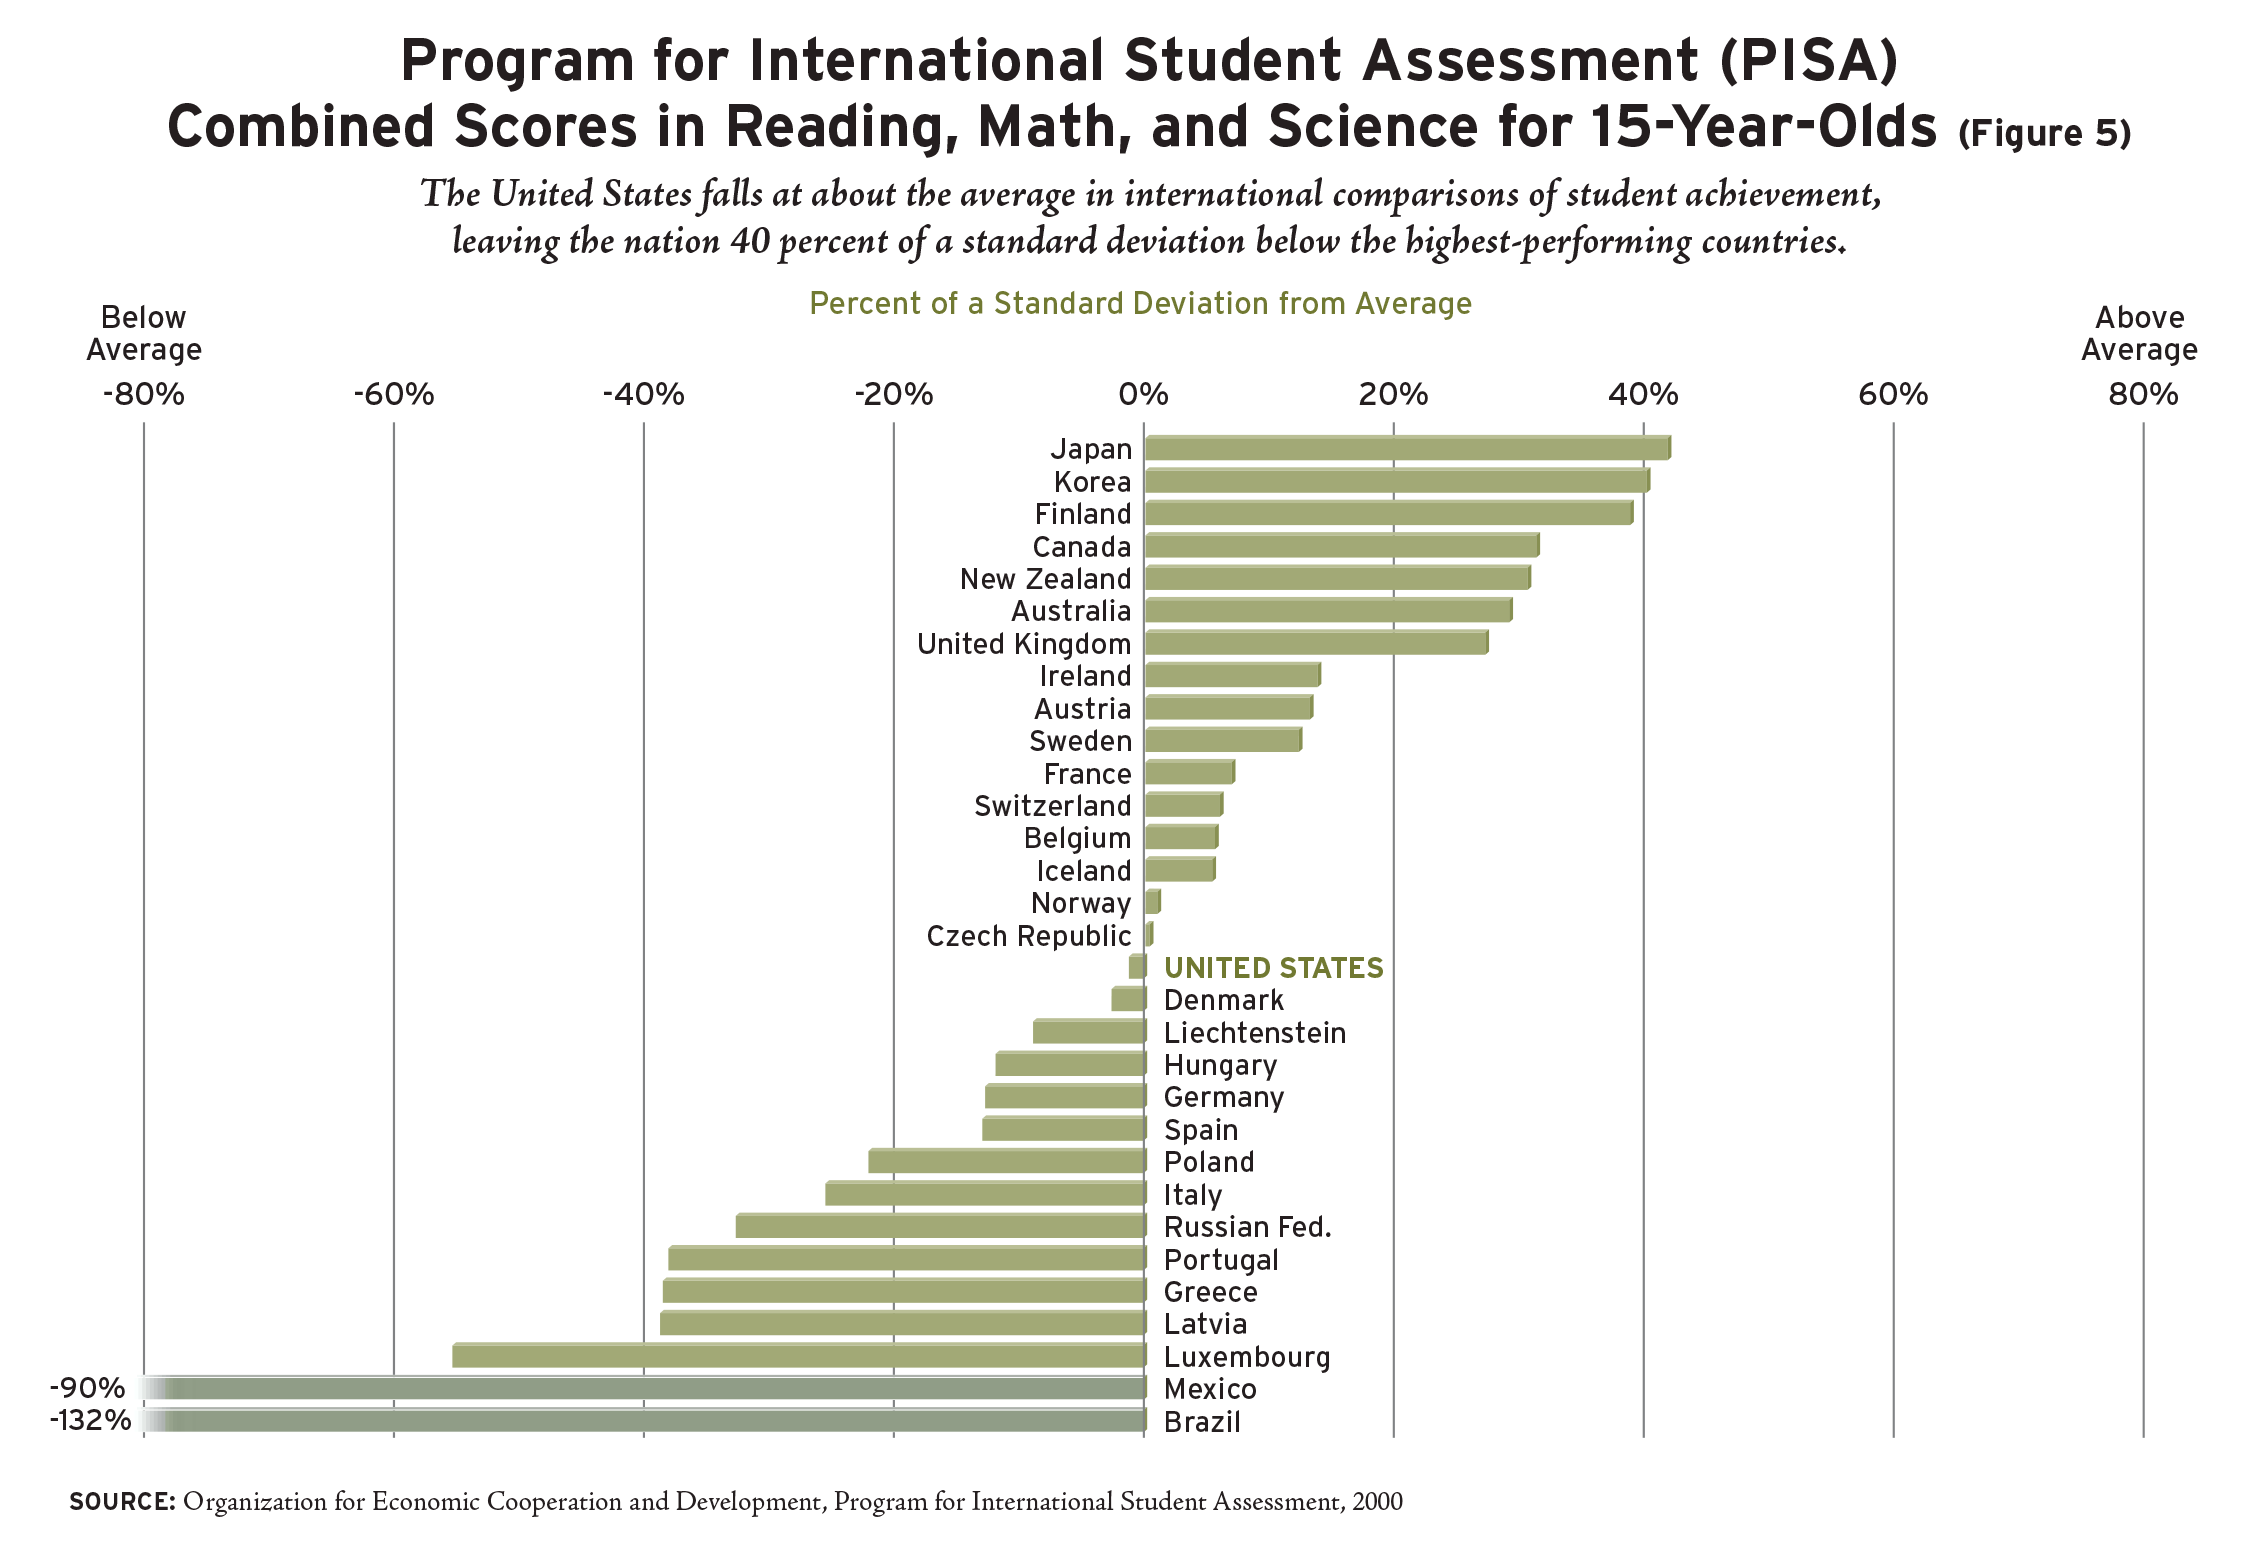
In reading, the United States ranks 15th among the 31 participating countries, 45 percent of a standard deviation behind Finland, the world leader. One might attribute this to the fact that English is a difficult language to learn-except that the United States was the lowest scoring of all the English-speaking countries. Canada, New Zealand, Australia, the United Kingdom, and Ireland all ranked higher. So did Korea, Japan, Sweden, Austria, Belgium, Norway, and France. The results in math and science were equally dismal.
Still another international comparison, this provided by the International Adult Literacy Survey, provides a different way of assessing the quality of education in the United States. It was administered during the mid-1990s to a cross-section of 16- to 65-year-olds in 14 European and North American countries.
The United States ranked 12th on the test, trailing Sweden, Norway, Denmark, Finland, the Netherlands, and Germany by significant margins. The news gets even worse: the United States appears to be living on its past. The literacy skills of Americans aged 56 to 65 ranked them second in the world. These highfliers had attended school in the 1950s, at a time when SAT scores reached heights to which they have never since returned-and Europeans were still trying to put together an education system that could serve more than an elite cadre.
Americans who went to school during the 1960s ranked a respectable 3rd; those schooled in the 1970s ranked 5th. But 16- to 25-year-olds, adults who were wandering America’s school hallways during the 1980s and 1990s, ranked 14th. In short, the literacy survey records a simple, steady progression downward. Apologists will find excuses for these outcomes, of course. The downward U. S. trajectory is due more to gains elsewhere than to slippage within the United States, some will say, as if this were satisfying. Others may say that U.S. scores are pulled down by its immigrants and ethnic diversity, overlooking the fact that other countries have immigrants too. Lifelong learning opportunities are greater in the United States than elsewhere, it will be claimed, so young folks will eventually reach the levels the oldest group has achieved. No matter that schools are bad; catch-up time will come later on.
But such excuses don’t ring true, especially when the literacy test only confirms results from the IEA, the OECD survey, NAEP, and the SAT. No one test can provide the definitive assessment of American education. But when multiple studies yield similar results, the story they tell becomes ever more compelling. By all accounting devices available, the nation at risk 20 years ago has not responded adequately to the challenge set forth in 1983.
Paul E. Peterson is a professor of government at Harvard University, a senior fellow at the Hoover Institution, and editor-in-chief of Education Next.
This article appeared in the Spring 2003 issue of Education Next. Suggested citation format:
Peterson, P.E. (2003). Ticket to Nowhere: In the wake of A Nation at Risk, educators pledged to focus anew on student achievement. Two decades later, little progress has been made. Education Next, 3(2), 39-46.