
Our goal with this post is to convince you that continuing to use status measures like proficiency rates to grade schools is misleading and irresponsible—so much so that the results from growth measures ought to count much more—three, five, maybe even nine times more—than proficiency when determining school performance under the Every Student Succeeds Act (ESSA). We draw upon our experience with our home state of Ohio and its current accountability system, which currently generates separate school grades for proficiency and for growth.
We argue three points:
1. In an era of high standards and tough tests, proficiency rates are correlated with student demographics and prior achievement. If schools are judged predominantly on these rates, almost every high-poverty school will be labeled a failure. That is not only inaccurate and unfair, but it will also demoralize educators and/or hurt the credibility of school accountability systems. In turn, states will be pressured to lower their proficiency standards.
2. Growth measures—like “value added” or “student growth percentiles”—are a much fairer way to evaluate schools, since they can control for prior achievement and can ascertain progress over the course of the school year. They can also differentiate between high-poverty schools where kids are making steady progress and those where they are not.
3. In contrast with conventional wisdom, growth models don’t let too many poor-performing schools “off the hook.” Failure rates for high-poverty schools are still high when judged by “value added” or “student growth percentiles”—they just aren’t as ridiculously high as with proficiency rates.
Finally, we tackle a fourth point, addressing the most compelling argument against growth measures:
4. That schools can score well on growth measures even if their low-income students and/or students of color don’t close gaps in achievement and college-and-career readiness.
(And these arguments are on top of one of the best reasons to support growth models: Because they encourage schools to pay attention to all students, including their high achievers.)
Point #1: Proficiency rates are poor measures of school quality.
States should use proficiency rates cautiously because of their correlation with student demographics and prior achievement—factors that are outside of schools’ control. Let’s illustrate what this looks like in the Buckeye State. One of Ohio’s primary school-quality indicators is its performance index (PI)—essentially, a weighted proficiency measure that awards more credit when students achieve at higher levels. Decades of research have shown the existence of a link between student proficiency and student demographics, and that unfortunate relationship persists today. Chart 1 displays the correlation between PI scores and a school’s proportion of economically disadvantaged (ED) pupils. Schools with more ED students tend to post lower PI scores—and vice-versa.
Chart 1: Relationship between performance index scores and percent economically disadvantaged, Ohio schools, 2015–16
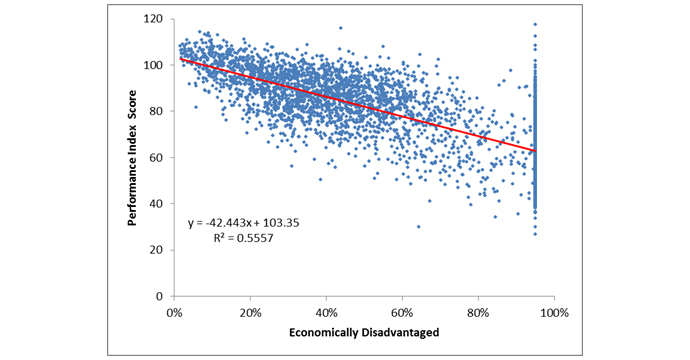
Data source: Ohio Department of Education Notes: Each point represents a school’s performance index score and its percentage of economically disadvantaged students. The red line displays the linear relationship between the variables. Several high-poverty districts in Ohio participate in the Community Eligibility Provision program; in turn, all of their students are reported as economically disadvantaged. As a result, some less impoverished schools (in high-poverty districts) are reported as enrolling all ED students, explaining some of the high PI scores in the top right portion of the chart.
Given this strong correlation, it’s not surprising that almost all high-poverty urban schools in Ohio get failing grades on the performance index. In 2015–16, a staggering 93 percent of public schools in Ohio’s eight major cities received a D or F on this measure, including several well-regarded schools (more on those below). Adding to their misery, urban schools received even worse ratings on a couple of Ohio’s other proficiency-based measures, such as its indicators met and annual measureable objectives components. Parents and students should absolutely know whether they are proficient in key subjects—and on track for future success. But that’s a different question from whether their schools should be judged by this standard.
Point #2: Growth measures are truer indicators of school quality.
Because they account for prior achievement, ratings based on student growth are largely independent of demographics. This helps us make better distinctions in the performance of high-poverty schools. Like several other states, Ohio uses a value-added measure developed by the analytics firm SAS. (Other states utilize a similar type of measure called “student growth percentiles.”) When we look at the value-added ratings from Ohio’s urban schools, we see differentiation in performance. Chart 2 below shows a fairer balance across the A-F categories on this measure: 22 percent received an A or B rating; 15 percent received C’s; and 63 percent were assigned a D or F rating.*
Chart 2: Rating distribution of Ohio’s urban schools, performance index versus “value added,” 2015–16
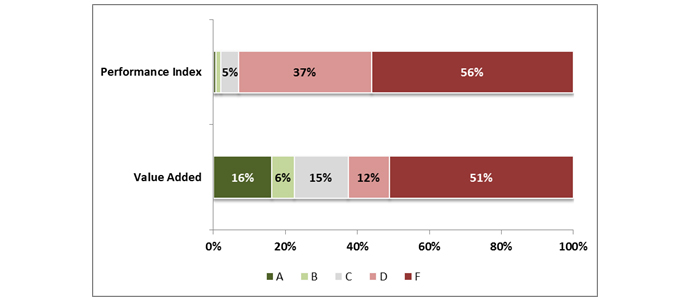
*Due to transitions in state tests, Ohio rated schools on just one year of value-added results in 2014–15 and 2015–16 leading to some swings in ratings. In previous years and starting again in 2016–17, the state will use a multi-year average which helps to improve the stability of these ratings.
We suppose one could argue that the performance-index distribution more accurately depicts what is going on in Ohio’s urban schools: Nearly every school, whether district or charter, is failing. Yet we know from experience that this simply isn’t true. Yes, terrible schools exist, but there are also terrific ones whose efforts are best reflected in student growth. In fact, we proudly serve as the charter authorizer for KIPP Columbus and Columbus Collegiate Academy-Main. Both schools have earned an impressive three straight years of value-added ratings of “A,” indicating sustained excellence that is making a big impact in their students’ lives. Yet both of these high-poverty charter schools were assigned Ds on the performance index for 2015–16. That is to say, their students are making impressive gains—catching up, even—but not yet at “grade level” in terms of meeting academic standards. If we as an authorizer relied solely or primarily on PI ratings, these great schools might be shut—wrongly.
Point #3: Growth measures don’t let too many bad schools “off the hook.”
One worry about a growth-centered approach is that it might award honors grades to mediocre or dismal schools. But how often does this occur in the real world? As chart 2 indicates, 63 percent of urban public schools in Ohio received Ds or Fs on the state’s value-added measure last year. In the two previous years, 46 and 39 percent of urban schools were rated D or F. To be sure, fewer high-poverty schools will flunk under value-added as under a proficiency measure. But a well-designed growth-centered system will identify a considerable number of chronically underperforming schools, as indeed it should.
Point #4: It’s true that schools can score well on growth measures even if their low-income students and/or students of color don’t close gaps in achievement and college-and-career readiness. But let’s not shoot the messenger.
Probably the strongest argument against using growth models as the centerpiece of accountability systems is that they don’t expect “enough” growth, especially for poor kids and kids of color. The Education Trust, for example, is urging states to use caution in choosing “comparative” growth models, including growth percentiles and value-added measures, because they don’t tell us whether students are making enough progress to hit the college-ready target by the end of high school, or whether low-performing subgroups are making fast enough gains to close achievement gaps. And that much is true. But let’s keep this in mind: Closing the achievement gap, or readying disadvantaged students for college, is not a one-year “fix.” It takes steady progress—and gains accumulated over time—for lower-achieving students to draw even with their peers. An analysis of Colorado’s highest-performing schools, for example, found that the trajectory of learning gains for the lowest-performing students simply wasn’t fast enough to reach the high standard of college readiness. An article by Harvard’s Tom Kane reports that the wildly successful Boston charter schools cut the black-white achievement gap by roughly one-fifth each year in reading and one-third in math. So even in the most extraordinary academic environments, disadvantaged students may need many years to draw even with their peers (and perhaps longer to meet a high college-ready bar). That is sobering indeed.
We should certainly encourage innovation in growth modelling—and state accountability—that can generate more transparent results on “how much” growth is happening in a school and whether such growth is “enough.” But the first step is accepting that student growth is the right yardstick, not status measures. And the second step is to be realistic about how much growth on an annual basis is humanly possible, even in the very best schools.
* * *
Using proficiency rates to rate high-poverty schools is an unfair practice to schools that has real-world consequences. Not only does this policy give the false impression that practically all high-poverty schools are ineffective, but it also demeans educators in high-needs schools who are working hard to advance student learning. Plus, it actually weakens the accountability spotlight on the truly bad high-poverty schools, since they cannot be distinguished from the strong ones. Moreover, it can lead to unintended consequences such as shutting schools that are actually benefitting students (as measured by growth), discouraging new-school startups in needy communities (if social entrepreneurs believe that “failure” is inevitable), or thwarting the replication of high-performing urban schools. Lastly, assigning universally low ratings to virtually all high-poverty schools could breed resentment and pushback, pressuring policy makers to water down proficiency standards or easing up on accountability as a whole.
Growth measures won’t magically ensure that all students reach college and career readiness by the end of high school, or close our yawning achievement gaps. But they do offer a clearer picture of which schools are making a difference in their students’ academic lives, allowing policy makers and families to better distinguish the school lemons from peaches. If this information is put to use, students should have more opportunities to reach their lofty goals. Measures of school quality should be challenging, yes, but also fair and credible. Growth percentiles and value-added measures meet those standards. Proficiency rates simply do not. And states should keep that in mind when deciding how much weight to give to these various indicators when determining school grades.
—Michael Petrilli and Aaron Churchill
Mike Petrilli is president of the Thomas B. Fordham Institute, research fellow at Stanford University’s Hoover Institution, and executive editor of Education Next. Aaron Churchill is an Ohio Research & Data Analyst for the Thomas B. Fordham Institute.
This post originally appeared on Flypaper.