 Recent policies intended to improve teacher quality have focused on the preparation that teachers receive before entering the classroom. A short-lived federal rule would have required every state to assess and rank teacher-preparation programs by their graduates’ impact on student learning. Though the federal rule was repealed, last year some 21 states and the District of Columbia opted to rank teacher-preparation programs by measures of their graduates’ effectiveness in the classroom, such as their value-added scores.
But what does the research say? Do teachers from different preparation programs differ substantially in their impacts? Can outcomes like student test performance reliably identify more or less effective teacher-preparation programs?
To address these questions, we re-analyzed prior evaluations of teacher-preparation programs from six locations: Florida, Louisiana, Missouri, Texas, Washington State, and New York City. We found negligible differences in teacher quality between programs, amounting to no more than 3 percent of the average test-score gap between students from low-income families and their more affluent peers. Differences between programs were negligible even in Louisiana and New York City, where earlier evaluations had reported substantial differences and fueled the push for program accountability.
Most differences between programs would be too small to matter, even if we could measure them accurately. And we can rarely measure them accurately. The errors we make in estimating program differences are often larger than the differences we are trying to estimate. With rare exceptions, we cannot use student test scores to say whether a given program’s teachers are significantly better or worse than average. If policymakers want to hold preparation programs accountable for the quality of their graduates, there may be better ways to do it.
A Push for Accountability
Four days before the 2016 election, the U.S. Department of Education (DOE) issued a regulation requiring every state to publish an annual “report card” on the quality of its teacher-preparation programs. Report cards would rate programs by their outcomes, such as graduates’ impacts on student performance on standardized tests, rather than program characteristics like curriculum and faculty credentials. Programs would be assigned one of four performance categories: low-performing, at-risk of being low-performing, effective, or exemplary. The report cards would be published on the Web. Like college ratings, they would provide feedback to preparation programs, help prospective teachers choose among programs, and help schools and districts evaluate job applicants from different programs. Programs persistently rated as low-performing would lose eligibility for federal TEACH grants, which provide $4,000 per year to students who train and then teach in a high-need subject or a high-poverty school.
The regulation was part of a larger plan to improve teacher recruitment and preparation nationwide, inspired by widespread concerns about the quality of teacher-training programs (see “21st-Century Teacher Education,” features, Summer 2013). Released in 2011, the plan won early support from some program providers, unions, and advocates. But when the specifics of the regulations were published in draft form in October 2016, they were criticized by congressional Republicans and union leaders as an example of burdensome federal overreach. President Randi Weingarten of the American Federation of Teachers said the regulation was fundamentally misguided. “It is, quite simply, ludicrous,” she said, “to propose evaluating teacher preparation programs based on the performance [test scores] of the students taught by a program’s graduates.”
The regulation was never implemented. In early 2017, after Republicans regained the White House, the rule was repealed by Congress. At a public signing ceremony, President Trump declared the repeal had removed “an additional layer of bureacracy to encourage freedom in our schools.”
However, report cards on teacher-preparation programs remain a live policy at the state level. In Louisiana, the practice dates back more than a decade; evaluators began to collect data in 2003–04 and first published a report card that named individual programs in 2008. In 2010, 11 states and the District of Columbia received funding to develop program report cards as part of their federal Race to the Top grants. By 2017, according to the National Council on Teacher Quality, 21 states and the District of Columbia were “collect[ing] and publicly report[ing] data that connect teachers’ student growth data to their preparation programs.”
Looking for a Research Base
On what did states and DOE base their decision to require report cards? Research comparing teacher-preparation programs has produced inconsistent results. Some research, from Louisiana and New York, claimed that differences between teacher-preparation programs were substantial. Other research, from Missouri and Texas, claimed that the differences between teacher-preparation programs were minuscule, and that it was rarely possible to tell which programs were better or worse.
In its 129-page regulation, DOE spent less than a sentence acknowledging—and dismissing—inconsistencies in the research. “While we acknowledge that some studies of teacher preparation programs find very small differences at the program level … we believe that the examples we have cited above provide a reasonable basis for States’ use of student learning outcomes” to evaluate teacher-preparation programs. It is unclear why officials at DOE dismissed research that didn’t support the idea of program rankings. It is also unclear why officials felt a need to issue a national regulation requiring all 50 states to rate teacher-preparation programs when research had not reached a consensus that rankings would be practical or useful.
In fact, in the public debate over the federal regulation, research carried no weight at all. Research had been published in academic journals and summarized in more popular outlets like Kappan and the Washington Post. Yet teachers’ unions did not cite research, and neither did members of Congress. Research went unmentioned in a 2015 Government Accountability Office report on teacher-training programs. When the DOE regulation listed 11 stakeholder groups that state governments must consult when specifying the data and analysis that would go into program report cards, neither researchers nor evaluators made the list.
Ranking Programs by Value-Added
Programs evaluated in a state report card may be “traditional” programs, in which a college student majors in education and completes student teaching to earn a degree and a teaching certificate. Or they may be “alternative” certification programs, which provide coursework and training to certify adults who already hold a bachelor’s degree in other subjects. Alternative programs are often run by school districts or nonprofits like Teach For America or The New Teacher Project, but the fastest-growing programs are run by for-profit corporations like Kaplan University or Teachers of Tomorrow.
A program that produces exceptional teachers may do so for different reasons. The program might provide excellent training that gives teachers the knowledge and skills they need to succeed in the classroom. Or the program could be very selective about the applicants that it accepts. State report cards don’t measure whether the teachers coming out of a program are good because of training or selectivity. As long as the program is putting effective teachers in the classroom, the report card will give it a positive review.
At least, that is what is supposed to happen. In principle, comparing the effectiveness of teachers from different programs sounds pretty simple. But in practice, there is a lot that can go wrong.
Let’s start with the simple part. Teachers are commonly evaluated by measuring their “value-added” to student scores on standardized tests. Value-added models begin by asking what students would be expected to score given their previous scores, poverty levels, and other characteristics. If students score above expectations, their teacher gets credit for the excess and her value-added is positive. If students score below expectations, the teacher gets credit for the shortfall and her value-added is negative.
To rank teacher-preparation programs, report cards average the value-added of teachers who have graduated from each program in the past few years. This approach to evaluating programs isn’t perfect, but it stands up to some common knocks. In criticizing the federal regulation, for example, Weingarten claimed that “the flawed framework . . . will punish teacher-prep programs whose graduates go on to teach in our highest-needs schools, most often those with high concentrations of students who live in poverty and English language learners.” But value-added models commonly adjust for poverty and English proficiency. And the federal regulation gave extra credit to programs that placed teachers in high-need schools.
The problem with ranking programs on value-added is not that the rankings are biased; the problem is that the rankings are almost random. Once random noise is sifted out of the rankings, the true differences between programs are usually too small to matter.
The Role of Randomness
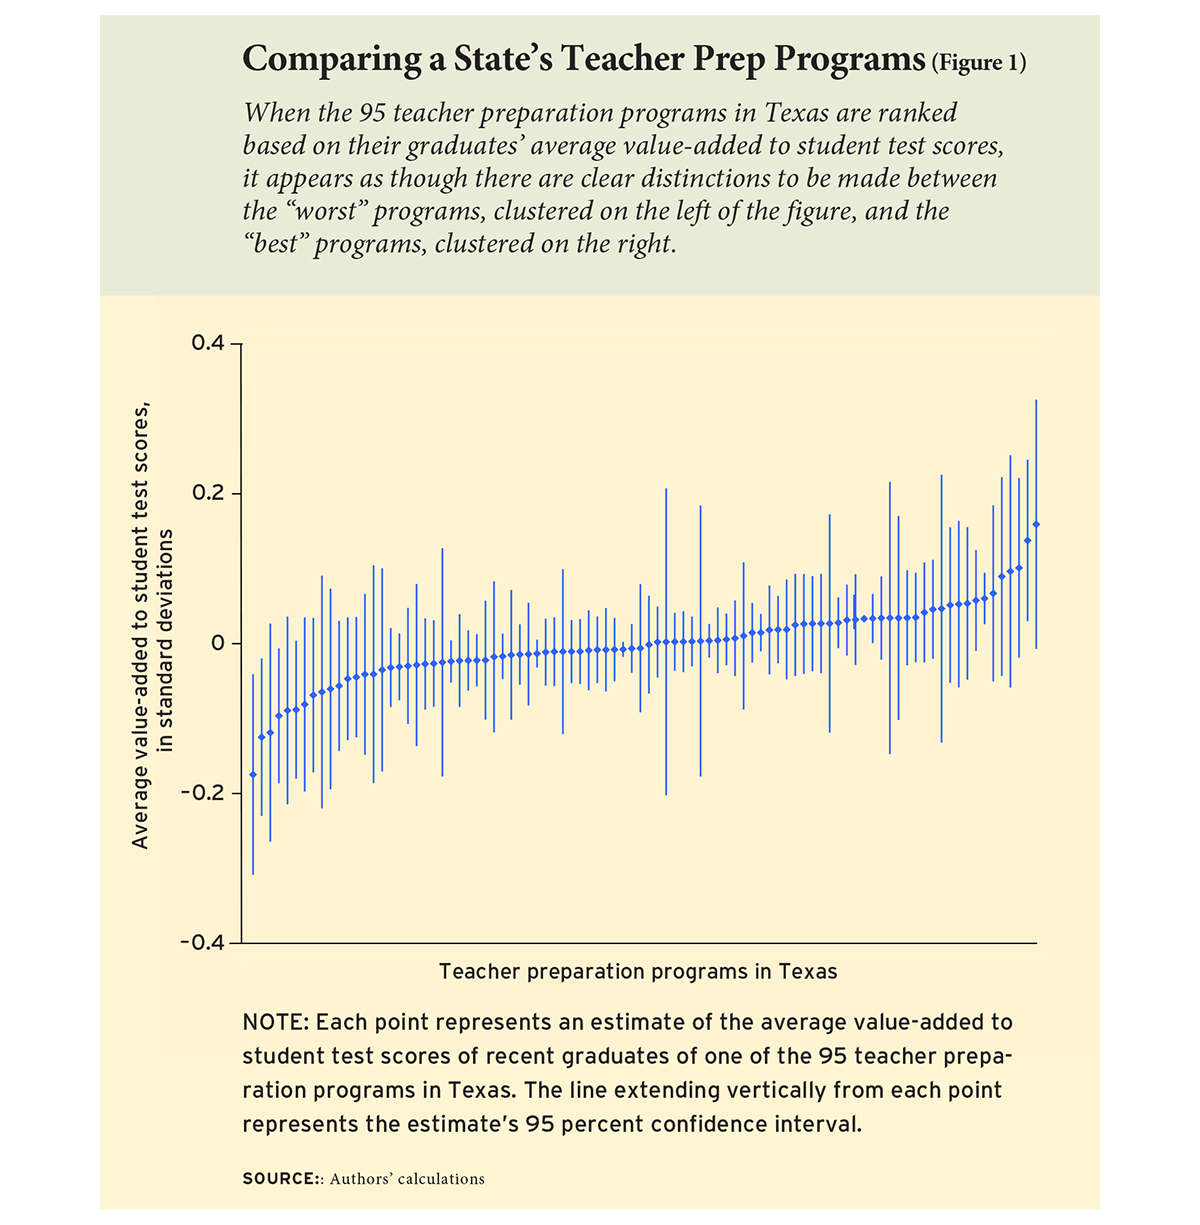
We first looked at these issues in a 2016 study of 95 teacher-preparation programs in Texas. We ranked each program by estimating its teachers’ average value-added to math scores. The graph of rankings is seductive (see Figure 1). Once you see the graph, it’s hard not to think that the “best” programs—the ones that turn out the best teachers—are on the right, and the “worst” programs are on the left. You could even slice the graph into groups of programs that look as if they have similar quality, such as “effective” programs, “low-performing” programs, and “at risk” programs. That’s what the federal regulation would have required.
In fact, though, these programs are less different than they look. The differences that look so compelling in the graph are mostly random. There’s random error in student test scores; there’s random variation in the particular group of teachers who complete a program in a given year; there’s random variation in where those teachers end up working; and there’s random variation in how responsive their students are. These random factors vary from year to year, for reasons beyond a program’s control. So where a program falls in a given year’s rankings, and whether it moves up or down from one year to the next, is typically more a matter of luck than of quality.
It’s hard for almost everyone, even trained researchers, to appreciate how much the apparent differences between programs are due to random estimation error. We are often “fooled by randomness”—when we see a random pattern, we think it means more than it does.
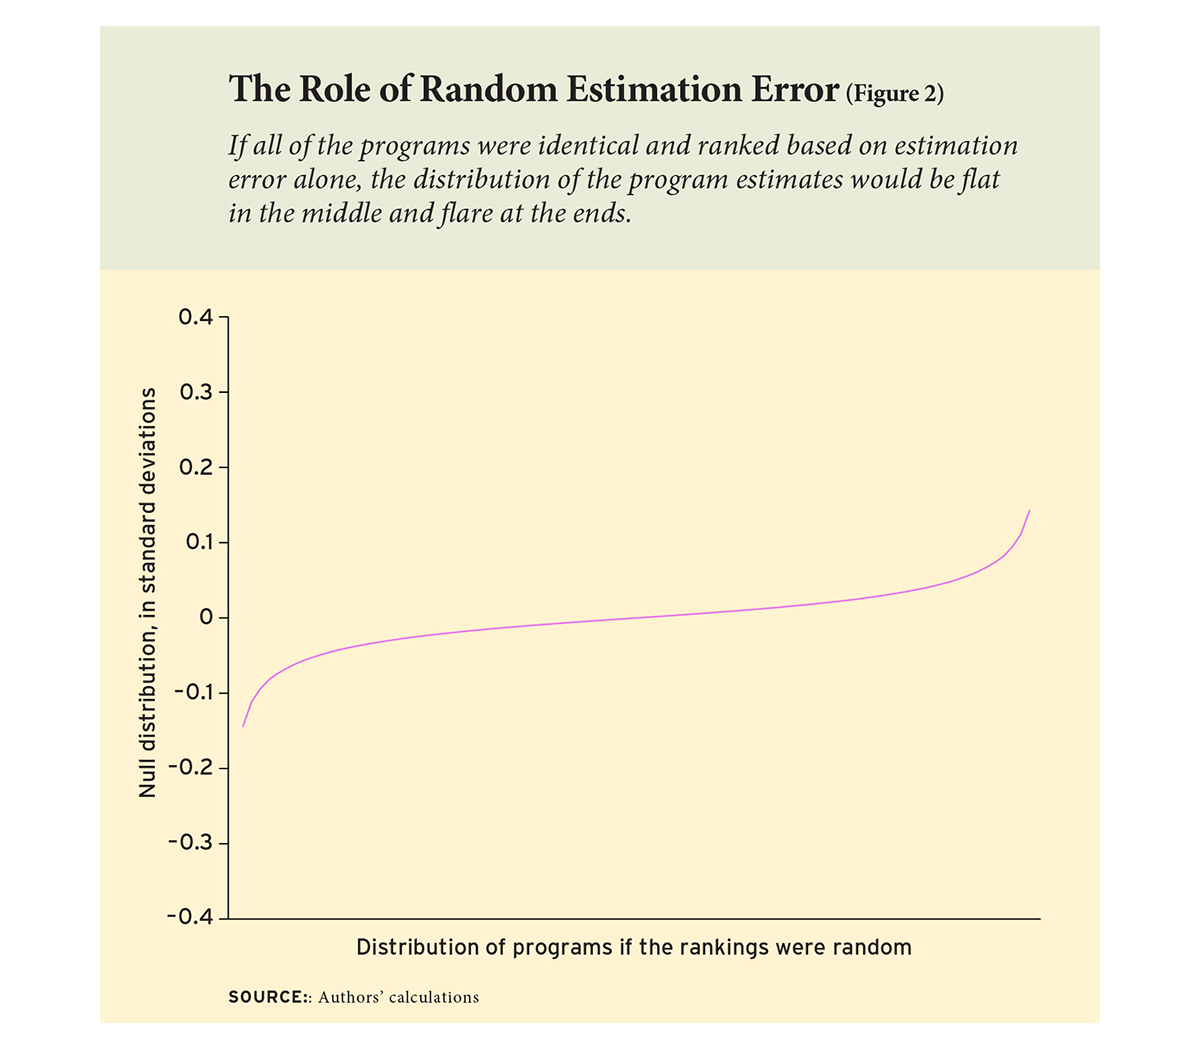
To highlight the role of random error, we calculated the “null distribution,” or what the distribution of program rankings would look like if all the programs were actually identical and nothing but random estimation error were present. The null distribution looks an awful lot like our actual results: it is almost flat in the middle and flares at the ends (see Figure 2).
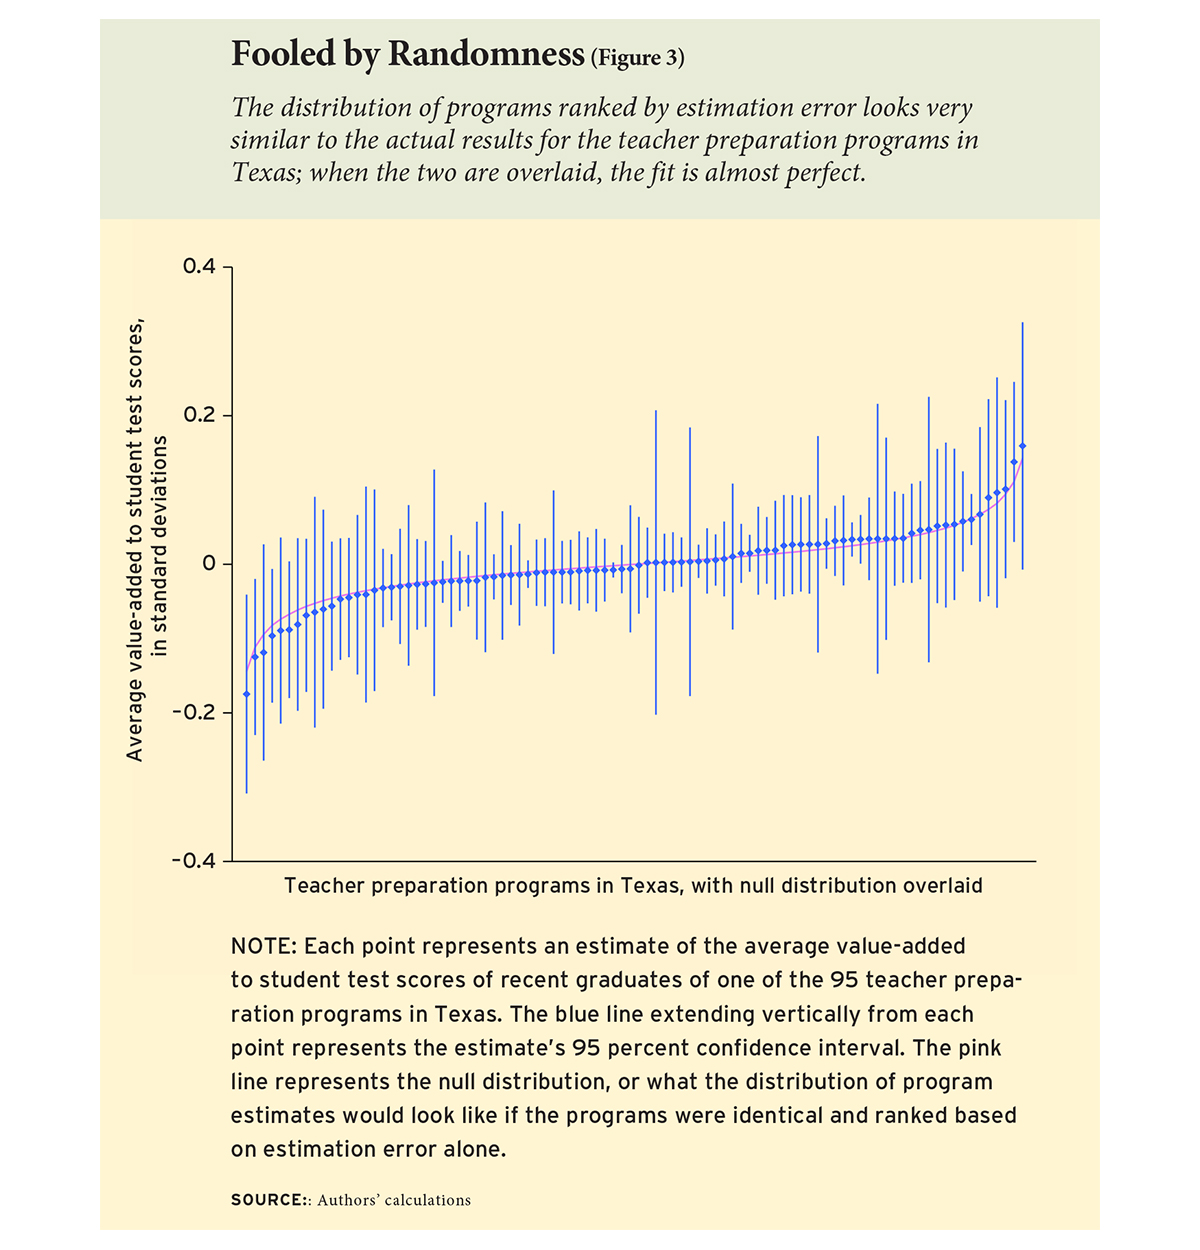
In fact, when we lay the null distribution over the Texas results, the fit is almost perfect (see Figure 3). Remember, the null distribution shows what program rankings would look like if they were entirely random. So the tight fit of the null distribution suggests that the rankings are, if not entirely random, then darn close. Even the programs that appear to stand out may stand out because of error. In fact, three quarters of the variation in Texas rankings—three quarters of the reason that one program ranks above another—is random chance. Only one quarter of the variation has anything to do with program quality.
When true differences are small and estimates are noisy, it is hard to single out specific programs as different from average. Here, too, it is easy to fool ourselves. According to the conventions of statistics, about 5 percent of the time we are permitted to make a “type 1 error” that singles out a program as “significantly different” when it is truly average. That risk might be acceptable in a state with just a couple of programs, but in Texas, where there are almost 100 programs, a 5 percent error rate ensures that we’ll erroneously label about five ordinary programs as exceptional. In fact, when we conducted our Texas evaluation, we found seven programs that were “significantly different” from average. Quite possibly five of these differences, or even all seven, were type 1 errors. Quite possibly just two of the programs, or none, were truly different.
A Six-State Review
After finishing our report card on Texas, we were a little confused. Our Texas results suggested there was little difference in effectiveness between teachers from various programs. Research from Missouri agreed. Yet there were reports from Louisiana and New York City suggesting larger differences. And there were reports from Florida and Washington State that we wanted to look at more closely.
Adding to the confusion, in each state researchers had compared programs using different statistical methods. So when researchers reached different conclusions, we couldn’t be sure if it was because of their programs or because of the methods used to compare them.
To clear things up, we re-analyzed the results from different states using a uniform set of statistical best practices. When we did that, we found that results from different states were actually very similar. In every state, the differences between most programs were minuscule. Having a teacher from one program or another typically changed student test scores by just .01 to .03 standard deviations, or 1 to 3 percent of the average score gap between poor and non-poor children.
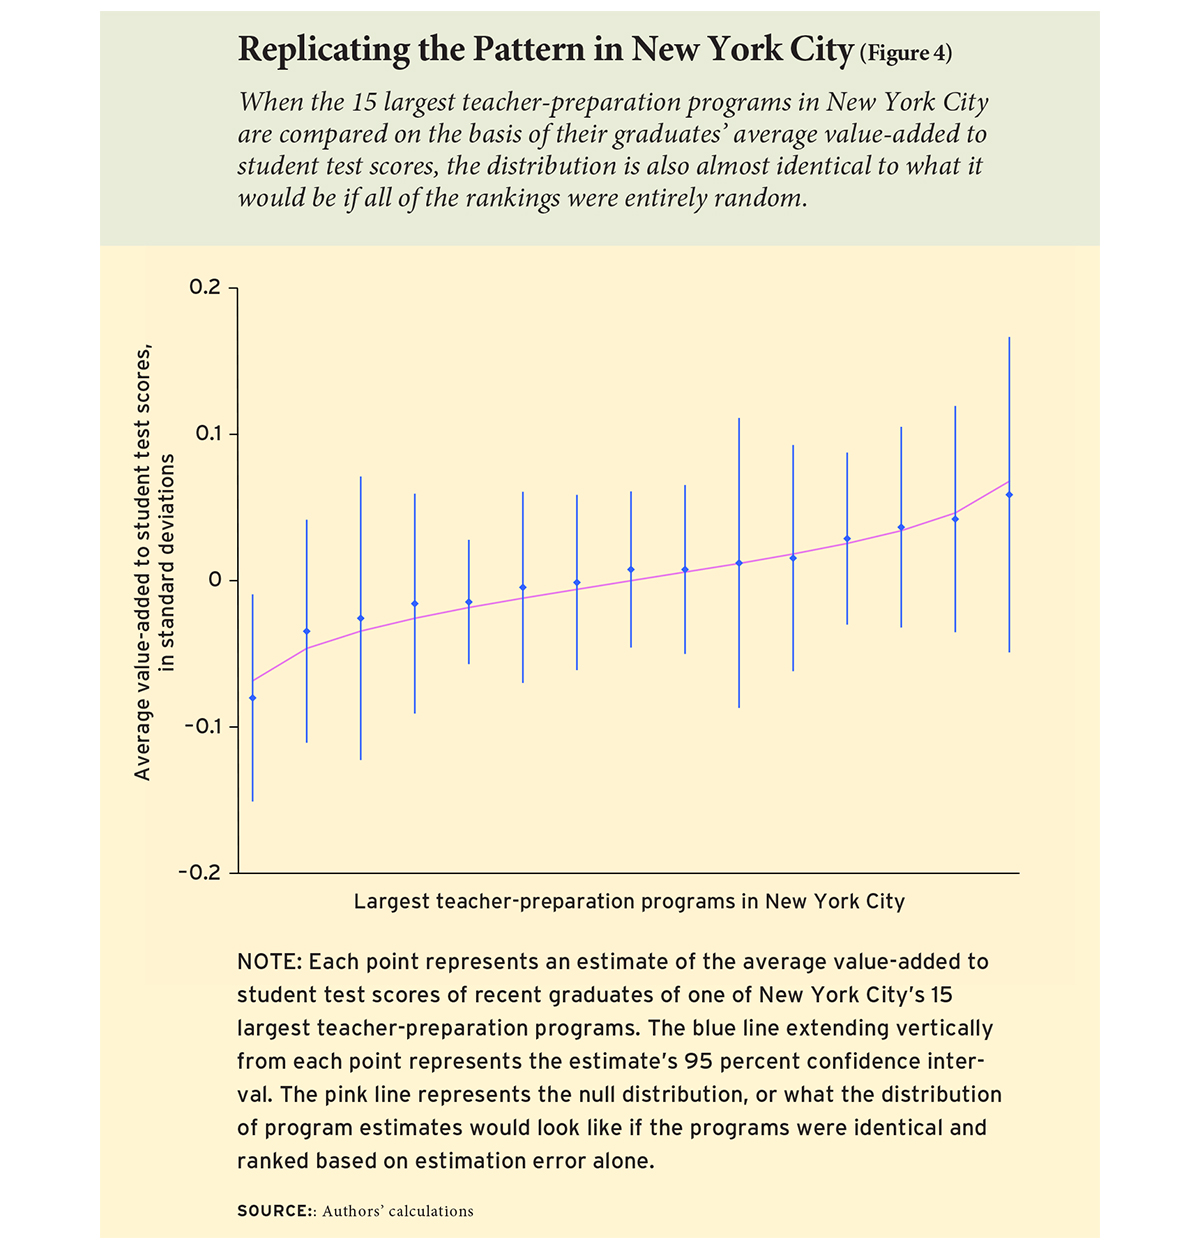
Remarkably, these patterns held in every state we looked at—not just in Missouri and Texas, where program differences were already thought to be negligible, but also in Louisiana and New York City, where larger differences had been reported previously. For example, when we re-analyzed estimates for the 15 largest teacher-preparation programs in New York City, we found no significant differences between programs (see Figure 4). The estimates hewed very close to the null distribution, suggesting that little but estimation error was present. Similar patterns also held in Florida and Washington.
Why Ranking Programs on Value-Added Won’t Work
The differences between programs are typically too small to matter. And they’re practically impossible to estimate with any reliability. The errors that we make in estimation will often be larger than the differences we are trying to estimate. Program rankings will consist largely of noise, and program rankings will bounce up and down randomly from one year to another.
This means that we cannot rank programs in a meaningful order. And we cannot justify classifying programs by performance level (“effective,” “at risk,” etc.), as the federal regulation would have required. Statistically, at most one or two programs stand out from the pack in any given state. The other programs are practically indistinguishable.
None of this means that there are no differences between individual teachers. A large body of literature shows that some teachers are better than others, and that teacher quality can have meaningful effects on student success—not just on test scores, but also on graduation rates and even job success.
The problem is that the good teachers don’t all come from the same programs. The differences between good and bad teachers from the same program are much larger than the average differences between one program and another. So even if we could do a better job ranking programs, knowing what program prepared a teacher would give employers little guidance about how effective the teacher was likely to be.
We also don’t believe that all teacher-preparation programs are the same. Although the vast majority of programs are practically indistinguishable, there are exceptions—at most one or two per state, our results suggest—that really do produce teachers whose average impacts on test scores are significantly better than average.
For example, we know that Teach For America and UTeach both produce above-average teachers, although their effects are moderate in size and limited to math and science. But we don’t know that from state report cards. We know it from evaluations that focused specifically on UTeach and Teach For America.
Our results suggest there may also be an occasional program whose teachers are significantly worse than average. It could be valuable to look more closely at these rare outliers. But trying to rank other programs on value-added will just create confusion.
Should We Rank Programs in Other Ways?
It’s not helpful to rank a state’s programs by teachers’ value-added. With rare exceptions, the true differences between programs are so small that rankings would consist mostly of noise. But can we look at other measures of program quality? Student test scores are not the only way to evaluate programs. In fact, although the federal regulation required that no program be classified as “effective” unless its graduates had an exceptional impact on test scores, it did require that programs be evaluated using other indicators of quality as well.
One of those indicators was the ratings of a program’s graduates by principals or supervisors conducting teacher observations. However, we believe it is premature to require principal ratings in a formal ranking system. While principal ratings do vary across programs, there is research evidence that principal ratings are biased. They are biased in favor of teachers with advantaged students, and they are biased toward teachers whom the principal likes, or at least has evaluated positively in the past. Ratings by impartial outsiders are less biased, but teacher-rating forms still have a lot of room for improvement. While teacher observations remain a good topic for research, until observation forms get better they are not something that regulations should require or that states should use to rank programs.
The federal regulation also suggested reporting teachers’ ratings of their own preparation programs. Whether these ratings should be required is debatable. There is little research on teachers’ ratings of preparation programs, and there is a danger that some ratings may be noisy or biased. Still, prospective teachers may want to know what their predecessors thought of the training offered by a given program.
Finally, the federal regulation suggested tracking programs’ record of placing and retaining graduates in the teaching profession, especially at high-need schools. We think this is an excellent idea. If a large percentage of a program’s graduates are not becoming teachers, or not persisting as teachers, that is clearly a concern. Likewise, if a large percentage of graduates are persisting, especially at high-need schools, that is a sign of success. And placement and retention are straightforward to measure by linking program rosters to employment records. We favor reporting the percentage of program graduates who enter and persist in the field for which they were trained—not just for teacher-preparation programs, but for other college majors and training programs as well.
Paul T. von Hippel is an associate professor at the University of Texas at Austin and Laura Bellows is a doctoral student in public policy at Duke University. A detailed account of this analysis is available in the January 2018 issue of Economics of Education Review.
This article appeared in the Summer 2018 issue of Education Next. Suggested citation format:
Von Hippel, P.T., and Bellows, L. (2018). Rating Teacher-Preparation Programs: Can value-added make useful distinctions? Education Next, 18(3), 34-41.