President-elect Joe Biden has made reopening a majority of K–8 schools for in-person instruction a priority for his administration’s first 100 days, with the goal of getting more American students safely back into the classroom. Yet neither information gathered so far by researchers, nor data reported by the federal government and the states, can say where the nation stands with respect to that goal. While various organizations have tracked school districts’ stated policies on reopening, those policies defy easy categorization and may not capture reality on the ground. Many districts and schools offer parents some choice about how their child is educated, making it even harder to gauge who is entering schools. Nearly halfway through the 2020–21 school year, we remain in the dark about how American schools have adapted amid the pandemic—and what American families are experiencing as a result.
We set out to close this gap. In November and December 2020, we surveyed a nationally representative sample of 2,155 American parents with children in kindergarten through 12th grade, including oversamples of parents who identify as Hispanic and parents who identify as Black (see sidebar on survey methodology). We also oversampled parents with children in private and charter schools, making it possible to compare their experiences with those making use of the traditional district sector. Each parent we surveyed answered questions about the schooling experiences of each of their children in kindergarten through 12th grade, including 3,762 children in total. We also asked them a set of questions about schools and school policies in the United States in order to see if those experiences have altered parents’ views (see sidebar Gauging the Pandemic’s Effects on Parental Opinion).
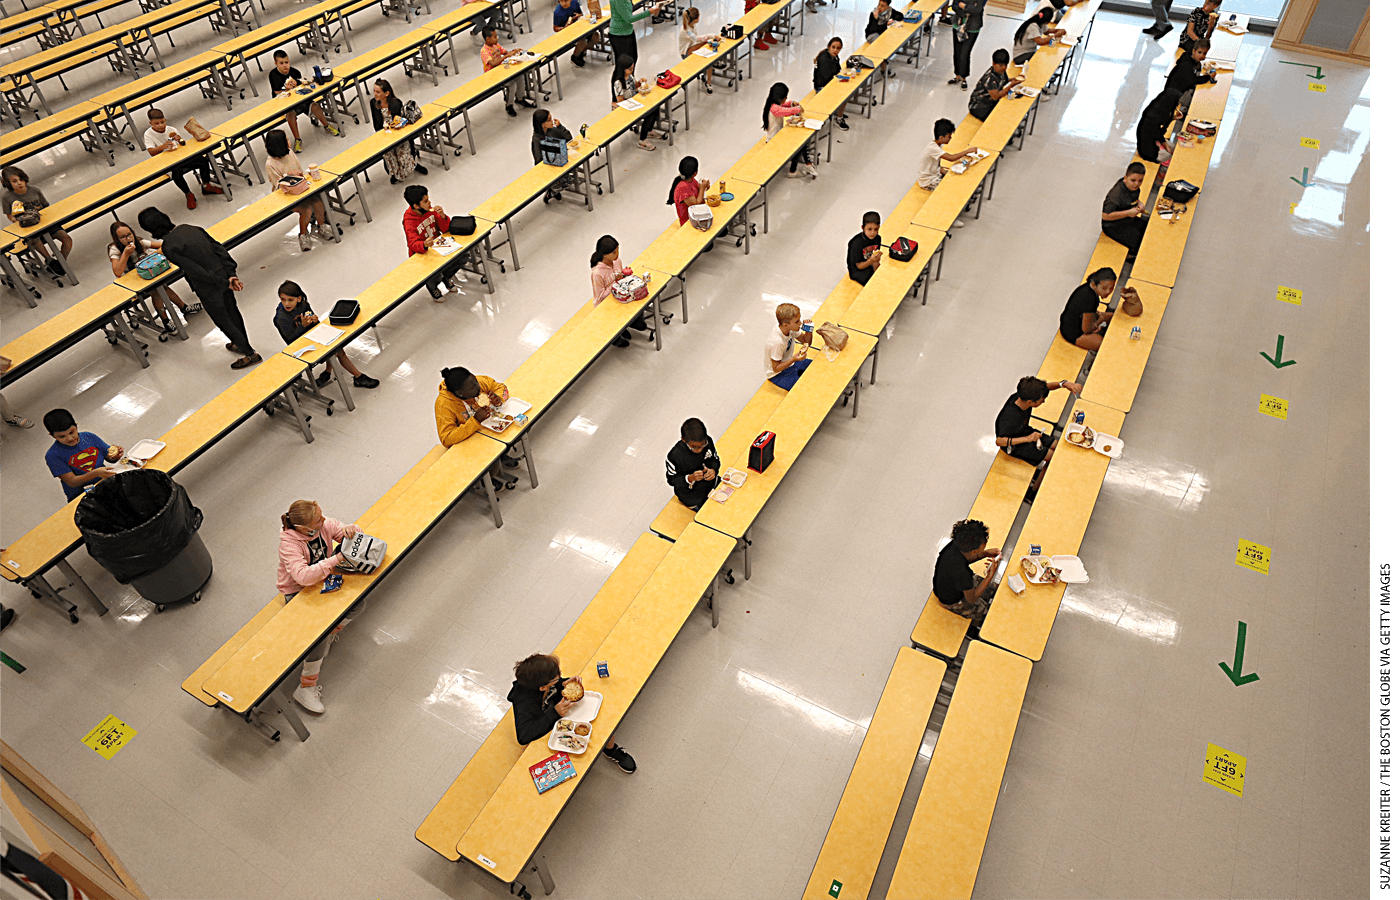
Our data reveal that more than half of U.S. students are receiving instruction entirely remotely this school year, while 28% of students receive instruction that is fully in person. Of the 19% of students in hybrid models, in-person instruction varies from one to five days a week.
The parents of most students remain broadly satisfied with the instruction and activities available from their children’s schools, yet the parents of 60% of students report that their child is learning less than would be the case absent the pandemic. Satisfaction levels are highest—and reports of learning loss least common—for students attending school in person. The hybrid model appears to offer no advantage over fully remote instruction.
We document large differences across sectors in the frequency of in-person instruction. Well over half of students enrolled in district and charter schools receive all their instruction fully remotely, while less than one quarter receive all of their instruction in person. The percentages are nearly reversed for children attending private schools: 60% receive instruction in person and just 18% receive their instruction remotely.
We also provide the first evidence on the relationship between in-person instruction and the incidence of Covid. The availability and usage of in-person instruction is unrelated to Covid incidence at the start of the 2020–2021 school year, when most districts made their reopening plans. By November, however, students were most likely to be attending school fully in person in counties where the virus was spreading most rapidly.
Three Modes of Instruction
Schools adapted to the Covid-19 pandemic in multiple ways, but these approaches generally fall into one of three categories: 1) fully remote instruction, which is usually provided almost entirely over the Internet; 2) fully in-person instruction, which is essentially business as usual, but in most cases with the addition of Covid safety protocols; and 3) hybrid instruction, a mix of remote and in-person learning. This last category has many permutations, but all make partial use of the schoolhouse.
Remote instruction has spread nearly as far and wide as the coronavirus itself. School officials have successfully upgraded their use of the tool since the spring of 2020, when many were forced to scramble when ordered to close their doors. According to parental reports, though, remote instruction still falls short of in-person instruction at school. At some point in the future, children may learn as much or more if they are taught online, but that day has not yet come. Nor is the hybrid solution working any better; in fact, parents’ reports suggest that it may be the worst available option.
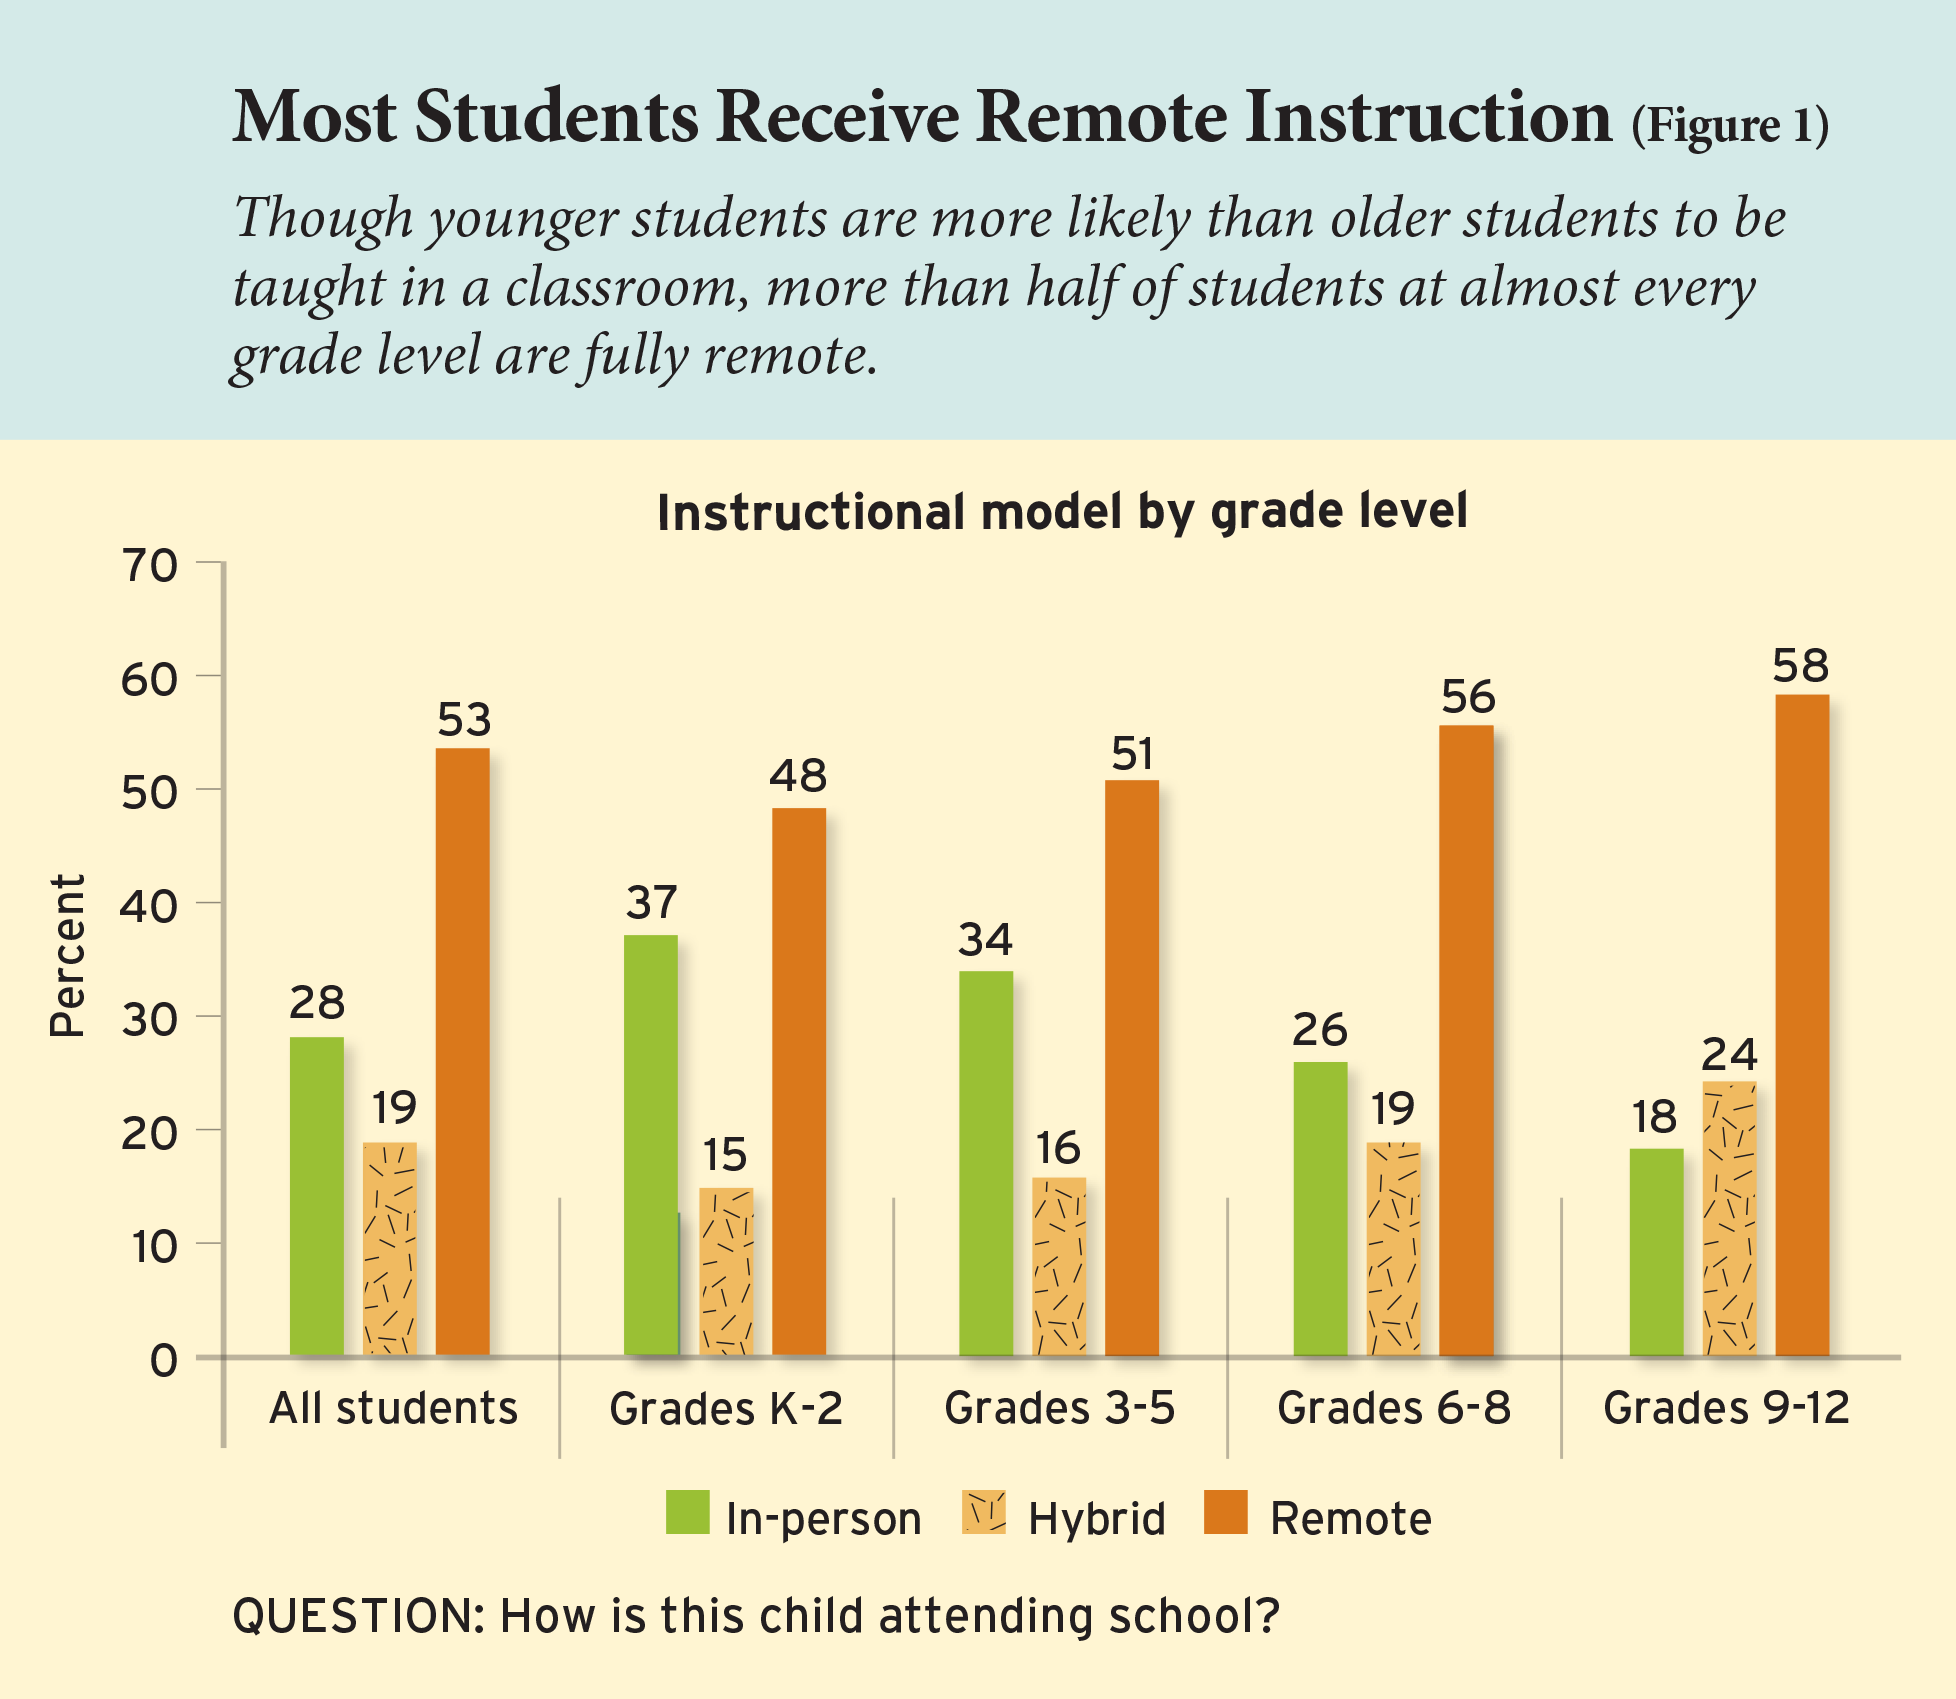
Prevalence. Remote learning dominates educational offerings in the 2020–2021 school year. According to parent reports, 53% of students are receiving instruction entirely remotely. Only 28% of students receive all their instruction in the classroom. Parents of another 19% say their children are learning via a hybrid model (see Figure 1). According to these parents, 49% of students in this model are at school just one or two days a week, 31% attend for three or four days, and 20% attend all five days (presumably for less than the full school day or on alternate weeks).
The younger the child, the more likely the instruction is to be delivered in person. According to parents, 37% of children in grades K–2 attend school in person, a percentage that declines to 34% for grades 3–5, 26% for grades 6–8, and 18% for those in high school. High schoolers, meanwhile, are roughly 10 percentage points more likely than the youngest learners to be in each of the other two models.
The parents of 72% of students say they have some choice as to how their child attends school, a percentage that does not vary much by grade level. The parents of 84% and 89% of those being taught in the in-person and hybrid models, respectively, say they have a choice in the matter, but parents of only 60% of the fully remote children say they have an option for their children to receive instruction in a different way.
As for the range of available choices, the parents of only 41% of students report that their child’s school offers a fully in-person option, suggesting that more than two-thirds of students who were presented that option took it. The parents of 48% of students say that their child has a hybrid option, and the parents of 77% say that their child can attend fully online.
Mode of instruction and Covid incidence. The fully remote and hybrid instructional models aim to limit the spread of Covid-19 among students, school staff, and the broader community. We might therefore expect the use of those models to be correlated with measures of the incidence of the virus, with greater use of the fully remote option in places hardest hit by the virus. Yet education officials’ reopening plans have also been shaped by political considerations that have little to do with public health concerns. In particular, research has shown that districts in which the 2016 Republican presidential candidate received more support and districts with weaker teachers unions were both more likely to offer in-person instruction in fall 2021. The severity of the public health crisis in the local community appears to have had little effect on districts’ decisions to open schools in person.
Our nationally representative data allow us to provide the first evidence on how the full range of options available to American parents—and the choices parents make in light of those options—vary with the incidence of the virus. We find no clear relationship between the availability of in-person instruction and Covid incidence as of the start of the school year. By November, the combination of district and parent decisionmaking had produced a troubling pattern: students are most likely to be attending school fully in person in school districts where the virus is spreading most rapidly.
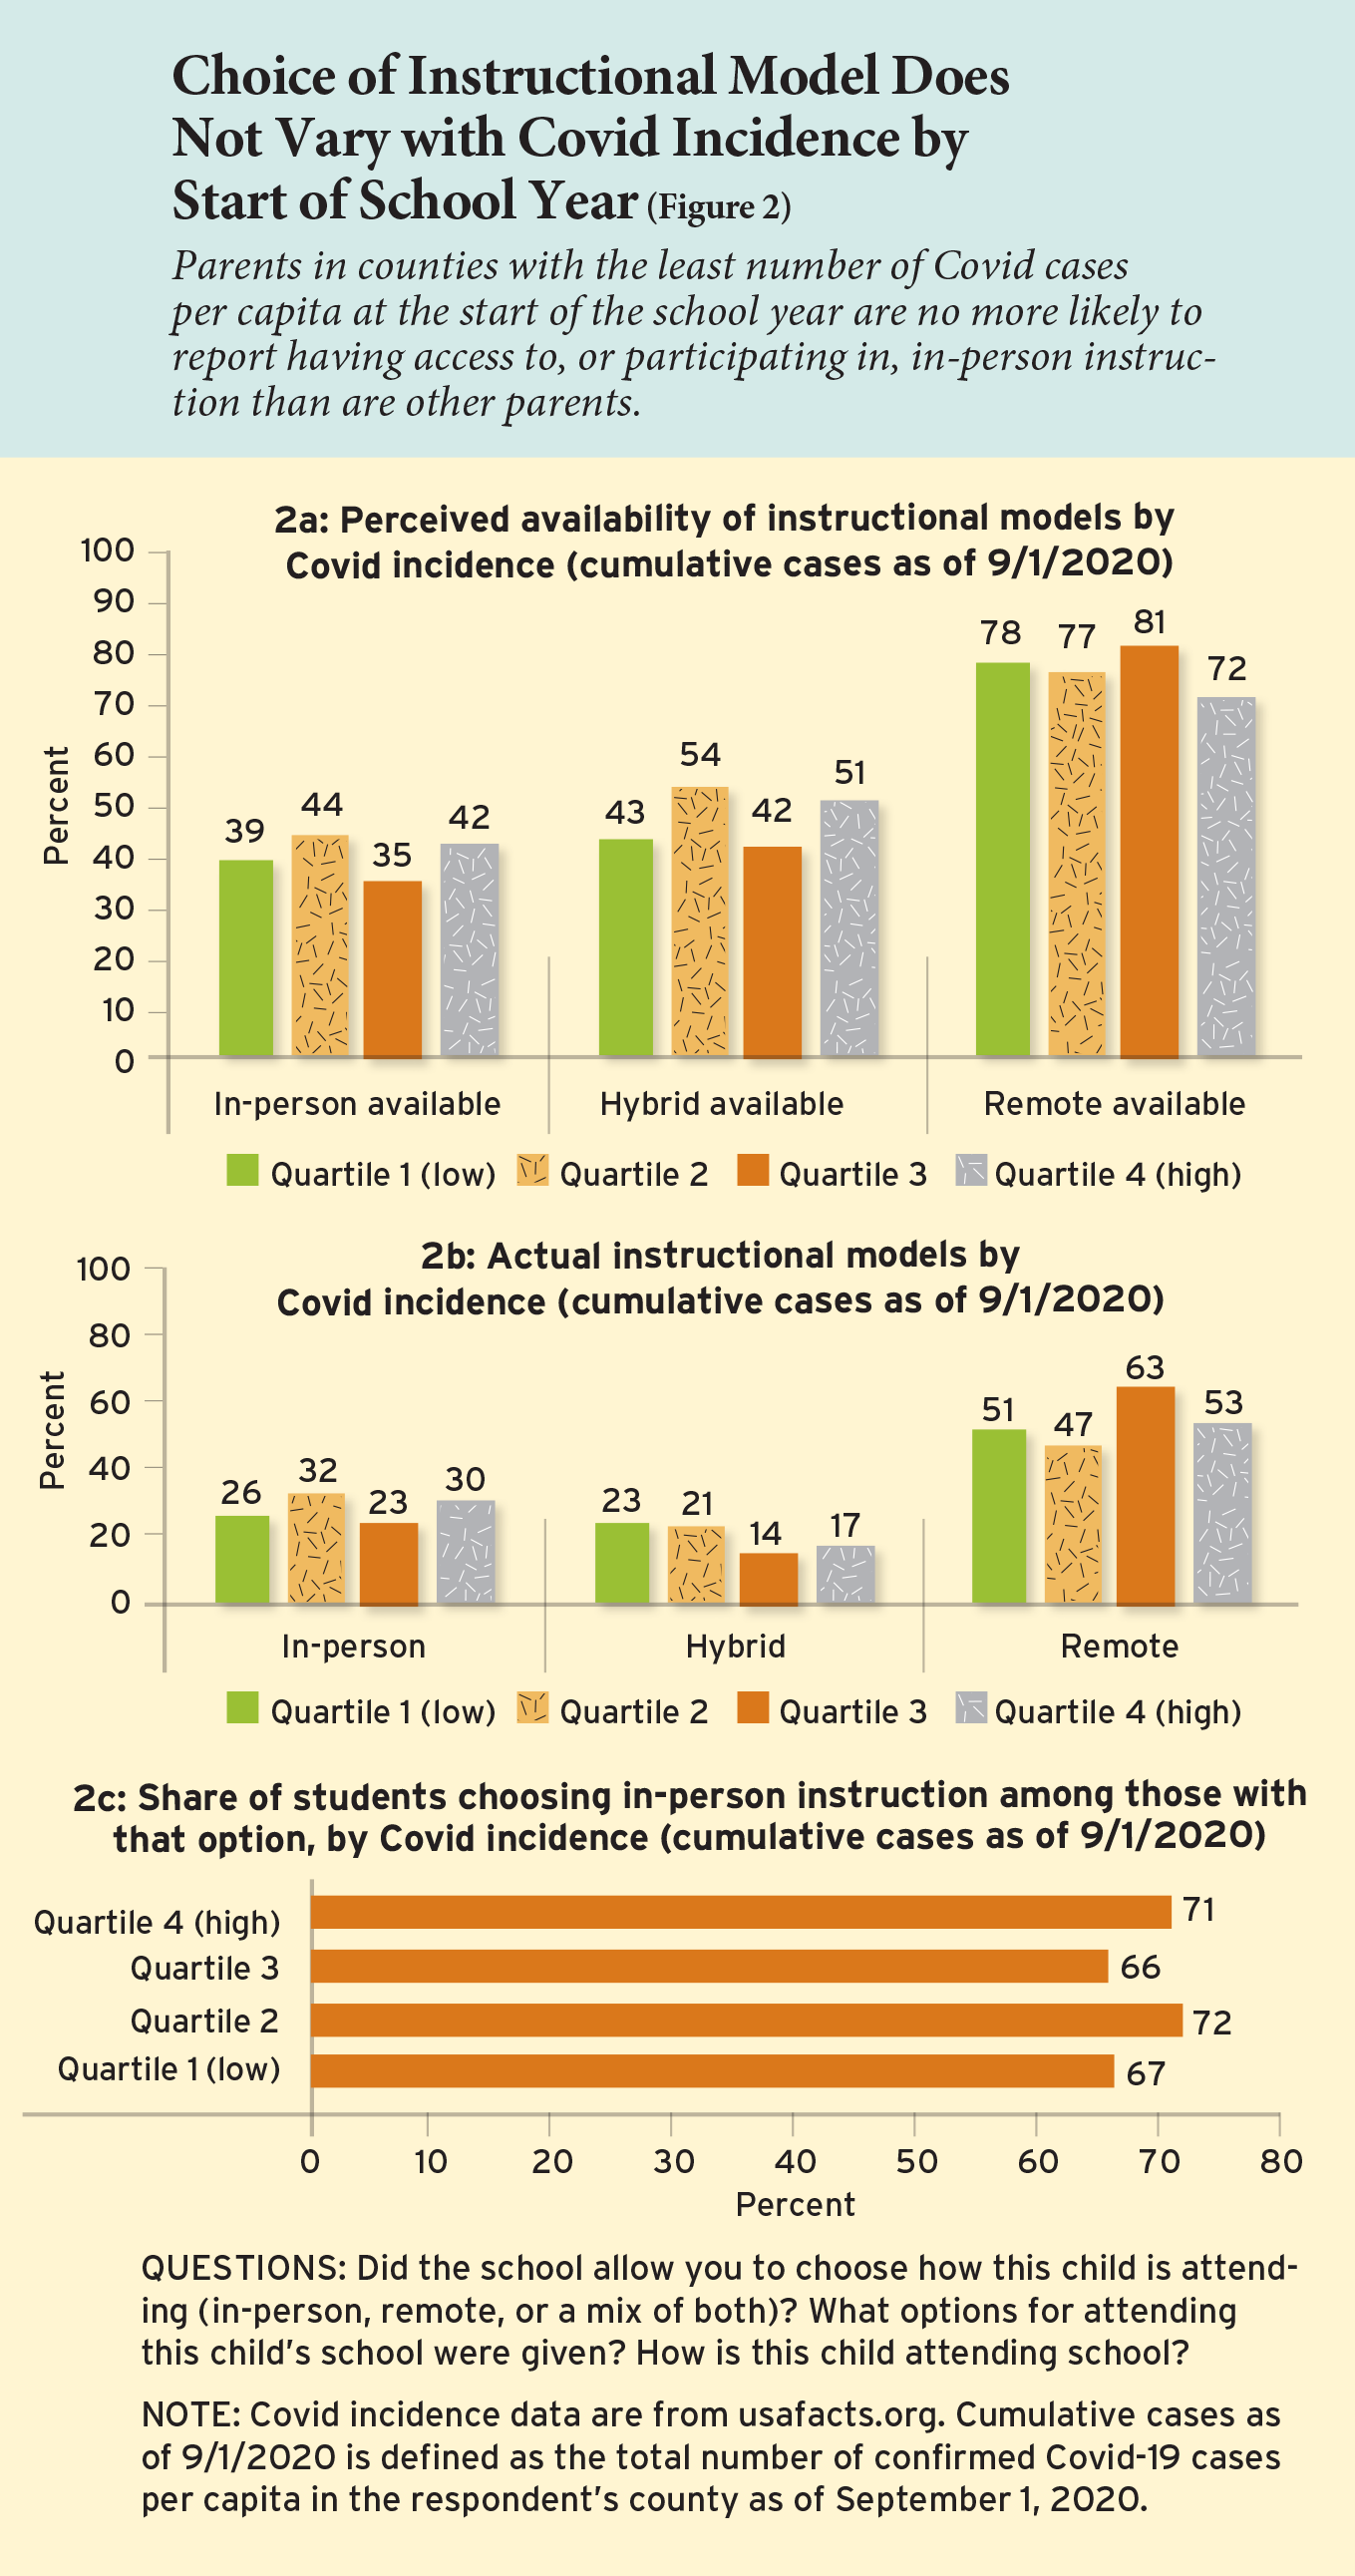
We first examine the relationship between Covid incidence as of the start of the school year, when most districts crafted their reopening plans, and the availability and use of each instructional model in November. To do so, we link each parent respondent to data on the cumulative number of confirmed Covid cases as a fraction of the local population in the respondent’s county as of September 1. We then group parents into quartiles based on this indicator of Covid incidence. Among parents in counties where Covid had its least cumulative impact, the parents of 39% of students report having the option of fully in-person instruction—essentially the same as the 42% of students who have the option where Covid’s impact was greatest (see Figure 2a). Nor do we see a relationship between virus counts and the share of students whose parents say they could choose the fully remote or the hybrid model.
The pattern is roughly the same when we look at actual use (as opposed to the availability) of the three instructional models: the parents of 26% of students in counties with the fewest Covid cases per capita as of September 1 report that their child is learning in person full time—as compared to 30% in counties with the most cases (see Figure 2b). Consistent with this, we find few differences across the groups of counties in the share of students whose parents selected fully in-person instruction when given the option to do so (see Figure 2c).
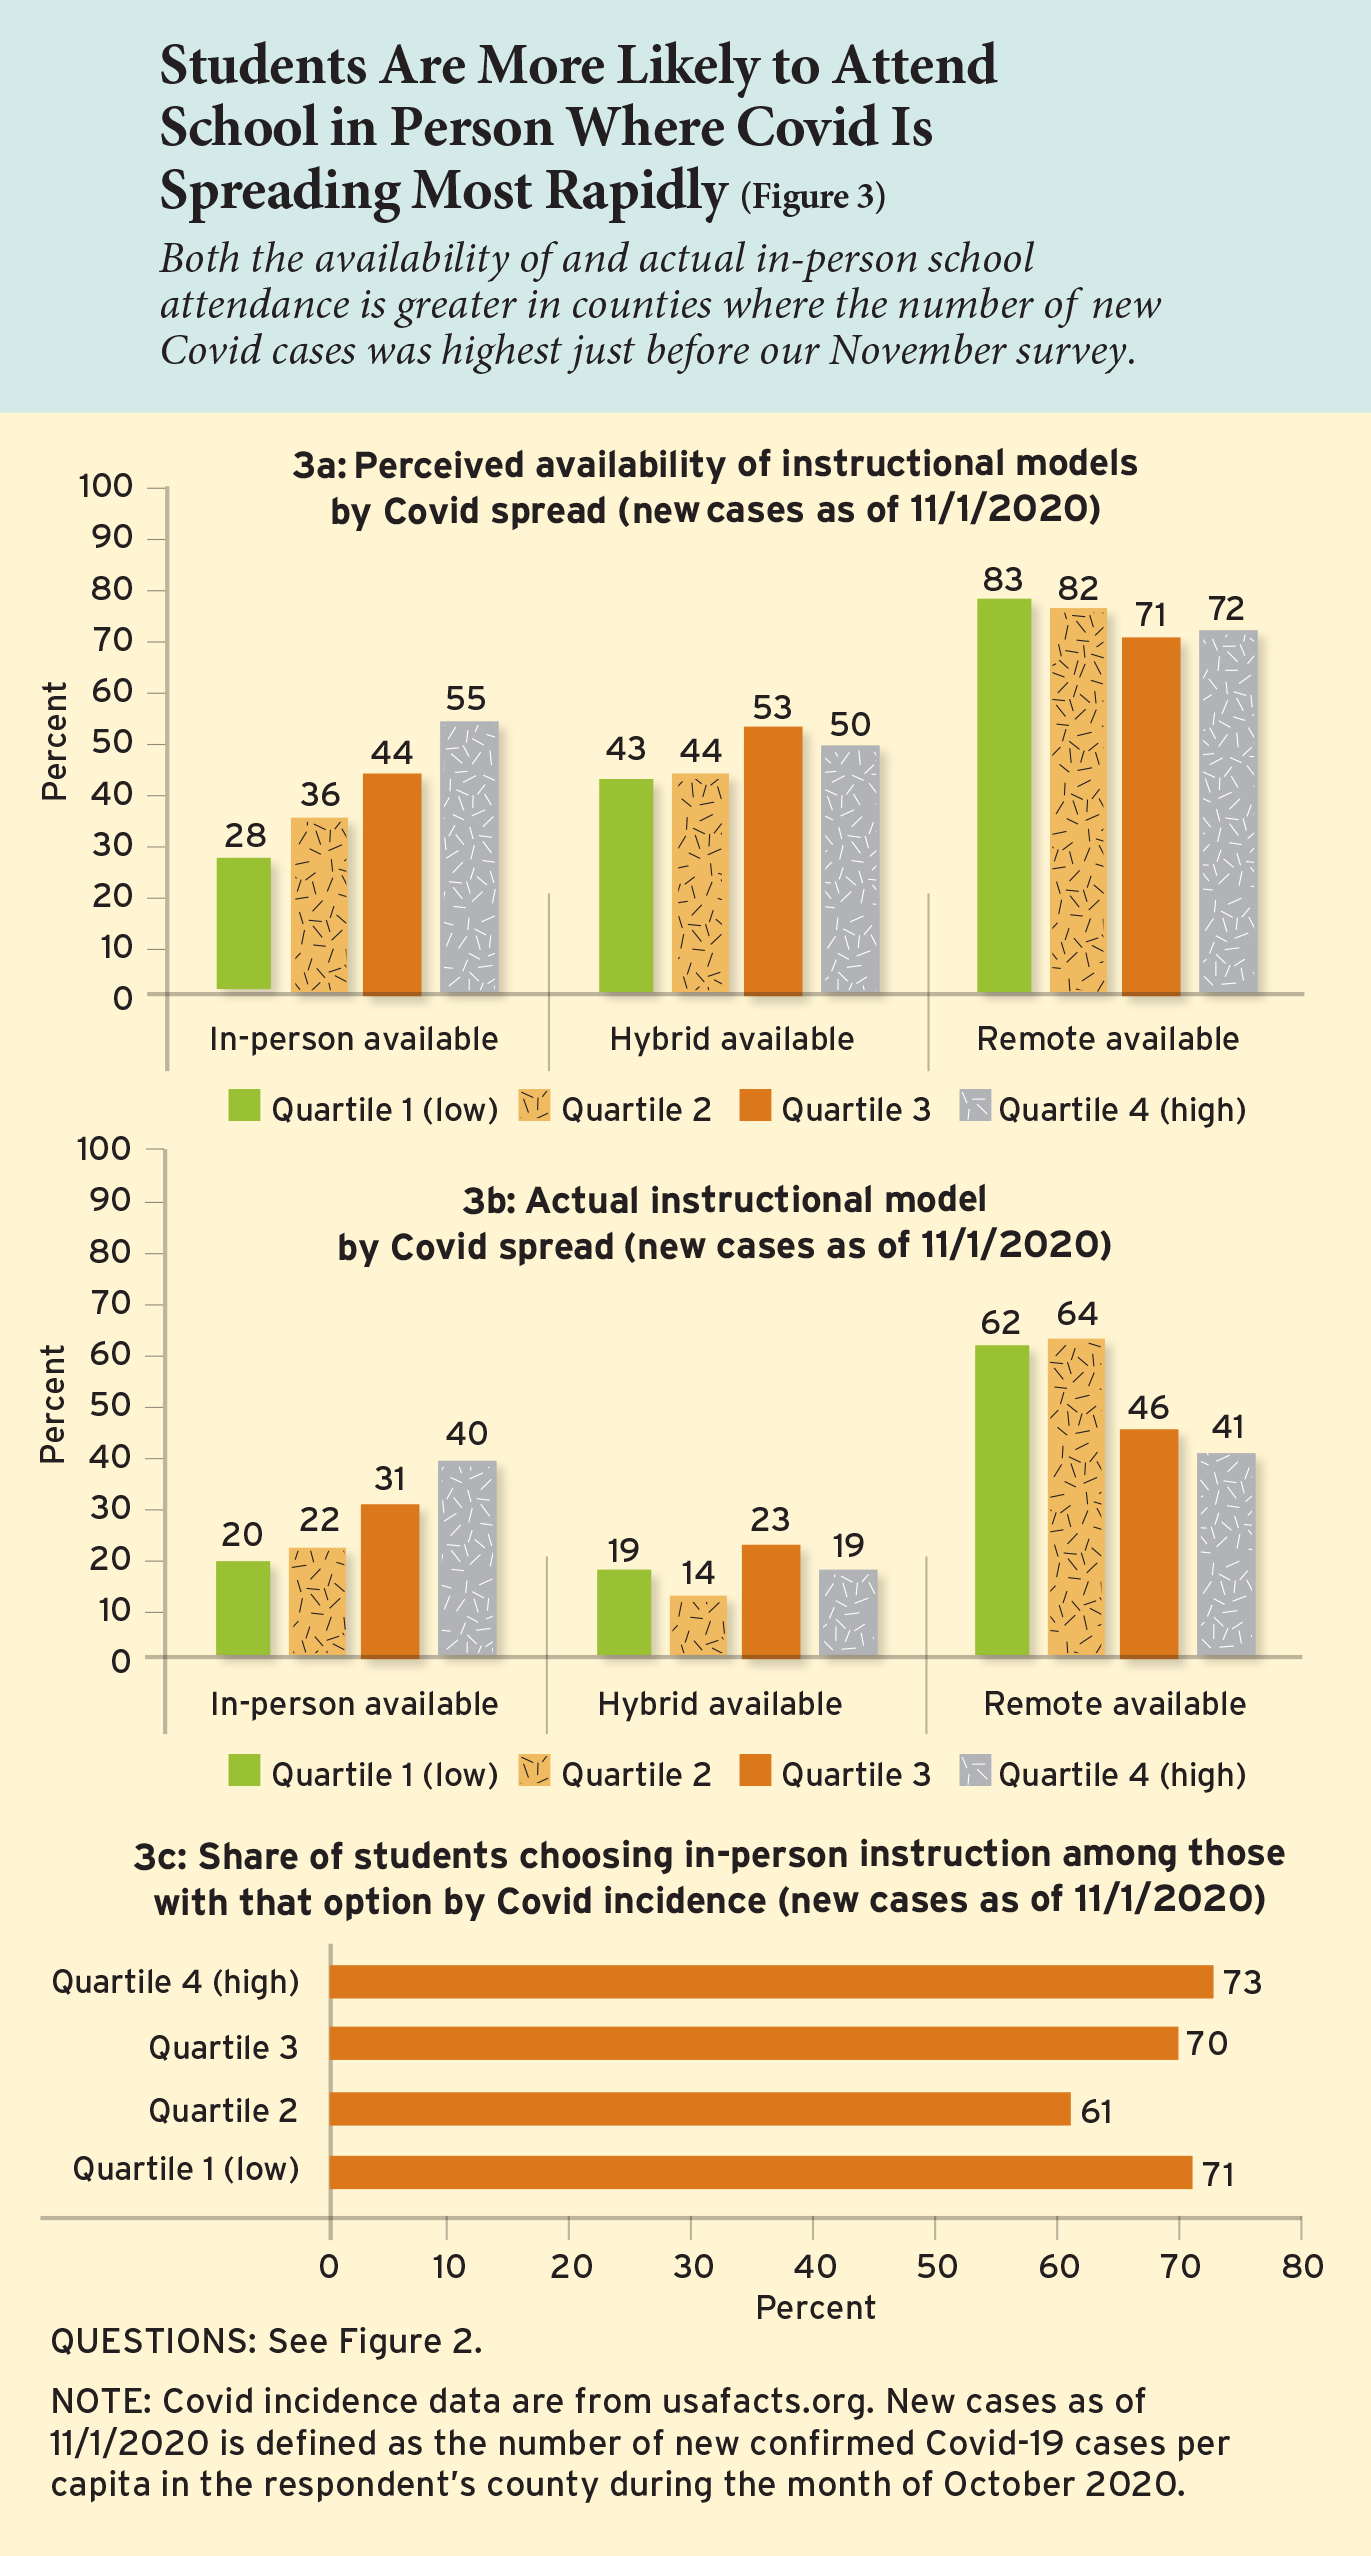
The picture changes when we look at the relationship between instructional mode and the number of newly diagnosed Covid cases per capita in the month of October—an indicator that captures the pace of viral spread just before we conducted our survey in November. Using this indicator, we find clear positive relationships between both availability and use of the fully in-person model and recent spread of the virus (see Figures 3a and 3b). For example, the parents of just 20% of students in the quartile of counties reporting the fewest new cases say their child attends school fully in person, as compared to 40% for students in the quartile with the most new cases. As with the September data, however, we find that most of the difference is related to schools’ decisionmaking. If the in-person model is available, parents are as likely to choose it whether they live in a place where the virus is most prevalent or where it’s least prevalent (see Figure 3c).
To be clear, this pattern does not constitute evidence that greater use of in-person instruction has contributed to the spread of the virus across the United States. It is equally plausible that counties where in-person schooling is most common are places where there are fewer measures and practices in the wider community designed to mitigate Covid spread. Evidence from studies designed specifically to test the effects of school reopening on transmission of the virus suggests that it can be done safely, at least when levels of community spread are low. Our data indicate, however, that the decentralized process of school and family decisionmaking our nation has relied on amid the pandemic has produced a perverse result: in-person instruction is both least common where it is most likely to be safe, and vice versa.
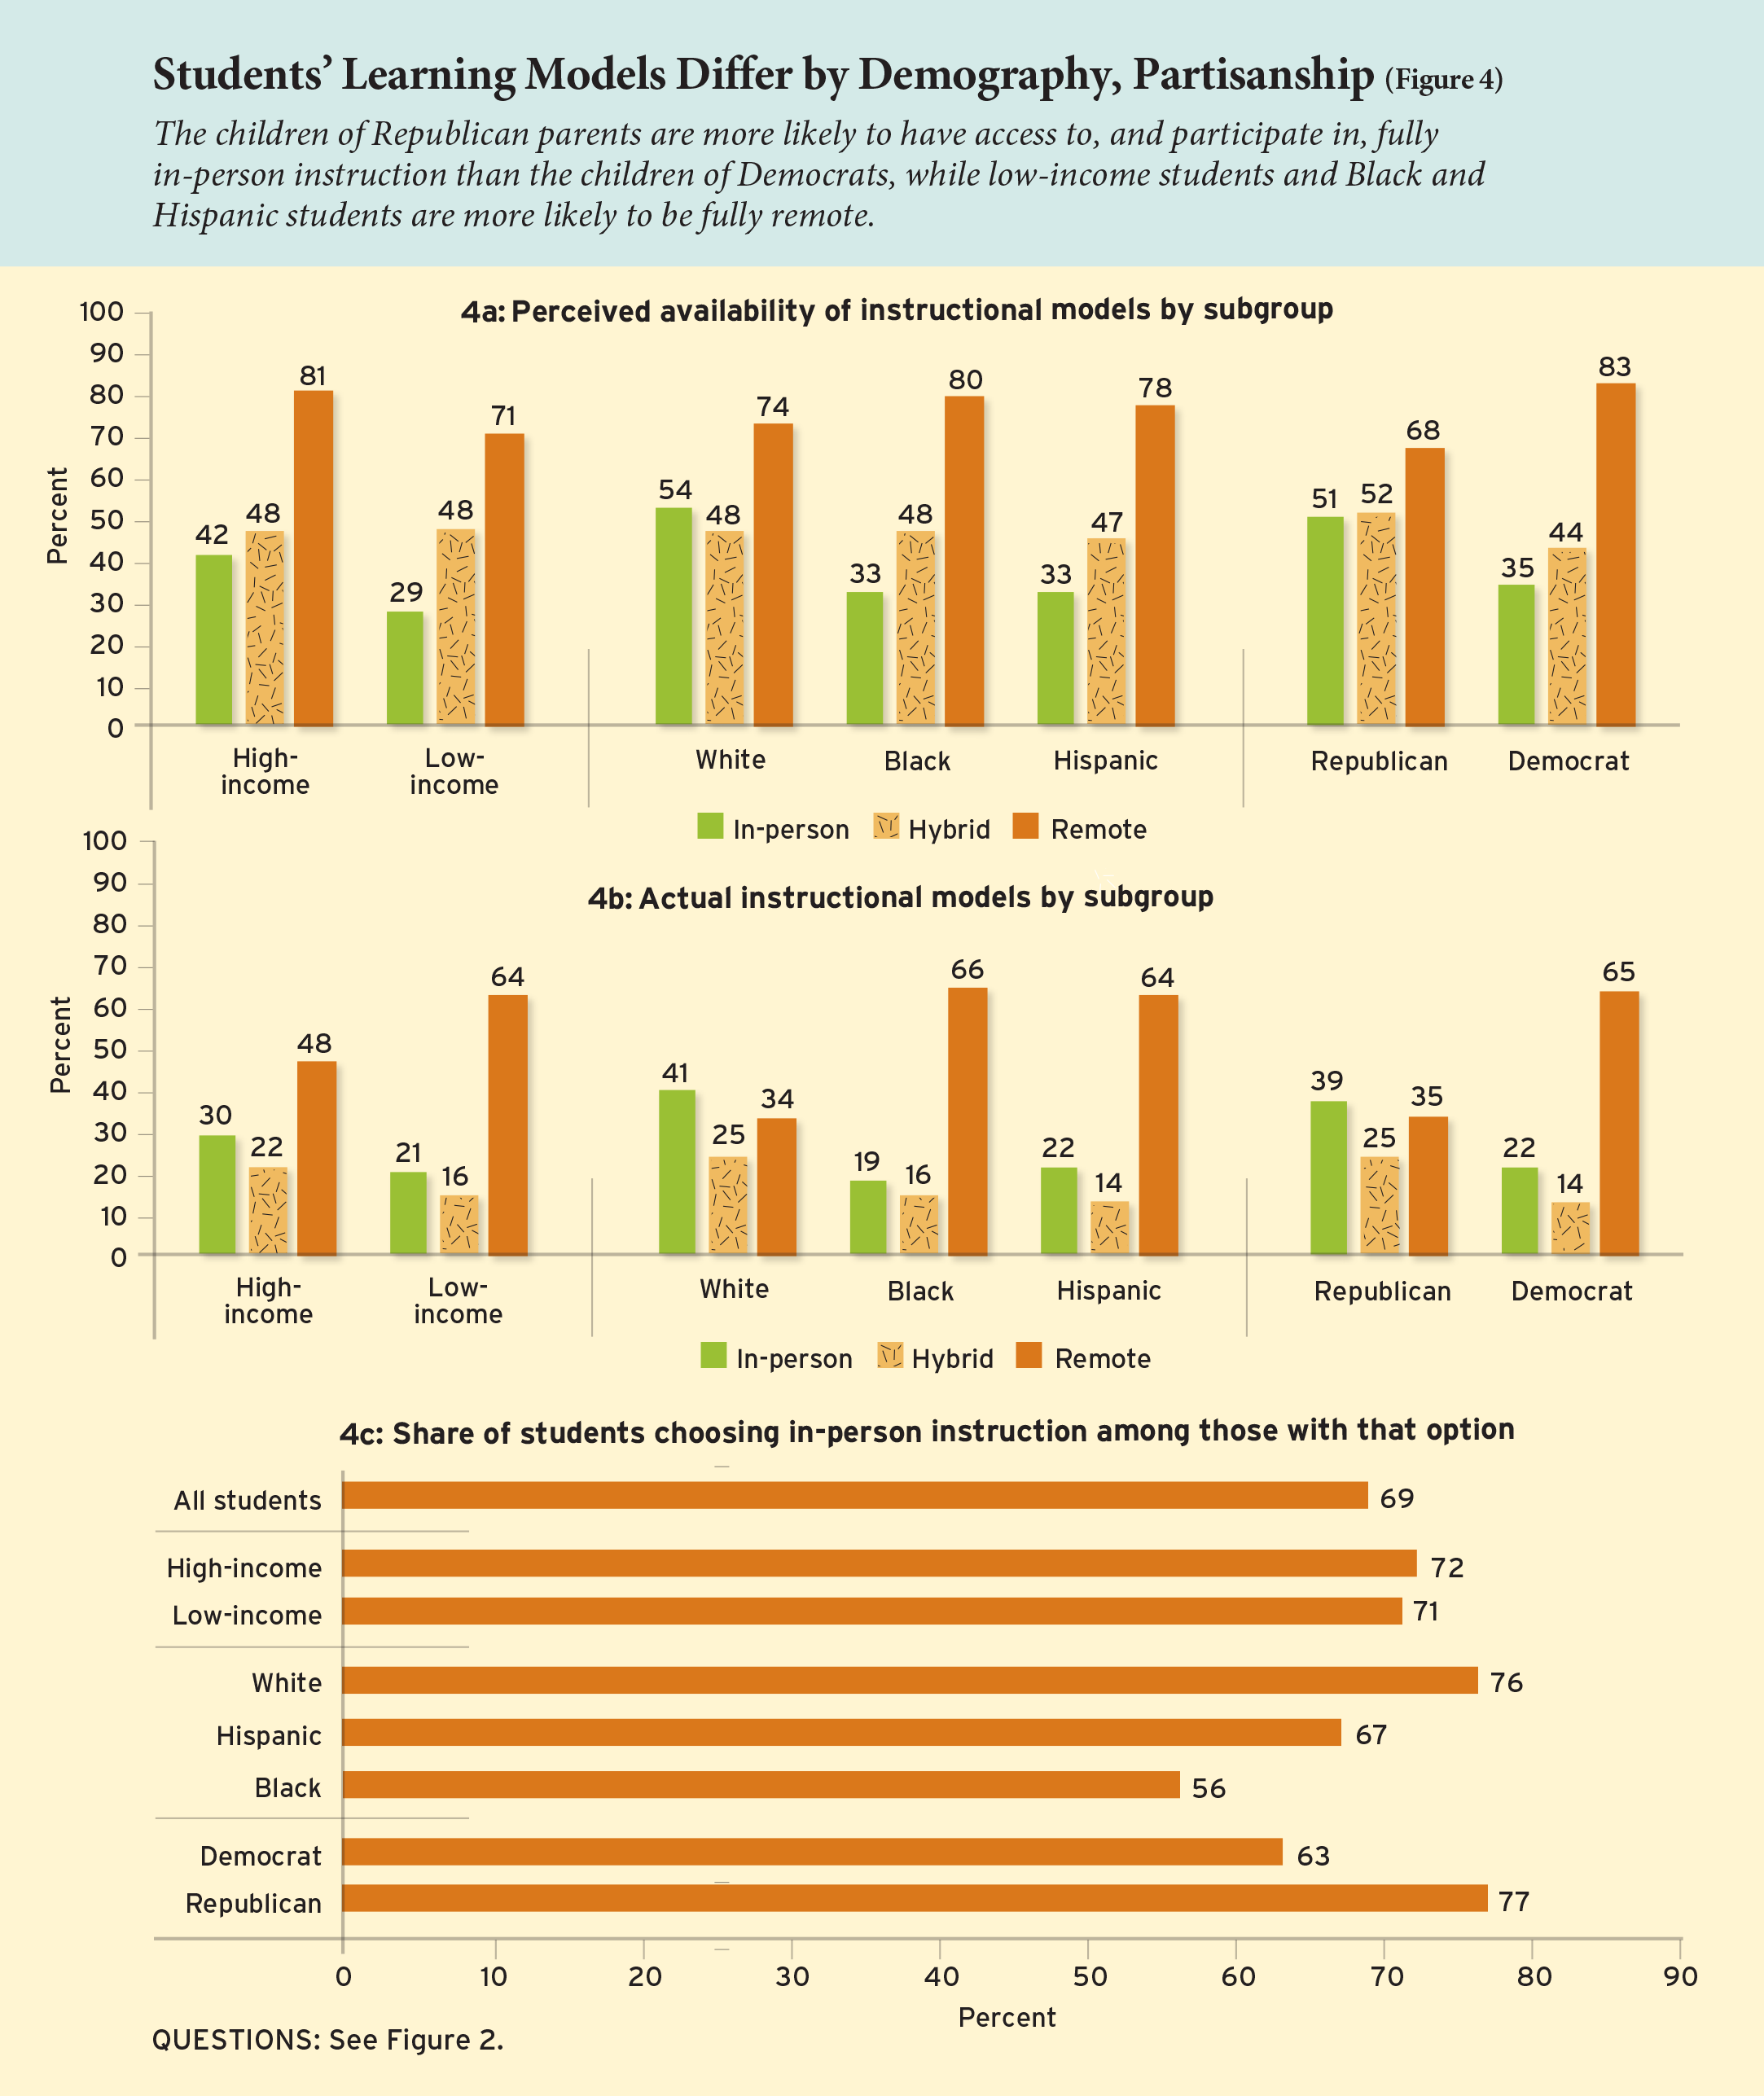
Mode of instruction, demographics, and partisanship. That same decentralized process has produced sharp differences in how students are learning across ethnic, economic, and partisan lines. Parents of students in the top quartile of household income as well as the parents of white students report greater availability and use of both fully in-person and hybrid instruction than do parents of students in the bottom income quartile and the parents of Black and Hispanic students (see Figures 4a and 4b). Meanwhile, parents of low-income students and parents of Black and Hispanic students are far more likely to report that their child is fully remote. The differences by income appear to stem mainly from the options available to families. However, parents of Black students and parents of Hispanic students are, respectively, 19 percentage points and 8 percentage points less likely than the parents of white students to choose the fully in-person model when it is available to them (see Figure 4c).
Meanwhile, according to parents’ reports, the children of Republican parents (that is, those for whom the parent who completed the survey identifies as a Republican) are more likely to have access to (51%) and be participating in (39%) fully in-person instruction than are the children of Democrats (35% and 22%, respectively). These differences are expected, given prior research on the factors shaping school district decisionmaking amid the pandemic. However, our data make it possible for the first time to see whether Republicans are more likely than Democrats to choose in-person instruction when they have the option. Among children of Republican respondents, 77% of those with the option to attend school in person full time are doing so. Among children of Democratic respondents, the analogous share is just 63%. Apparently partisanship influences not just parents’ attitudes toward policies to combat the virus, but also their personal decisionmaking.
Pandemic pods. Our data also permit us to gauge the extent of the most widely discussed adaptation to the pandemic on the part of American households: The formation of pods through which families band together in small groups to share responsibility for childcare, instruction, or both. Some commentators hail this development as an example of Americans’ resilience and ingenuity, while others fret about its implications for equal opportunity. But just how common are pandemic pods at the midpoint of the 2020–21 school year?
According to parent reports, 72% of students are participating in remote or hybrid instruction, leaving them in need of supervision and potentially academic support during the school day. Of these students, the parents of 20% report that their child regularly participates in additional instruction with someone who is neither affiliated with the child’s school nor a family member living in the home. The parents of 40% of students who participate in this form of tutoring report doing so in a group with other children. In other words, the parents of fewer than 6% of American students report participating in a pandemic pod. Even so, this represents more than three million students nationwide.
Perhaps surprisingly, parent reports suggest that students from families in the bottom quartile of the income distribution are more likely to participate in a pod than are students from families in the top quartile. In part this is because a greater share of students from low-income families are in remote or hybrid models (79% vs. 70% of students from high-income families). But even among students in one of those models, low-income parents are also more likely to report that their child receives additional instruction from someone other than the child’s school or a household member (25% vs. 17%). Overall, parent reports suggest that 9% of all students from low-income families and 5% of all students from high-income families are participating in pods.
The parents of an even smaller fraction of students who report that their child is receiving additional instruction from someone other than the school or a household member say that they pay for this service. Across all students receiving this kind of tutoring, whether in a group setting or individually, the parents of only 20% report paying. That share, however, is far higher for students from high-income families (39%) than it is for students from low-income families (8%). In other words, our data suggest that low-income families rely on unpaid assistance in instructing their children outside of school, while many higher income families hire instructors.
Improvements in remote instruction. With a majority of American students learning via fully remote models, it is worth investigating whether parents find this approach more robust than they did in the spring, when many parents responding to our prior survey said their children had limited interaction with teachers (see “What American Families Experienced When Covid Closed Their Schools,” Winter 2021). The good news is that the situation improved greatly by the time schools opened again in the fall.
For example, in May, the parents of only 17% of students said their child’s teacher met online with the whole class daily during a typical week. By November, this percentage rose to 76% among those students engaged in fully remote instruction. The share of students whose parents reported that whole-class meetings occurred at least several times a week rose to 91% from 46%. Parents of remote students also reported in November that their children have more frequent one-on-one interaction with teachers. The share of fully remote students whose parents say such contact occurs several times a week or more is at 35%, up from 19% in May.
We see similar increases in the frequency with which students receive assignments and feedback on their work. The parents of 75% of students reported in November that their child’s school or teachers assign required work on a daily basis, up from 45% in May. At that time, the parents of only 21% of students said their child received daily feedback on completed assignments, with parents of another 27% reporting their child got feedback several times a week. For students who are fully remote in the 2020–21 school year, those shares have increased to 42% and 30%, respectively.
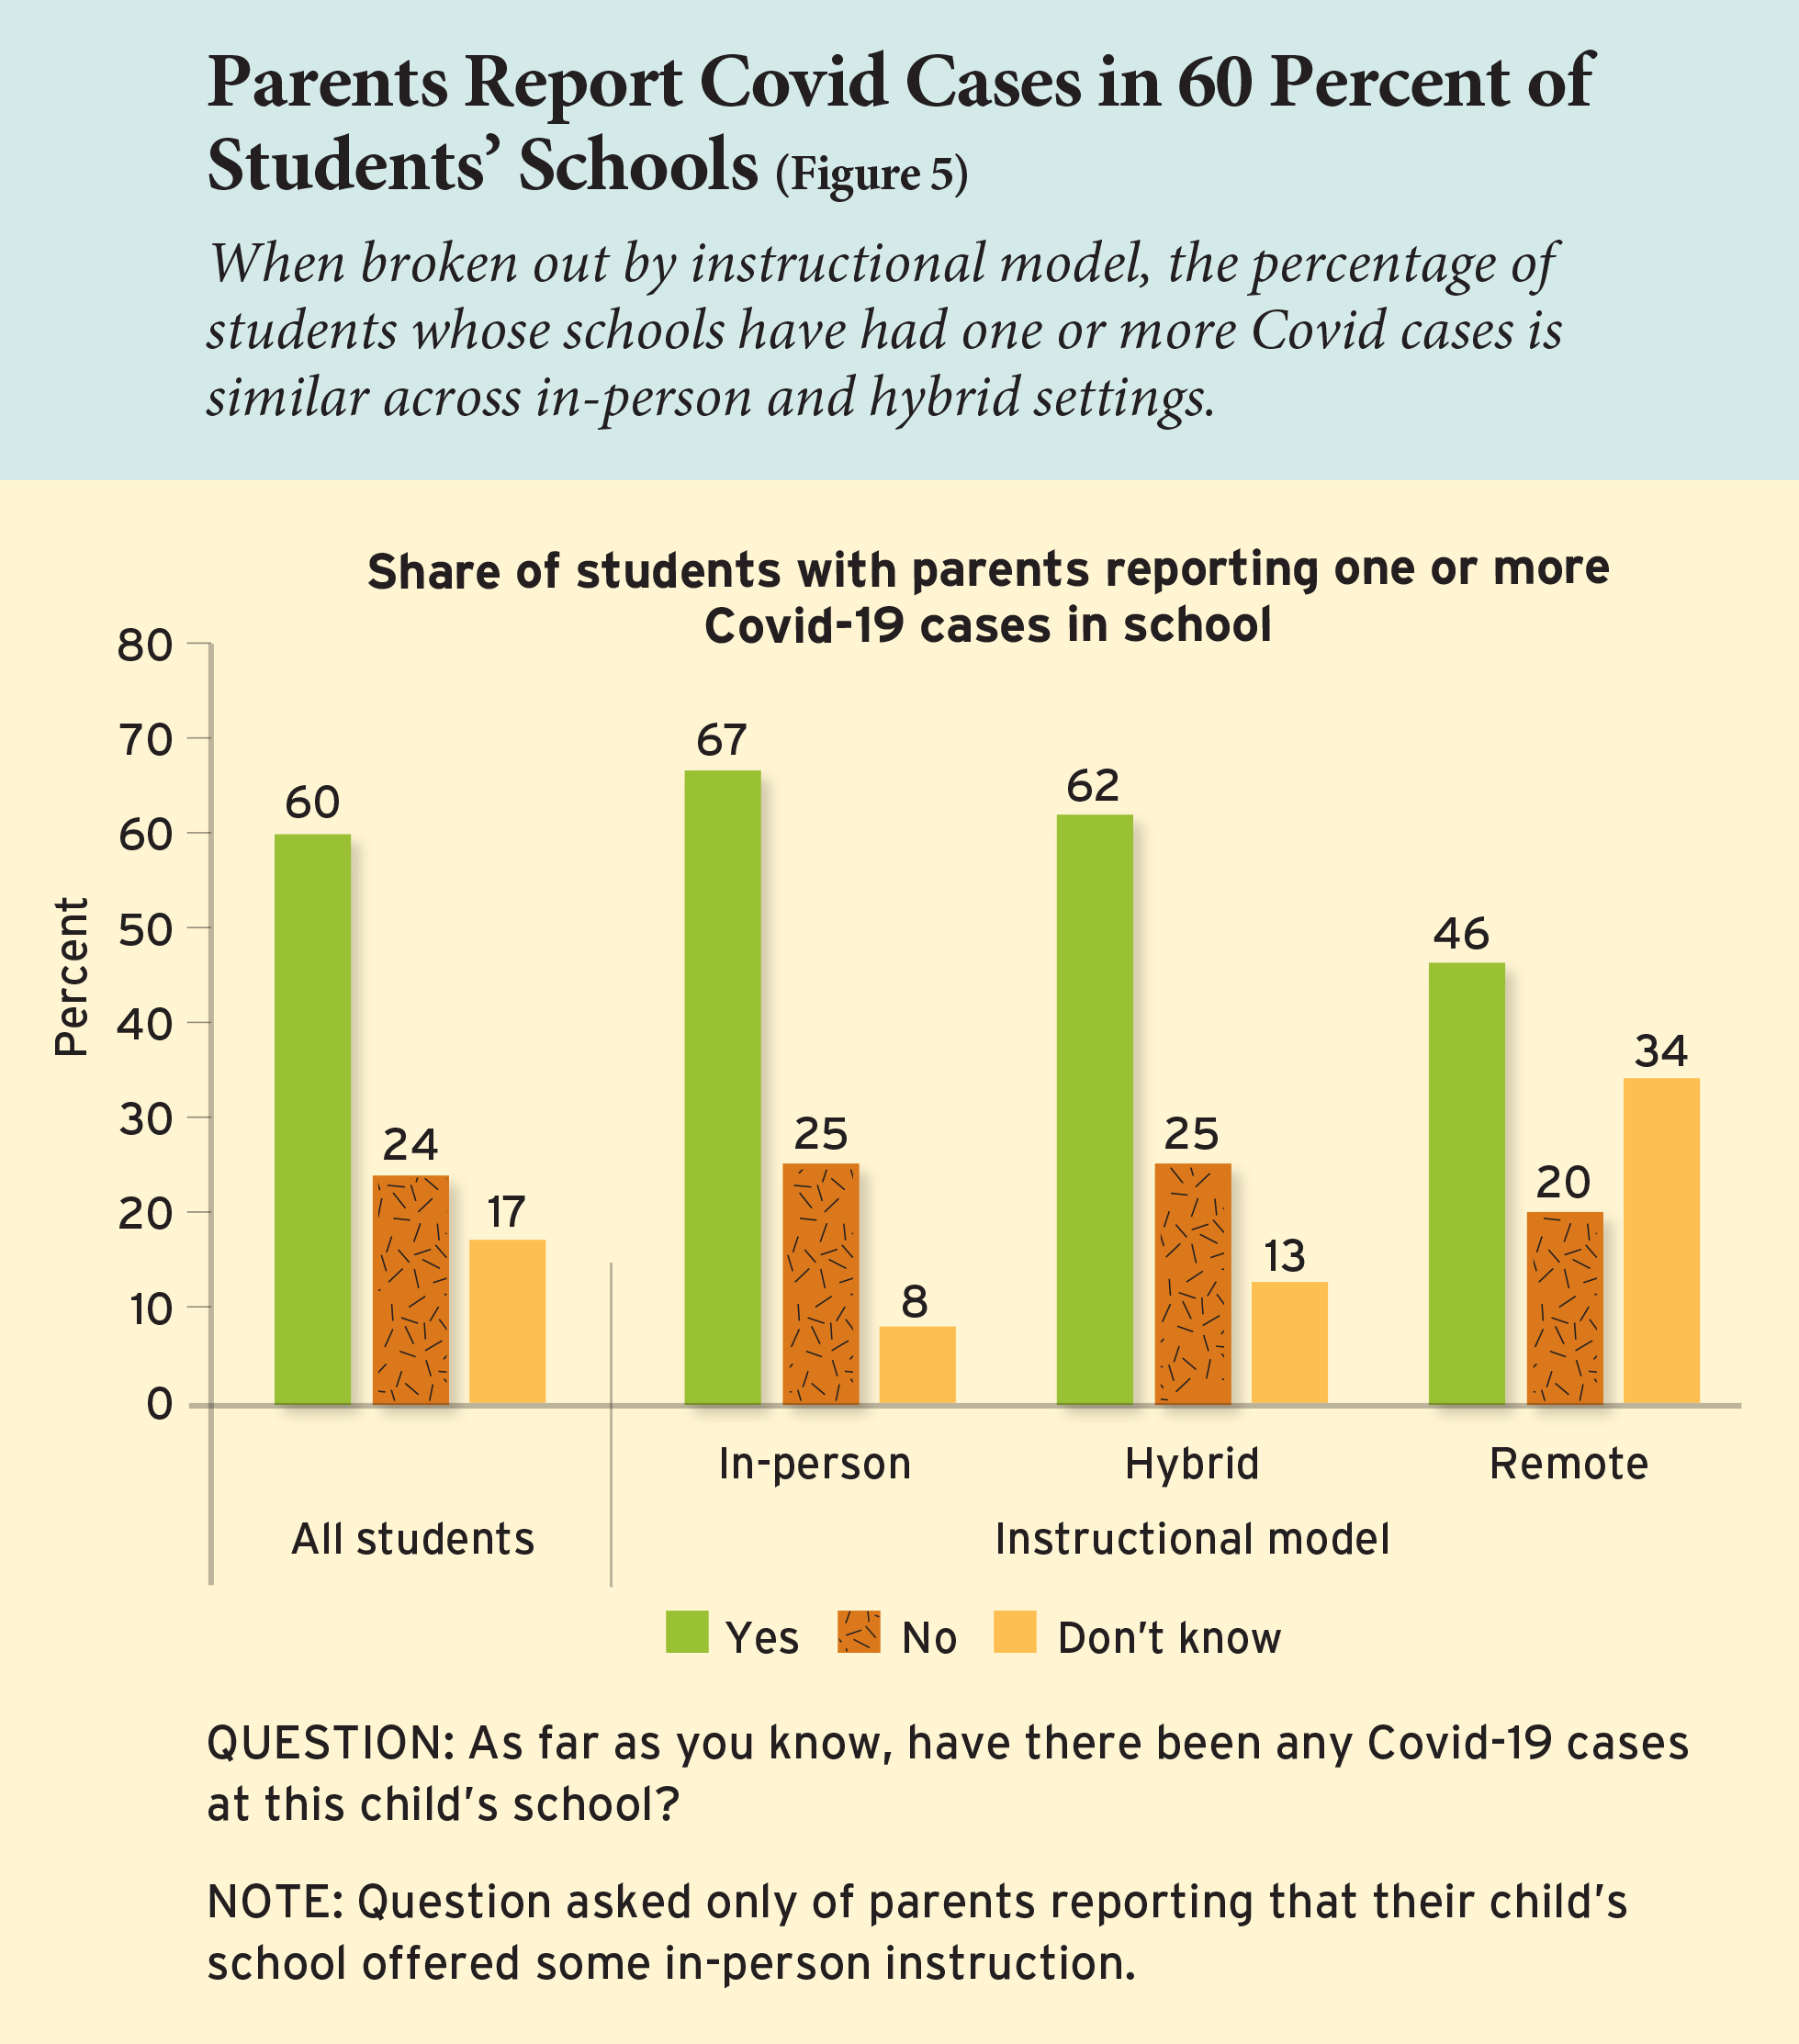
Covid cases in schools. By the time parents responded to this survey in November 2020, the fall surge in Covid cases was well underway. Parents of 60% of students respond affirmatively when asked if “there have been any Covid-19 cases” at their child’s school. The affirmative response is lower, at 46%, among parents of students taught remotely. (Parents of fully remote students answered this question only if their child’s school allowed some in-person instruction for any students attending the school.) More noteworthy is the similarity of the percentages for in-person and hybrid instruction: parents of 67% of students taught in person and 62% of those taught in the hybrid mode report Covid presence at their school (see Figure 5).
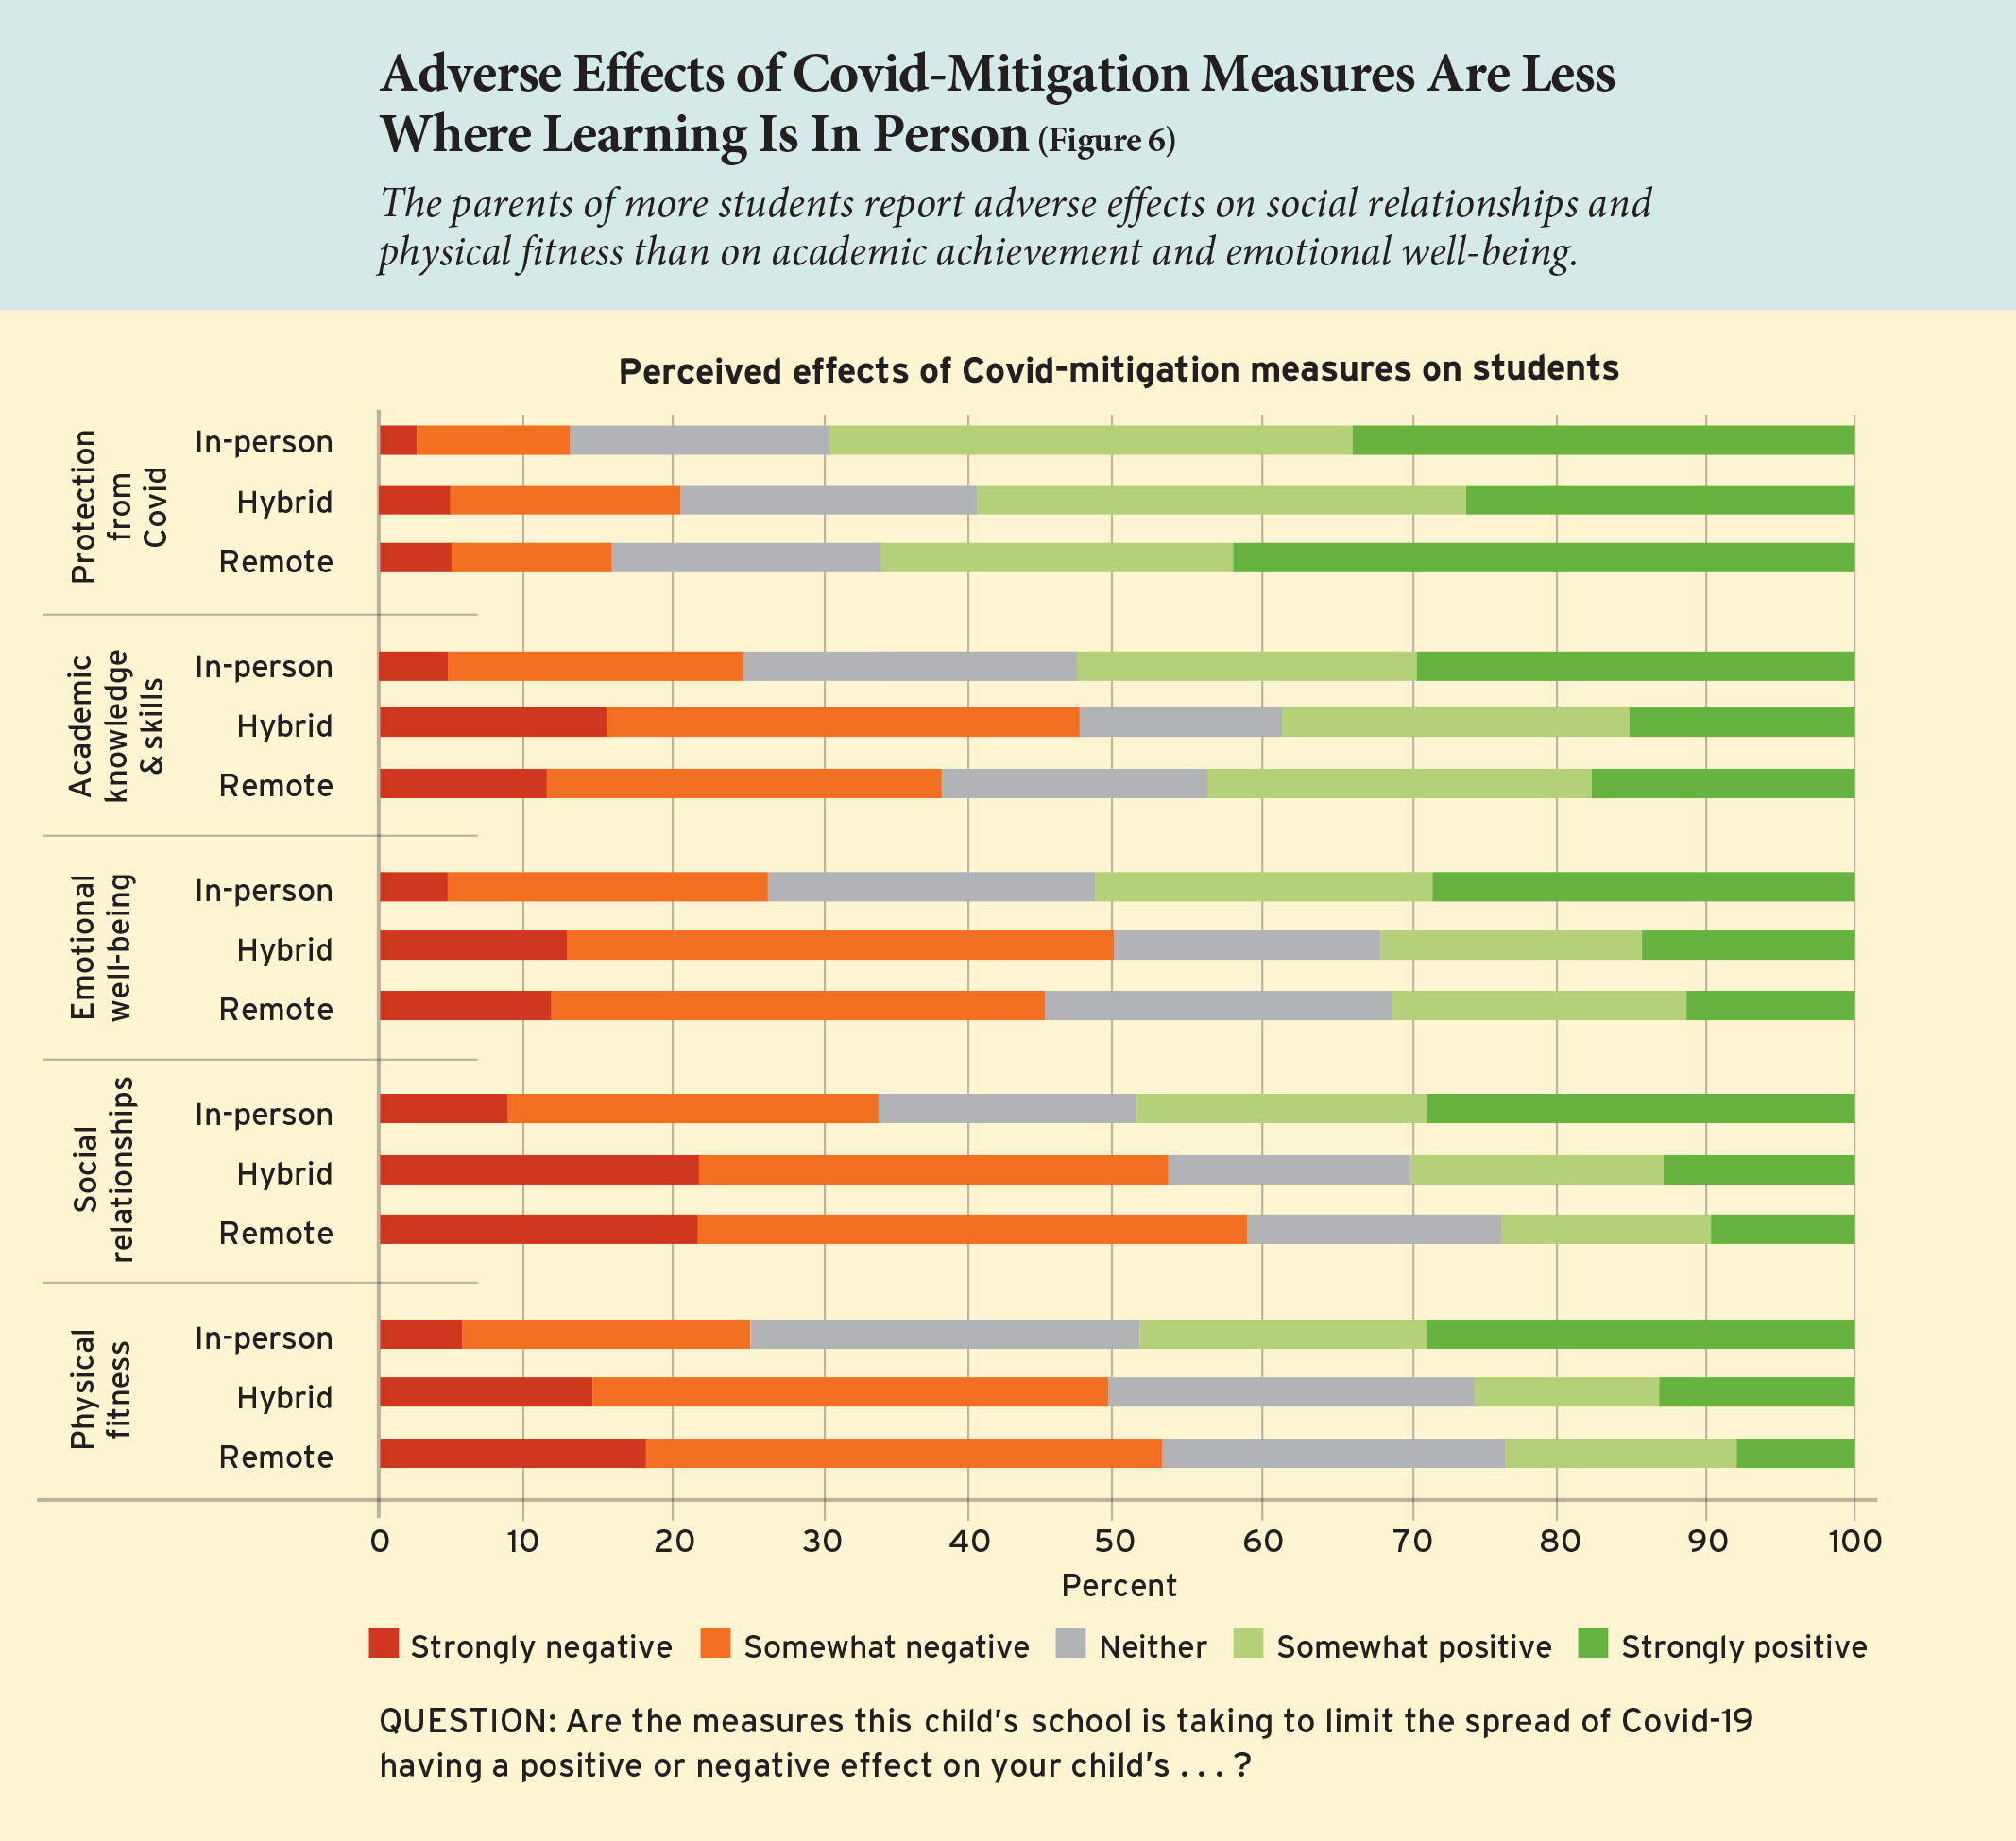
Effects on students. We asked parents a series of questions about how “the measures this child’s school is taking to limit the spread of Covid-19” are affecting various aspects of the child’s development, starting with protection from the virus itself (see Figure 6). Despite the large share of schools where one or more Covid cases have been detected, parents are generally upbeat in their assessments: parents of 66% of the children say the schools’ actions have a positive effect on their child’s “protection from Covid-19,” while parents of only 15% of them say the actions are having a negative impact, with the remainder taking a neutral position (“neither positive nor negative”). The hybrid model receives the weakest endorsement. Parents of only 59% of the children experiencing hybrid instruction give a thumbs up, while parents of 69% and 66% of those in the in-person and remote modes, respectively, give a positive response. Movement back and forth between modes may heighten parental anxieties.
When asked if the measures taken to limit Covid’s spread have had a positive or negative effect on their child’s “academic knowledge and skills,” parents’ responses are marginally more positive than negative. For a surprisingly large percentage of children—46%—parents say these measures are having a positive effect. The frequency of negative reports varies by instructional mode. For those taught in person, only 25% are said to be having a negative experience, while that is the case for 38% of those learning remotely and for an even higher share—48%—of those in the hybrid mode.
Parents’ assessments of how these same measures are affecting their children’s “emotional well-being” are fairly evenly balanced between positive and negative. The parents of 37% of students say the policies are having a positive effect, while for 41% parents say the effect is negative. This, too, varies, with mode of instruction. Parents of only 26% of the students taught in person report negative impacts, but that percentage rises to 45% for those taught remotely and 50% for those in the hybrid mode.
Parents’ assessments of the effects of Covid-mitigation measures on their children’s “social relationships” are more negative. Overall, parents of 32% of students say the measures are having a positive effect, considerably less than the 51% of children whose parents observe a negative effect. Once again, reported effects vary by mode. For only 34% of the students receiving in-person instruction do parents report negative impacts on social relationships, but that percentage climbs to 59% among students taught remotely and to 54% for those taught in the hybrid model.
Perceived effects on students’ “physical fitness” are also more negative than positive. Parents of 31% of students report positive impacts, while for 44% the impacts are said to be negative. Parents of only 25% of students receiving in-person instruction say the policies are having a negative effect on physical fitness, but parents report negative impacts for 53% and 50%, respectively, of those taught fully remotely or in the hybrid model.
In sum, according to parents’ survey responses, the measures taken by schools to prevent spread of the virus are having the least negative impact on academic knowledge and skills and on emotional well-being. They are having a greater effect on children’s social relationships and physical fitness. Across all five domains of students’ well-being, the least negative impacts are reported for those children attending school in the traditional in-person manner. The hybrid model seems to offer little, if any, advantage over fully remote instruction.
Overall assessment. When parents are asked to sum up their child’s experiences, two different stories emerge, depending on the question posed. On one hand, parents seem quite satisfied with how schools have responded to the pandemic. On the other, they report less learning than would have occurred in its absence. The one constant is the more-favorable assessment from parents whose children are always taught at school.
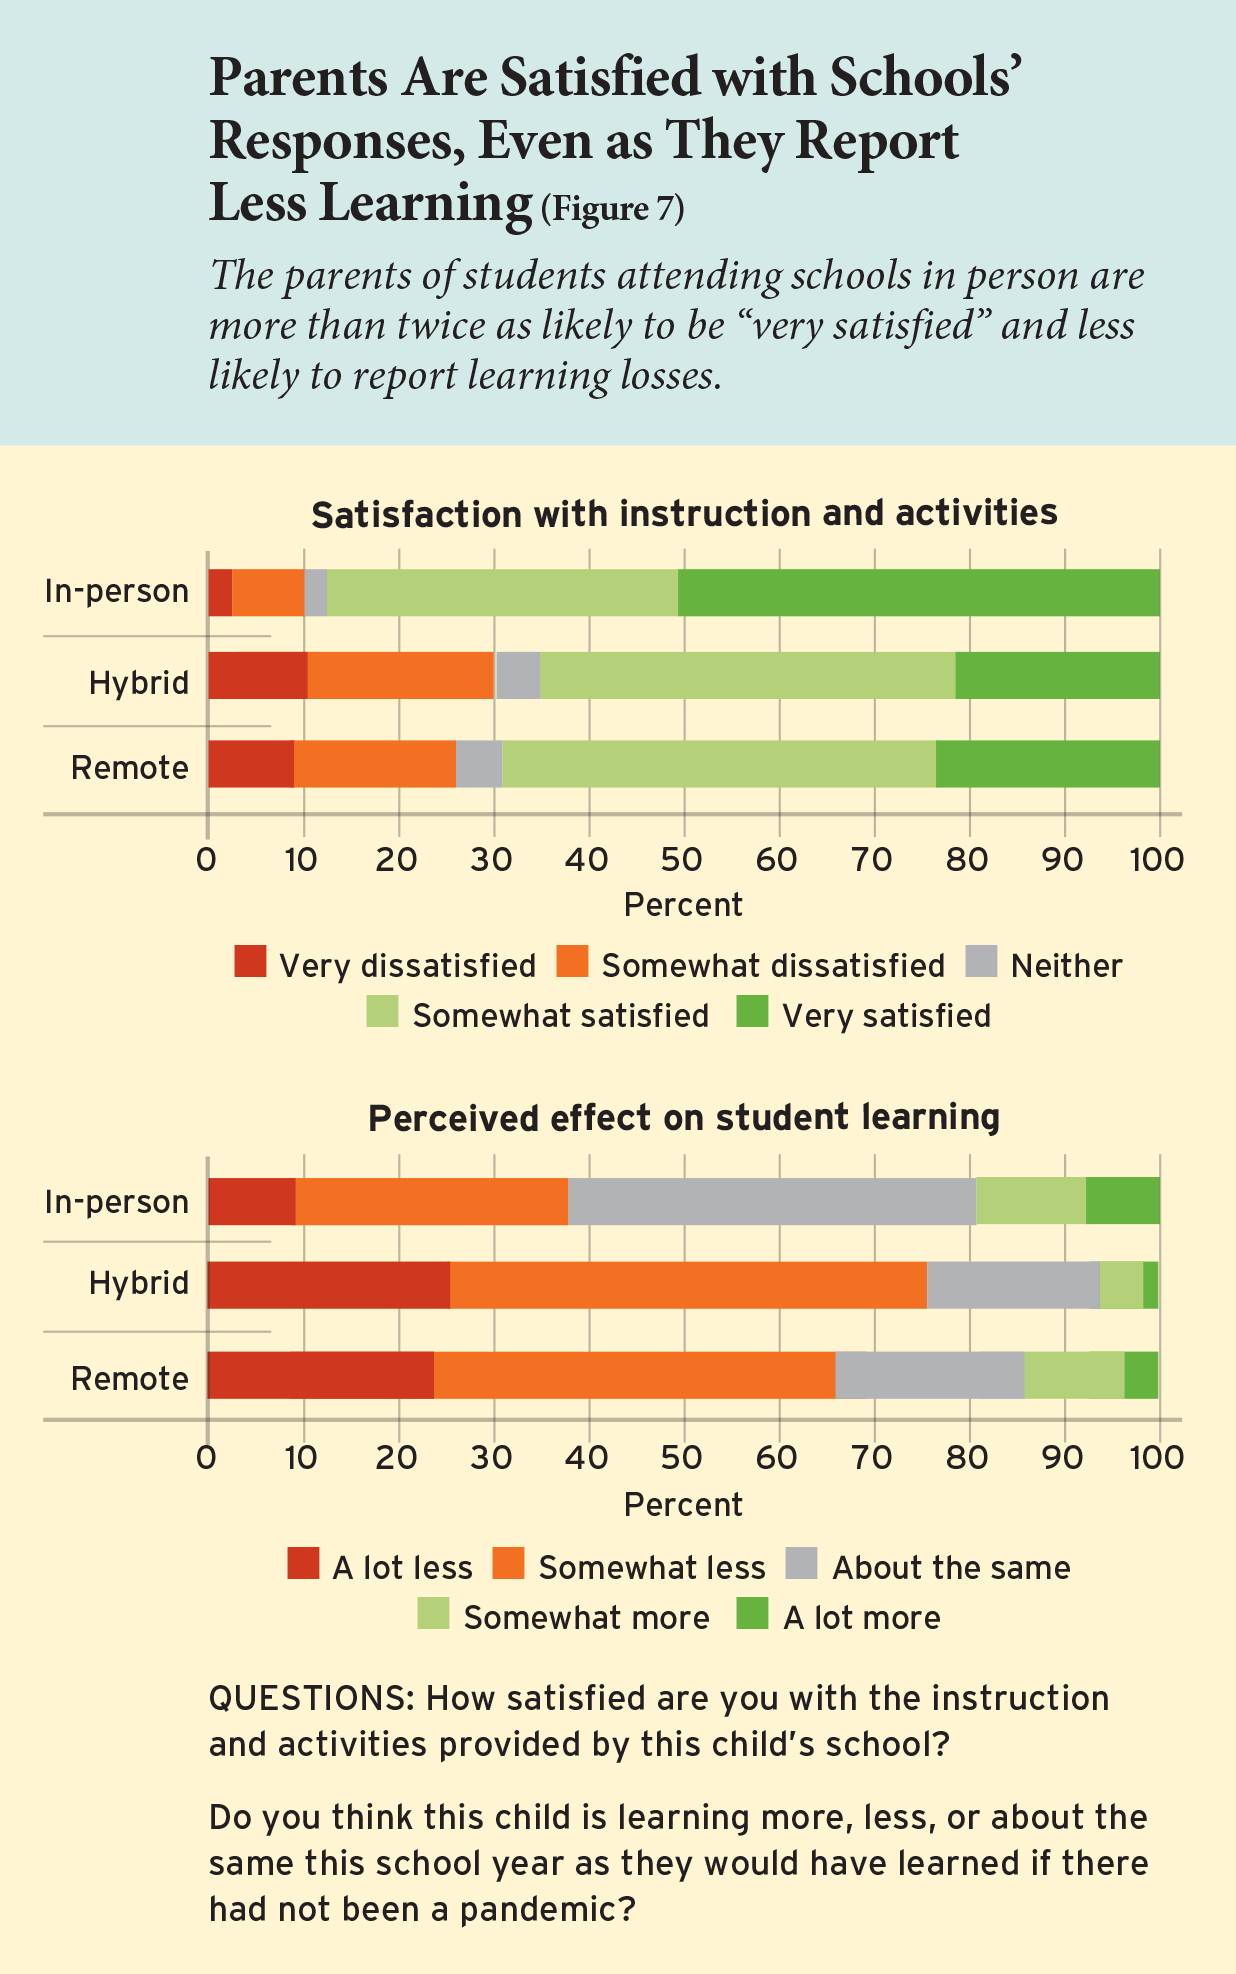
Parents of 74% of students say they are satisfied “with the instruction and activities provided” for their child, and the parents of only 23% express dissatisfaction. But that ringing endorsement obscures the much more frequent expressions of high satisfaction among those whose children are taught in person. Parents of 51% of students who attend school as usual say they are “very satisfied,” while parents of only 23% of the students taught remotely, and parents of only 21% of students undergoing a hybrid education, give the experience the same high rating. Extreme dissatisfaction is also noticeably less among those being educated in the classroom. Parents of only 3% of in-person students give this response, while parents of 9% and 11% of students taught remotely or in the hybrid condition, respectively, say they are very dissatisfied with the situation (see Figure 7).
When asked about learning so far this school year, parents’ answers provide a more dismal picture. Parents of 60% of students say that their child is learning less than “they would have learned if there had not been a pandemic,” with parents of just 26% of students indicating they are learning about the same and parents of only 14% of students saying they are learning more than usual. The picture is especially disconcerting for those in the hybrid model: parents of 75% of such students say they are learning less. Fully remote students are only somewhat better off: parents of 66% of these students say they are learning less. Meanwhile, just 38% of the students being taught as usual are said to be learning less. The percentage of students said to be learning “a lot less” rather than “somewhat less” is also concentrated among those in the hybrid and fully remote models. Roughly one in four students learning under either of these two conditions is said to be suffering “a lot” educationally, as compared to only 9% of those being taught in person.
In sum, the new forms of schooling invented in response to Covid have yet to win the endorsement of American parents. Both the remote and hybrid formats garner less satisfaction and more reported learning loss than instruction that is entirely in person. Across all three models, reports of adverse effects are greater on children’s social relationships and physical fitness than on academic learning and emotional well-being. But these reported adverse effects are all more extensive in remote and hybrid settings.
Comparing District, Private, and Charter Schools
By oversampling parents of children attending private and charter schools, the Education Next survey provides a unique opportunity to assess educational practices in fall 2020 across the three major sectors in American education. The results reveal marked differences across sectors in children’s experiences, as perceived by their parents. If children are enrolled in a private school, they are more likely to be attending in person than are their public-school counterparts. Their parents are more likely to be “very satisfied” with the educational experience, and they are less likely to say their child is learning less than would be expected under the usual schooling conditions. By comparison, children enrolled in a public school, regardless of whether it is a charter or run by a district, are more likely to be learning remotely. Their parents are more likely to report adverse effects on their social relationships and physical fitness. Other differences are less substantial.
While our data are not definitive, we also see signs of migration of students away from district schools toward private schools, charter schools, and homeschooling. Whether that trend will persist once schools return to normalcy remains unknown.
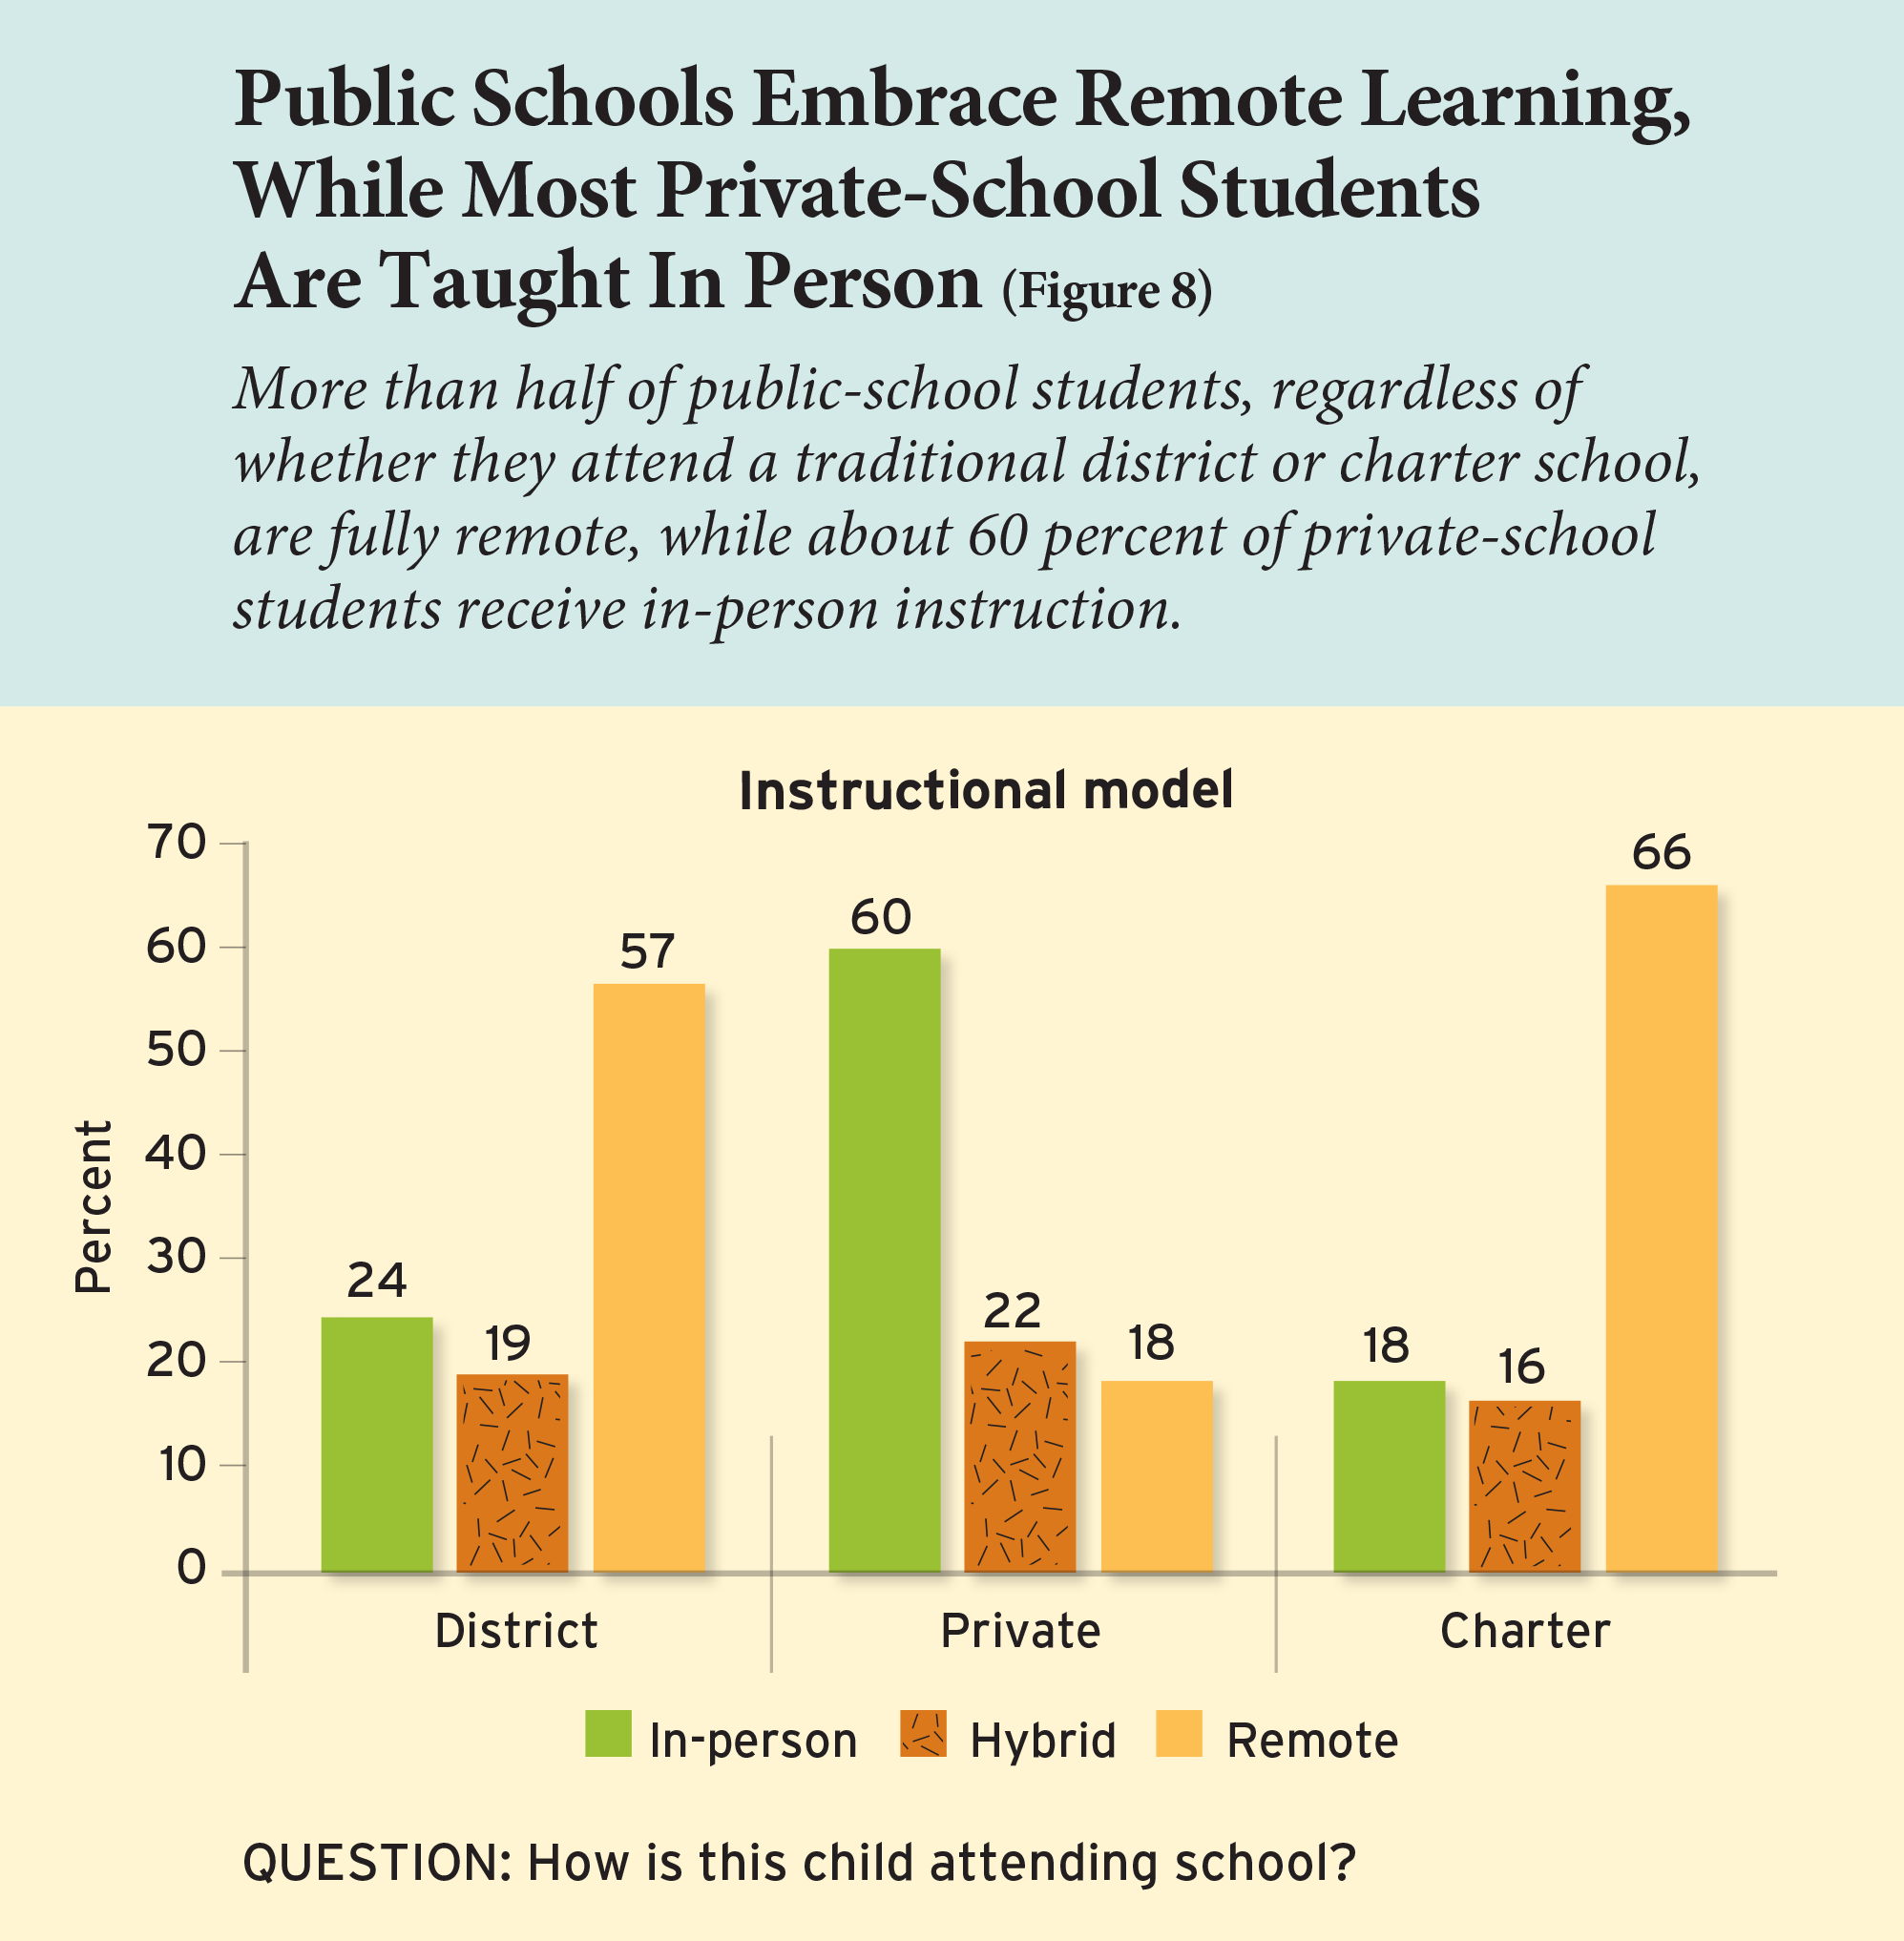
Mode of instruction. Well over half—57%—of students enrolled in district schools receive all their instruction remotely. Another 19% split their time between in-person and remote learning in the hybrid model (see Figure 8). Although parents of nearly three-fourths of the district students said they can choose among options, only 37% have the option for their children to attend in person full time and only 24% receive all of their instruction in person.
Students enrolled in charter schools are even less likely to enter a school building. The parents of 66% report that they are fully remote, 16% hybrid, and 18% in person full time. In the charter sector, parents of 61% of students say they have a choice among more than one option, but the parents of only 35% say they can send their children off to school every day.
The percentages are nearly reversed for children attending private schools. Sixty percent receive instruction in person, 22% have hybrid instruction, and just 18% receive their instruction at a distance. The parents of nearly 70% of private-school students say they have a choice, but in this case the choice includes full-time in-person instruction for 67%. All but 10% of private-school students with that opportunity are taking advantage of it.
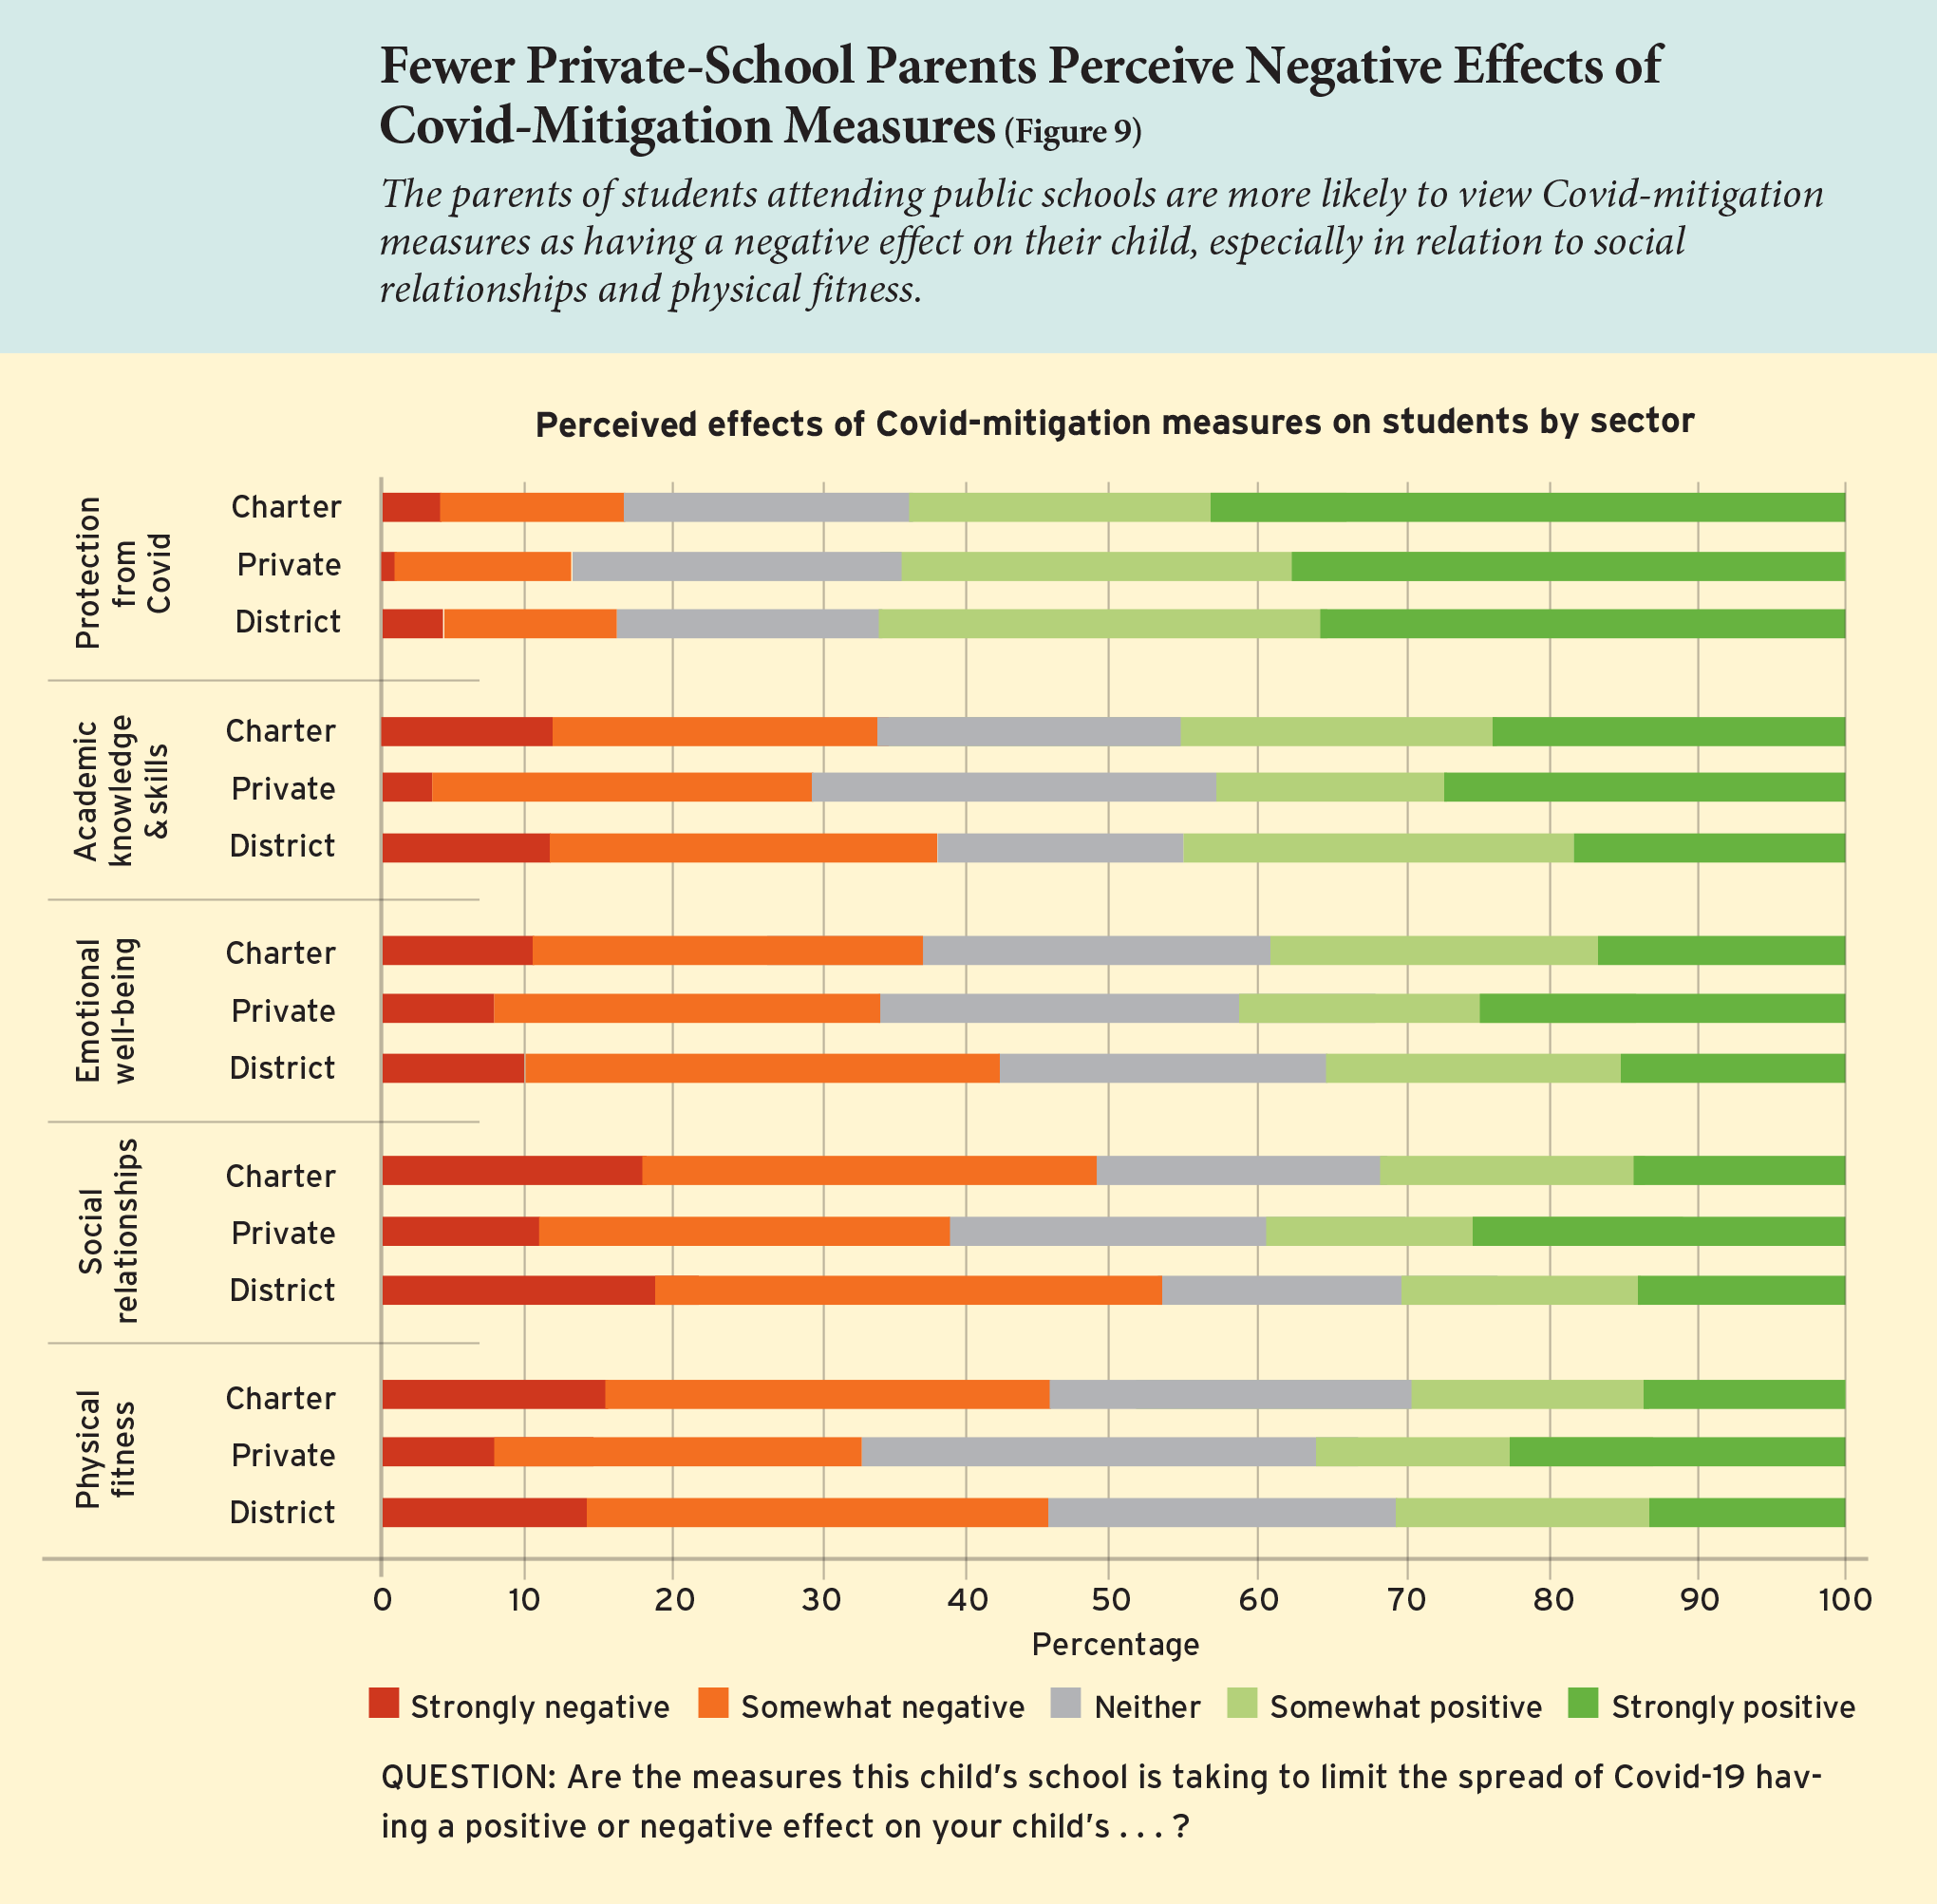
Protection from Covid. Parents of 63% of the students at hybrid and fully open private schools say yes when asked if any cases of coronavirus have occurred at their school, similar to the 59% and 57% of children attending district and charter schools, respectively. Perhaps for that reason, private schools, despite the greater intensity of in-person instruction, are not any more frequently criticized than the other sectors for insufficient efforts to contain the spread of the virus. The parents of only 17% of district and charter students think the school is having a negative impact on their child’s protection from Covid-19; for students at private schools, the percentage is comparable at 13% (see Figure 9). Parents of more than 80% of students in all three sectors say their child’s school is doing “about the right amount” to limit the spread of infections. The remainder of critical parents divide about equally between those who think the schools are doing too much and too little. The generally high parental assessments may reflect the fact that, in all three sectors, 90 percent or more of the schools offering any amount of in-person instruction require masks to be worn when it is taking place.
Effects on students. Only modest sector differences are observed when parents are asked about the effects of Covid-related practices on students’ academic knowledge and skills. Negative effects are reported by the parents of 38% of district students, 34% of charter students, and 30% of private-school students. When it comes to the emotional well-being of their child, a similar pattern appears: the parents of 42% of district students, 37% of charter students, and 34% of private-school students report negative effects. We detect larger differences when we inquire about effects on children’s social relationships. Here the parents of 53% of the district students and 49% of the charter students report negative impacts, but for just 39% of the private-school students do parents express concern. Effects on physical fitness also differ significantly by sector: negative effects are perceived by parents of 45% of district students, 46% of charter students, but only 33% of private-school students (see Figure 9).
Remote instruction in each sector. Once the decision is made to educate students by remote instruction only, one finds little difference in practices across sectors. The private sector shows no greater, and possibly lesser, engagement with students than the other two sectors. In all three sectors, parents of 84% or more of students attending fully remotely say the “child’s school or the teachers” meets with the whole class in some way several times a week. In this regard, the private sector lags the other two sectors (84% as compared to 92% for district students and 89% for charter students). But there is little difference in the frequency with which the child’s school or its teachers meets “with their child one on one.” For about a third of the children in all three sectors, parents say such meetings happen several times a week or more frequently. Similarly, 93% of the remotely taught students in the district sector are assigned work several times a week or more frequently, as are 88% of charter students and 84% of private-school students. Grading practices are more varied across the three sectors: 73% of the remotely taught district students and 73% of such charter students are being given “grades or other feedback on completed assignments” several times a week or more frequently, as compared to 55% of remotely taught students in the private sector. In general, the schools in the private sector that rely strictly on remote learning seem to be modestly less engaged with their students than those in the other two sectors.
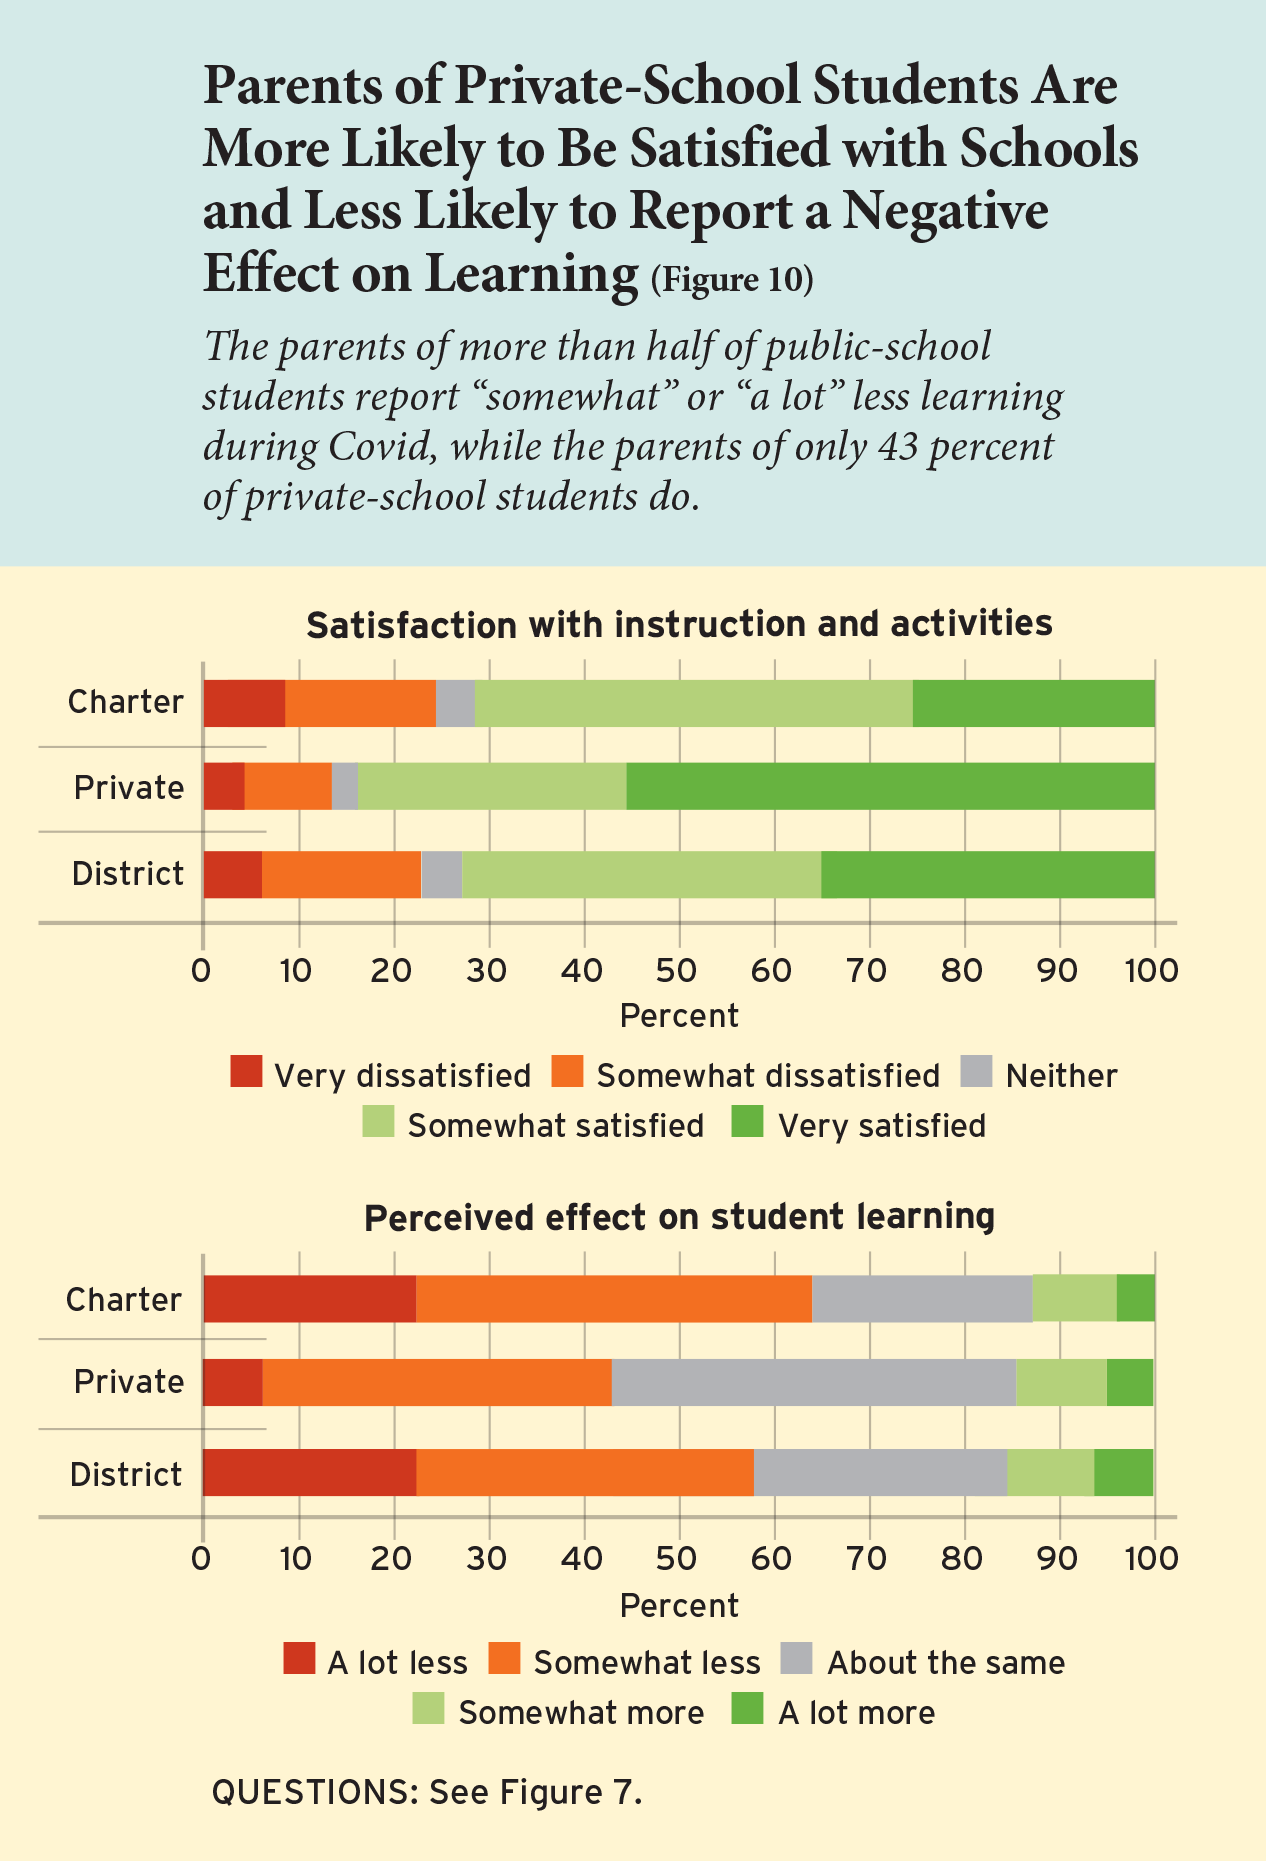
Overall assessment. Regardless of sector, parents are relatively content with their child’s educational experience. Parents of 71% of district students, 73% of charter students, and 83% of private-school students are either somewhat satisfied or very much so. Still, parents of private-school students are most likely to be “very satisfied”: 55% give this response, as compared to just 25% of district parents and 35% of charter parents (see Figure 10).
Parents of students at private schools are also less likely to report learning losses due to the pandemic. Parents of 64% of district students and 58% of charter students, but just 43% of private-school students, say their child is learning “somewhat less” or “a lot less.” A “lot less” learning is reported by about a fifth of the parents of both district and charter students but only 6% of those in private schools.
Changing schools. Are differences across sectors in response to Covid affecting parents’ choices about the school their child attends? To find out, we asked parents whether their child had attended the same school the previous year. Their responses indicate that 22% of students are attending a new school. When asked why they had made the switch, parents had the option of selecting more than one reason, since families often consider multiple factors when making such decisions. About half (47%) of those new to a district school had moved at least in part because the grade the child was entering was not available at the old school (as in transitions to middle and high school). Parents of students new to charter and private schools gave this reason less frequently, probably because in these two sectors there is often only one transition—from 8th grade to high school. Change of residence was another common reason for changing schools. That was the case for 19% of students new to a district school, 11% of new charter students, and 15% of new private-school students.
A substantial amount of the movement to new schools therefore has nothing to do with Covid. Nonetheless, 10% of students new to a private school and 14% of students new to a charter school are said by their parents to have switched due to dissatisfaction with their prior schools’ responses to Covid. Parents of only 5% of students in a new district school give this reason. Dissatisfaction with another aspect of the child’s former school is given as the reason for the change by parents of 32% of private-school students, 19% of charter students, and 21% of district students. According to parents, nearly half (48%) of the children who are being taught at home this year were not homeschooled the previous year. Of these, the parents of 61% say that dissatisfaction with the previous school’s response to Covid was a factor in their decision to change.
To see if these reports on school changes are reflected in shifts in enrollment across sectors, we estimate the share of students in our nationally representative sample attending schools in the four sectors (district, charter, private, and homeschooling) in the fall of 2020, as compared to the share in each sector in the spring. Both estimates are subject to sampling error, so any conclusion from this analysis is necessarily tentative. As well, parents of 6% of students did not answer our question about the type of school the child attends, up from a 1% refusal rate in the spring, perhaps reflecting confusion among some parents as to the type of school their child is attending during this unusual year. To avoid exaggerating movement across sectors, we assume that all children of parents who did not answer this question are in the dominant district sector.
The data on changes in the size of the four sectors between spring and fall 2020 nonetheless suggest that incremental shifts away from the district sector may be occurring. The share of all students reported by parents to be attending schools in the district sector has declined by 9 percentage points (from 81% to 72%) between the spring and fall of 2020. While district enrollments have fallen, enrollments in other sectors appear to have increased—though the latter changes are too small to be statistically significant on their own. Private-sector enrollments identified in the survey have increased by 3 percentage points (from 8% to 11%) from spring to fall, charter enrollments have increased by 3 percentage points (from 5% to 8%), and the share of students whose parents say they are being schooled at home has increased by 2 percentage points (from 6% to 8%).
These results need to be confirmed by administrative data collected by the U.S. Department of Education on school enrollments by sector. But they may be an early indicator of small but important changes in enrollment patterns during the pandemic. Whether those changes will persist after the pandemic comes to an end is, of course, a question that is of great interest to school officials in all sectors of American education.
Michael B. Henderson is assistant professor at Louisiana State University’s Manship School of Mass Communication and director of its Public Policy Research Lab. Paul E. Peterson is the Henry Lee Shattuck Professor of Government at Harvard University, director of Harvard’s Program on Education Policy and Governance (PEPG), and senior editor of Education Next. Martin R. West is the William Henry Bloomberg Professor of Education at Harvard University, deputy director of PEPG, and editor-in-chief of Education Next.
Gauging the Pandemic’s Effects on Parental Opinion
Are parents’ experiences with their children’s schooling amid the pandemic affecting their views on American education? To find out, we posed several survey questions that we’ve asked parents in the past, including in May 2020 (when virtually all school buildings were closed) and in prior annual surveys. With one notable exception, the results suggest that the pandemic’s effects on parents’ thinking have been surprisingly muted.
Parents’ openness to online education has increased over the course of the pandemic, accelerating a long-term trend. In 2009, 56% of American parents said they would be willing to have their child take some academic courses online during high school. This share edged up to 61% in 2010 and remained at that level in 2013. In May 2020, however, 73% of parents said they were willing to have their child take some high school courses online. By November 2020, that figure had reached 76%.
We also gauged openness to online education by asking how many courses high school students should be allowed to take online. Typically, students must complete 24 courses in high school to graduate. On average, the parents we surveyed in May 2020 said that high school students should be allowed to take 10.6 courses online, up from 9 courses when we last asked this question in 2017. By November, parents on average said that high school students should be able to take as many as 15.5 courses online. In short, despite their mixed assessment of fully remote instructional models implemented during the pandemic, parents have become more open to allowing online coursework to become a substantial component of students’ educational experiences—at least at the high school level.
At the same time, the pandemic seems, if anything, to have brightened parents’ views of the quality of American public schools. When asked to assess the public schools in their local community, 65% of parents give them an A or a B grade, essentially the same as in May 2020 and up from 60% before the pandemic. Far fewer parents assign such high marks to the nation’s public schools, but the share who do is also modestly higher than before the pandemic. It was 32% in May 2019 and rose to 38% in both May and November 2020.
Parents’ perceptions of the quality of the teachers in their local schools have also edged up slightly since we last inquired about the topic in May 2018. At that time, parents rated 30% of local teachers as “excellent” and 15% as “unsatisfactory.” In our November 2020 survey, parents assessed 35% of teachers as “excellent” and just 12% as “unsatisfactory.” Responses in May 2020 were virtually identical to those in November.
And what about the unions representing those teachers? In many school districts, teachers unions have led the charge against reopening schools in person, effectively forcing leaders to implement a fully remote model. That stance has not led parents to take a more negative view of teachers unions’ influence on schools. Thirty percent of parents say that unions have a negative effect, essentially the same as the 29% and 32% who reported a negative effect in May of 2019 and 2020, respectively. If anything, parents’ views of union influence have grown more favorable since May 2020, with the share saying unions have a positive effect on schools climbing from 40% at that time to 46% in November.
Survey Methodology
The survey was conducted from November 10 to December 3, 2020, by the polling firm Ipsos Public Affairs via its KnowledgePanel®. The KnowledgePanel® is a nationally representative panel of American adults (obtained via address-based sampling techniques) who agree to participate in a limited number of online surveys. Ipsos provides internet access and/or an appropriate device to individuals sampled for its KnowledgePanel® who agree to participate in the panel but lack the technology to do so. For individual surveys, Ipsos samples respondents from the KnowledgePanel®. Respondents could elect to complete this survey in English or Spanish.
The total sample for this survey (2,540 respondents) consists of two overlapping samples. The first sample consists of American parents, stepparents, or foster parents of at least one child living in the respondent’s household who is in a grade from kindergarten through 12th grade. This parent sample includes 2,155 respondents who provided information about at least one child. The parent sample includes oversamples of parents with at least one child in a charter school (303 respondents), parents with at least one child in a private school (397 respondents), Black parents (462 respondents), and Hispanic parents (609 respondents).
The second sample consists of teachers who teach in kindergarten through 12th grade. The teacher sample consists of 547 respondents, including 162 respondents who are both a K–12 teacher and a parent of a K–12 student. Detailed results from the teacher sample are available at www.educationnext.org but are not discussed in this essay.
The completion rate for this survey is 53%.
After initially screening for qualification, we created a roster of the children in kindergarten through 12th grade who live in their household by asking for the grade, gender, race, ethnicity, school type (traditional public school, charter school, private school, or home school), and age for each. We also allowed parents to label each child in the roster with a name or initials if they chose to do so. Parents could refuse to answer specific questions in the creation of this roster, but as long as they provided a name, grade, gender, or age for a specific child then we included questions about that child in the remainder of the survey. In all, the parent sample provided information about 3,762 K–12 students. We asked a series of questions about the schooling experiences during the fall of 2020 for each of these children. After completing these questions about each child individually, parents answered a set of questions about the total amount of time they spent helping all of their children with schoolwork as well as about their attitudes about schools and school policy in the United States.
In this report, we analyze responses to questions about individual children at the child level. We analyze all other questions at the respondent level. For both student-level and parent-level analyses, we use survey weights designed for representativeness of the national population of parents of school age children. For analysis of teachers’ responses, we use survey weights designed for representativeness of the national population of teachers. Differences discussed in the text of this report are statistically significant at the level unless otherwise indicated. For analysis of child-level data, we cluster standard errors by the respondent (that is, parent).
The exact wording of each question is available at www.educationnext.org/edfacts. Percentages reported in the figures and online tables do not always sum to 100, as a result of rounding to the nearest percentage point.
For more, please see “The Top 20 Education Next Articles of 2024.”
This article appeared in the Spring 2021 issue of Education Next. Suggested citation format:
Henderson, M.B., Peterson, P.E., and West, M.R. (2021). Pandemic Parent Survey Finds Perverse Pattern: Students Are More Likely to Be Attending School in Person Where Covid Is Spreading More Rapidly. Education Next, 21(2), 34-49.