Thirty-five of the nation’s 50 largest school districts are opting to educate students remotely this fall, concluding that in-person instruction is either medically or politically too risky or logistically too difficult to execute in the face of the Covid-19 pandemic (Figure 1; Please see the table at the end of this article for specific district information).
Figure 1. Number of Districts Opting for Remote, Multiple, Hybrid, or TBD Fall Start
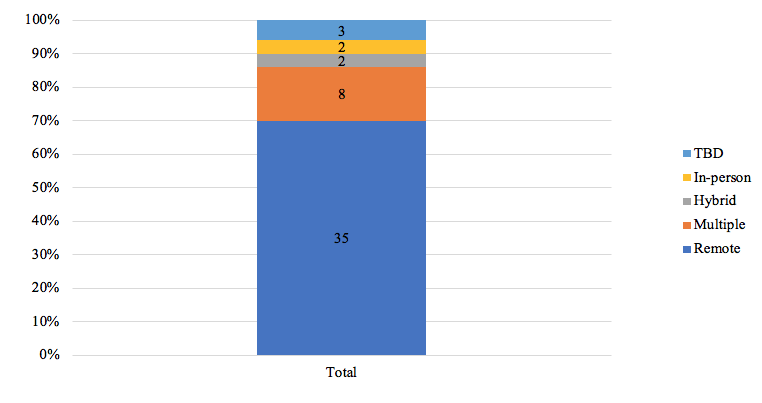
Note: data from author’s review of district public plans, subject to change
The districts opting for remote instruction educate more than five million children (see Figure 2). How long schools remain physically closed to students may vary depending on the district. Districts that are opting for a remote start have expressed a desire to revisit the schedule as early as late August as in Gwinnett County, Georgia, or committed to remote learning until at least the end of January, as in Baltimore County, Maryland.
Figure 2. Number of Students Experiencing Remote, Multiple, Hybrid, or TBD Fall Start
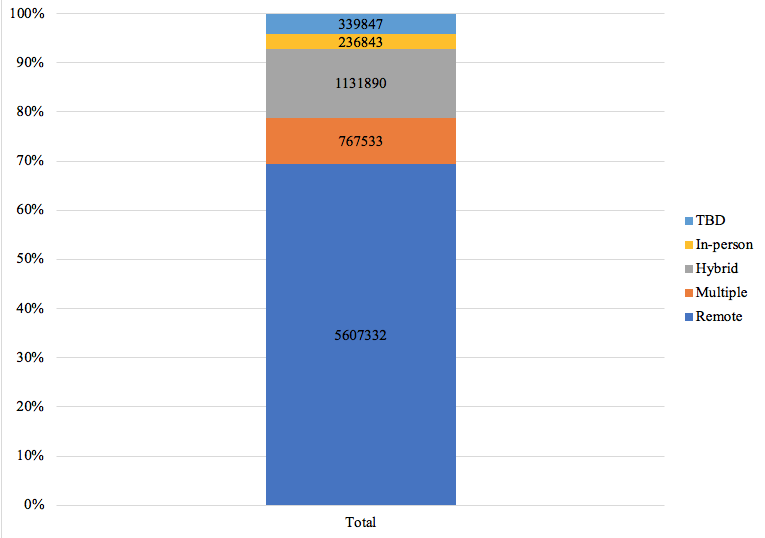
Note: Enrollment Data is from NCES, Fall 2016
Though many districts are opting for remote instruction, the remote school day will still look different for students depending on the district they attend. As one example, Montgomery County Schools, Maryland, provides a detailed overview of what an elementary school student’s day will look like in remote instruction (Figure 3). Some districts have not committed to providing the same instructional hours as would have been provided if school was in-person.
Figure 3. Typical Elementary Day at a Glance, Montgomery County Schools, MD
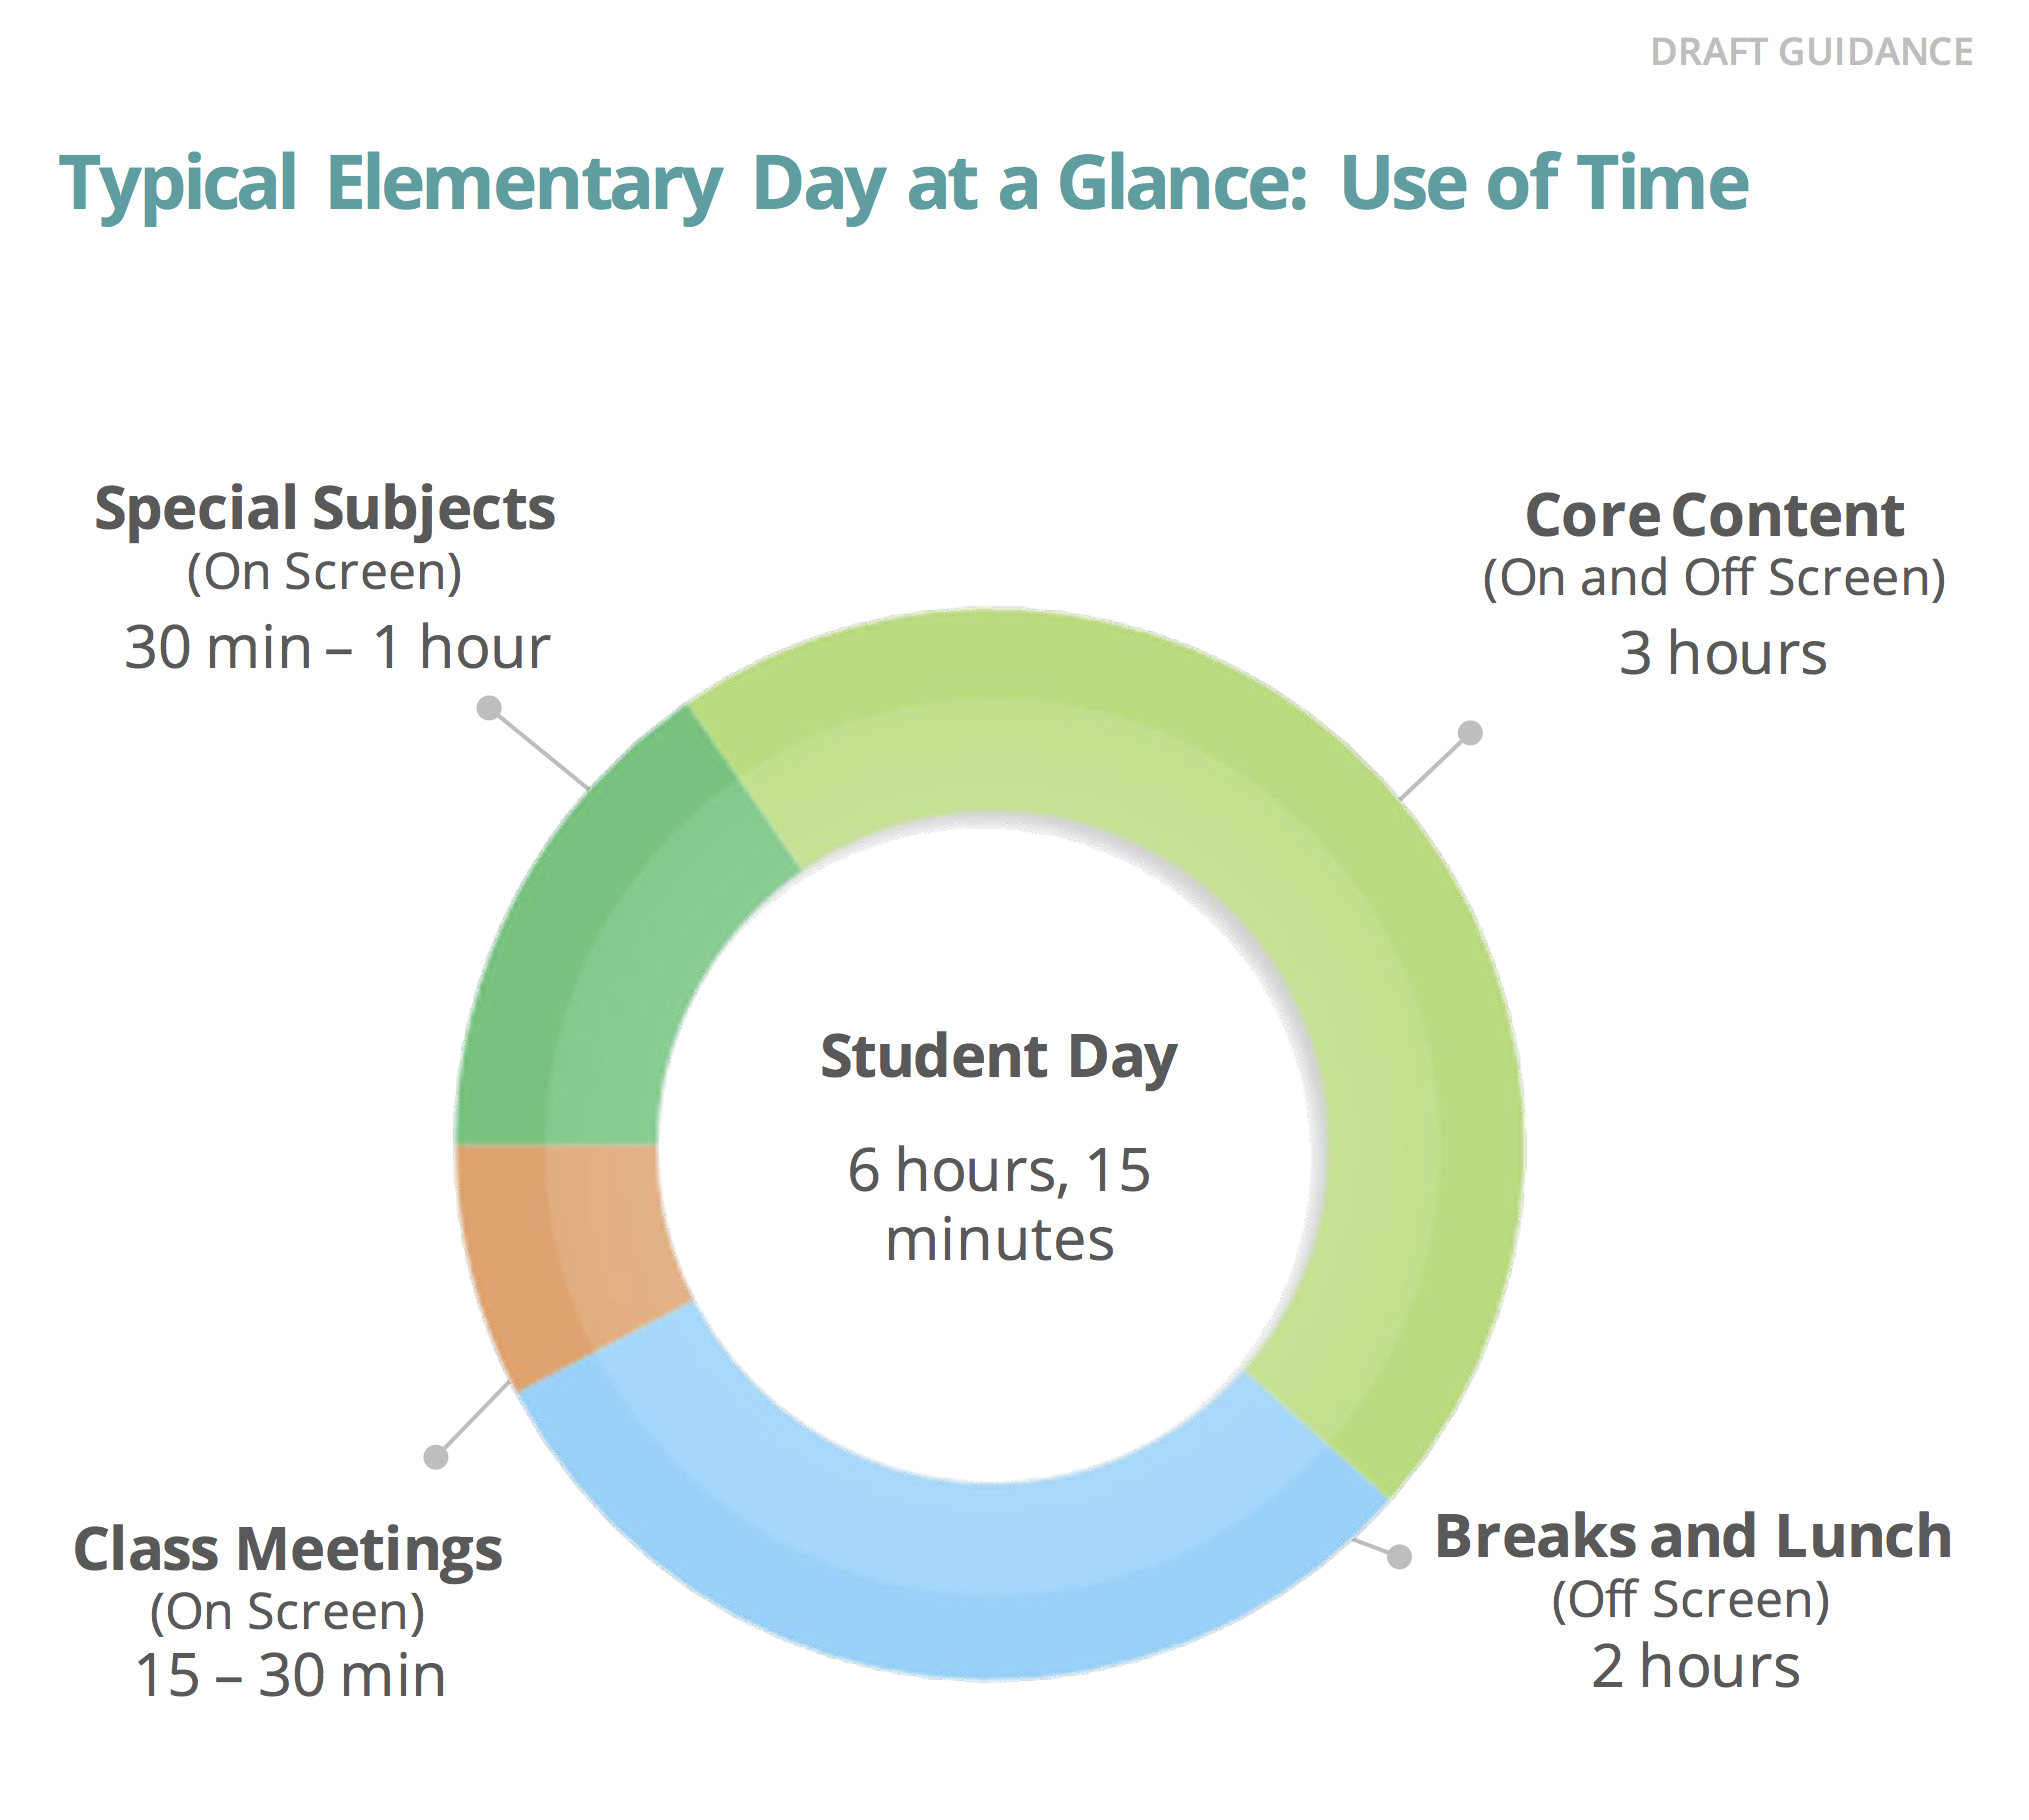
Source: https://www.montgomeryschoolsmd.org/reopening/MCPSDraftRecoveryPlan-updated.pdf
While remote or fully online learning is by far the most common path that the largest districts are taking, a few have chosen in-person learning, hybrid models where students spend some days in school and other days at home, or multiple options that give families a choice between in-person and fully remote learning.
A district pursuing “multiple options” is the Cypress-Fairbanks Independent School District in Texas. Cypress-Fairbanks will offer both on-campus learning and a remote learning option. Both options will follow the same instructional year calendar, grading procedures, and attendance policies, as well as the same curriculum. Pinellas County Schools in Florida is offering three distinct learning options for families to select— “traditional,” “online,” and “virtual.” These options have implications for a student’s ability to remain enrolled in their current school.
Many district plans are still continuing to evolve to provide accommodations for students with disabilities or other specialized needs.
Will School Be In-Person, Hybrid, or Remote? (Scroll to the right for district-by-district info.)
| District | State | Rank order | Enrollment, fall 2016 | 5-to-17-year-old population, 2016 | 5-to-7-year-olds in poverty, 2016\1\ | Poverty rate of 5-to-17-year-olds, 2016\1\ | Total Revenue (in thousands) | Per-Pupil Revenue (in thousands) | State Covid-19 Cases per 100K People (as of 8/6; CDC) https://www.cdc.gov/covid-data-tracker/#cases | Reopening Plan Link | School Start Date | Main Learning Model (Elementary) | Main Learning Model (Middle) | Main Learning Model (High) |
| New York City | NY | 1 | 984,462 | 1,245,611 | 328,553 | 26.4 | $27,448,356 | $27,882 | 1720 | https://www.schools.nyc.gov/school-year-20-21/return-to-school-2020 | 9/5/20 | Hybrid | Hybrid | Hybrid |
| Los Angeles Unified | CA | 2 | 633,621 | 715,436 | 194,823 | 27.2 | 10,329,380 | $16,302 | 1326 | https://achieve.lausd.net/site/default.aspx?PageType=3&DomainID=4&ModuleInstanceID=4466&ViewID=6446EE88-D30C-497E-9316-3F8874B3E108&RenderLoc=0&FlexDataID=91406&PageID=1 | 8/18/20 | Remote | Remote | Remote |
| City of Chicago (SD 299) | IL | 3 | 378,199 | 408,677 | 108,558 | 26.6 | 5,272,668 | $13,942 | 1474 | https://www.cps.edu/school-reopening-2020/ | 9/8/20 | Remote | Remote | Remote |
| Dade | FL | 4 | 357,249 | 394,651 | 93,050 | 23.6 | 3,590,773 | $10,051 | 2334 | http://reopening.dadeschools.net/index.html | 8/24/20 | Remote | Remote | Remote |
| Clark County | NV | 5 | 326,953 | 367,926 | 69,496 | 18.9 | 3,220,684 | $9,851 | 1749 | https://sites.google.com/nv.ccsd.net/distanceeducation/ccsd-resources/reopening-ccsd?authuser=0; https://ccsd.net/schools/back-to-school/distance.php | 8/24/20 | Remote | Remote | Remote |
| Broward | FL | 6 | 271,852 | 295,468 | 48,843 | 16.5 | 2,607,068 | $9,590 | 2334 | https://www.browardschools.com/domain/17754; https://www.browardschools.com/domain/18054 | 8/19/20 | Remote | Remote | Remote |
| Houston ISD | TX | 7 | 216,106 | 248,155 | 76,878 | 31.0 | 2,480,131 | $11,476 | 1602 | https://www.houstonisd.org/reopening | 9/8/20 | Remote | Remote | Remote |
| Hillsborough | FL | 8 | 214,386 | 228,744 | 43,271 | 18.9 | 2,098,358 | $9,788 | 2334 | https://www.sdhc.k12.fl.us/doc/2719/school-reopening-plan/about/openingplan/?utm_source=web&utm_medium=redirect&utm_campaign=reopening | 8/24/20 | Remote | Remote | Remote |
| Orange | FL | 9 | 200,674 | 213,379 | 44,506 | 20.9 | 2,253,016 | $11,227 | 2334 | https://www.ocps.net/cms/One.aspx?portalId=54703&pageId=1455756 | 8/10/20 | Remote | Remote | Remote |
| Palm Beach | FL | 10 | 192,721 | 205,311 | 35,926 | 17.5 | 2,038,576 | $10,578 | 2334 | https://www.palmbeachschools.org/students_parents/reopening_schools | 8/31/20 | Remote | Remote | Remote |
| Fairfax County | VA | 11 | 187,467 | 197,292 | 13,070 | 6.6 | 2,733,933 | $14,584 | 1126 | https://www.fcps.edu/returntoschool | 9/8/20 | Remote | Remote | Remote |
| Hawaii Department of Education |
HI | 12 | 181,550 | 216,481 | 21,877 | 10.1 | 3,030,519 | $16,692 | 183 | http://www.hawaiipublicschools.org/ConnectWithUs/MediaRoom/PressReleases/Pages/school-year-2020-21.aspx | 8/17/20 | TBD | TBD | TBD |
| Gwinnett County | GA | 13 | 178,214 | 185,631 | 28,329 | 15.3 | 1,893,150 | $10,623 | 1918 | http://publish.gwinnett.k12.ga.us/gcps/home/public/home/!ut/p/z1/04_Sj9CPykssy0xPLMnMz0vMAfIjo8zivSxMDDyN_Q08LdxMnA08nczDvP1MQowMnA31wwkpiAJKG-AAjgZA_VFgJbhMsDCAKsBjRkFuhEGmo6IiAORKNuY!/?1dmy&page=gcps.public.home.content&urile=wcm%3Apath%3A%2Fgcps_public_content_enus%2Fpublic_site%2Fschools%2Ffall-2020-in-gwinnett-county-public-schools | 8/12/20 | Remote | Remote | Remote |
| Wake County | NC | 14 | 160,467 | 190,315 | 19,440 | 10.2 | 1,380,356 | $8,602 | 1245 | https://www.wcpss.net/returntocampus | 8/13/20 | Remote | Remote | Remote |
| Montgomery County | MD | 15 | 159,010 | 177,421 | 14,769 | 8.3 | 2,898,647 | $18,229 | 1539 | https://www.montgomeryschoolsmd.org/mainstory/story/671316/Draft-Recovery-Guide/ | 8/31/20 | Remote | Remote | Remote |
| Dallas ISD | TX | 16 | 157,886 | 195,691 | 59,579 | 30.4 | 1,896,322 | $12,011 | 1602 | https://www.dallasisd.org/reentry | 9/8/20 | In-person | In-person | In-person |
| Charlotte-Mecklenburg | NC | 17 | 147,428 | 183,372 | 31,461 | 17.2 | 1,389,280 | $9,423 | 1245 | https://www.cms.k12.nc.us/backtoschool/Pages/default.aspx | 8/17/20 | Hybrid | Hybrid | Hybrid |
| Philadelphia City | PA | 18 | 133,929 | 238,855 | 86,599 | 36.3 | 3,030,964 | $22,631 | 904 | https://www.philasd.org/coronavirus/schoolstart2020/ | 9/2/20 | Remote | Remote | Remote |
| Prince George’s County | MD | 19 | 130,814 | 144,242 | 17,574 | 12.2 | 2,206,548 | $16,868 | 1539 | https://www.pgcps.org/reopen/ | 8/31/20 | Remote | Remote | Remote |
| Duval | FL | 20 | 129,479 | 147,336 | 28,913 | 19.6 | 1,211,671 | $9,358 | 2334 | https://dcps.duvalschools.org/domain/11723 | 8/20/20 | Multiple | Multiple | Multiple |
| San Diego Unified | CA | 21 | 128,040 | 138,882 | 25,011 | 18.0 | 1,790,524 | $13,984 | 1326 | https://www.sandiegounified.org/newscenter/node/2287 | 8/31/20 | Remote | Remote | Remote |
| Cypress-Fairbanks ISD | TX | 22 | 114,868 | 118,190 | 16,982 | 14.4 | 1,175,118 | $10,230 | 1602 | https://www.cfisd.net/en/lead-safely-2020-21 | 9/8/20 | Multiple | Multiple | Multiple |
| Cobb County | GA | 23 | 113,151 | 124,723 | 15,084 | 12.1 | 1,239,449 | $10,954 | 1918 | https://www.cobblearningeverywhere.com/wp-content/uploads/2020/07/Full-Remote-Reopening-Plan.pdf | 8/17/20 | Remote | Remote | Remote |
| Baltimore County | MD | 24 | 112,139 | 130,717 | 13,929 | 10.7 | 1,782,381 | $15,894 | 1539 | https://www.bcps.org/ | 9/8/20 | Remote | Remote | Remote |
| Shelby County | TN | 25 | 111,403 | 132,312 | 44,897 | 33.9 | 1,218,671 | $10,939 | 1685 | http://www.scsk12.org/safeplan/ | 8/31/20 | Remote | Remote | Remote |
| Northside ISD | TX | 26 | 106,145 | 107,911 | 16,239 | 15.0 | 1,118,501 | $10,537 | 1602 | https://www.nisd.net/schools/back-to-school | 8/24/20 | Remote | Remote | Remote |
| Pinellas | FL | 27 | 102,905 | 116,901 | 19,940 | 17.1 | 1,036,722 | $10,075 | 2334 | https://www.pcsb.org/reopening | 8/24/20 | Multiple | Multiple | Multiple |
| Polk | FL | 28 | 102,295 | 110,382 | 26,477 | 24.0 | 962,439 | $9,408 | 2334 | https://polkschoolsfl.com/reopening | 8/24/20 | Multiple | Multiple | Multiple |
| DeKalb County | GA | 29 | 101,284 | 115,181 | 28,144 | 24.4 | 1,194,250 | $11,791 | 1918 | https://www.dekalbschoolsga.org/covid-19/ | 8/17/20 | Remote | Remote | Remote |
| Jefferson County | KY | 30 | 99,813 | 122,586 | 23,365 | 19.1 | 1,323,404 | $13,259 | 733 | https://www.jefferson.kyschools.us/preparing-for-start-school | 8/25/20 | Remote | Remote | Remote |
| Fulton County | GA | 31 | 96,122 | 113,312 | 18,050 | 15.9 | 1,196,919 | $12,452 | 1918 | https://www.fultonschools.org/backtoschool | 8/17/20 | Remote | Remote | Remote |
| Lee | FL | 32 | 92,686 | 96,845 | 19,529 | 20.2 | 929,289 | $10,026 | 2334 | https://www.leeschools.net/parent_portal/covid-19/school_reintroduction | 8/31/20 | Multiple | Multiple | Multiple |
| Denver | CO | 33 | 91,138 | 96,455 | 19,503 | 20.2 | 1,271,873 | $13,955 | 860 | https://www.dpsk12.org/coronavirus/return-2020/ | 8/24/20 | Remote | Remote | Remote |
| Albuquerque | NM | 34 | 90,651 | 112,667 | 23,996 | 21.3 | 1,021,201 | $11,265 | 1029 | https://www.aps.edu/news/2020-2021/aps-reentry-plan | 8/12/20 | Remote | Remote | Remote |
| Prince William County | VA | 35 | 89,345 | 90,603 | 7,770 | 8.6 | 1,110,691 | $12,431 | 1126 | https://www.pwcs.edu/news/what_s_new/preparing_for_the_2020-21_school_year | 9/8/20 | Remote | Remote | Remote |
| Fort Worth ISD | TX | 36 | 87,428 | 94,508 | 28,946 | 30.6 | 963,004 | $11,015 | 1602 | https://www.fwisd.org/forward | 8/8/20 | Remote | Remote | Remote |
| Jefferson County, No R1 | CO | 37 | 86,371 | 86,109 | 6,117 | 7.1 | 929,179 | $10,758 | 860 | https://www.jeffcopublicschools.org/restart_jeffco | 8/24/20 | Remote | Remote | Remote |
| Davidson County | TN | 38 | 85,163 | 98,704 | 22,632 | 22.9 | 1,004,078 | $11,790 | 1685 | https://www.mnps.org/backtoschool | 8/4/20 | Remote | Remote | Remote |
| Austin ISD | TX | 39 | 83,067 | 102,363 | 17,478 | 17.1 | 1,238,622 | $14,911 | 1602 | https://www.austinisd.org/announcements/2020/08/07/sept-8-start-school-las-clases-empiezan-el-8-de-septiembre | 9/8/20 | Remote | Remote | Remote |
| Baltimore City | MD | 40 | 82,354 | 89,009 | 27,470 | 30.9 | 1,420,023 | $17,243 | 1539 | https://www.baltimorecityschools.org/reopening | 9/8/20 | Remote | Remote | Remote |
| Anne Arundel County | MD | 41 | 81,379 | 92,347 | 7,809 | 8.5 | 1,206,658 | $14,828 | 1539 | https://www.aacps.org/fall2020 | 9/8/20 | TBD | TBD | TBD |
| Alpine | UT | 42 | 78,957 | 87,585 | 6,253 | 7.1 | 603,204 | $7,640 | 1363 | https://alpineschools.org/returntolearn/ | 8/18/20 | In-person | In-person | In-person |
| Loudoun County | VA | 43 | 78,348 | 82,840 | 2,610 | 3.2 | 1,089,781 | $13,909 | 1126 | https://www.lcps.org/Page/230986 | 9/8/20 | Remote | Remote | Remote |
| Greenville, 01 | SC | 44 | 76,918 | 86,981 | 12,159 | 14.0 | 855,902 | $11,127 | 1878 | https://www.greenvilleonline.com/story/news/2020/08/04/greenville-county-schools-approves-reopening-plan-based-coronavirus/5572563002/ | 8/17/20 | TBD | TBD | TBD |
| Long Beach Unified | CA | 45 | 76,428 | 84,056 | 19,563 | 23.3 | 1,075,291 | $14,069 | 1326 | https://www.lbschools.net/Departments/Newsroom/article.cfm?articleID=2896 | 9/1/20 | Multiple | Multiple | Multiple |
| Milwaukee | WI | 46 | 76,206 | 110,915 | 37,495 | 33.8 | 1,186,209 | $15,566 | 1051 | https://mymps.org/ | 8/17/20 | Remote | Remote | Remote |
| Katy ISD | TX | 47 | 75,428 | 67,757 | 6,399 | 9.4 | 835,819 | $11,081 | 1602 | http://www.katyisd.org/returntoschool/Pages/default.aspx | 8/19/20 | Multiple | Multiple | Multiple |
| Fort Bend ISD | TX | 48 | 74,146 | 90,019 | 9,879 | 11.0 | 758,885 | $10,235 | 1602 | https://www.fortbendisd.com/2020-21 | 8/17/20 | Remote | Remote | Remote |
| Brevard | FL | 49 | 73,444 | 79,542 | 14,998 | 18.9 | 724,781 | $9,868 | 2334 | https://www.brevardschools.org/Page/17115 | 8/24/20 | Multiple | Multiple | Multiple |
| Fresno Unified | CA | 50 | 73,356 | 80,662 | 34,739 | 43.1 | 998,861 | $13,617 | 1326 | https://www.fresnounified.org/Pages/covid19.aspx#.Xy2iZyhKhjE | 8/17/20 | Remote | Remote | Remote |
\1\Poverty is defined based on the number of persons and related children in the family and their income. For information on poverty thresholds, see https://www.census.gov/data/tables/time-series/demo/income-poverty/historical-poverty-thresholds.html.
\2\Fiscal year 2018 Department of Education funds available for spending by school districts in the 2018-19 school year.
\3\Federal revenue per student is based on fall enrollment collected through the “Local Education Agency (School District) Finance Survey (F33).”
NOTE: Detail may not sum to totals because of rounding. ISD = independent school district
SOURCE: U.S. Department of Education, National Center for Education Statistics, Common Core of Data (CCD), “Local Education Agency Universe Survey,” 2016-17; “Local Education Agency (School District) Finance Survey (F33),” 2015-16; and unpublished Department of Education budget data. U.S. Department of Commerce, Census Bureau, Small Area Income and Poverty Estimates (SAIPE) Program, 2016 Poverty Estimates for School Districts. (This table was prepared May 2019.)
Christopher Cleveland is a Ph.D. candidate at Harvard University.
Read more from Education Next on coronavirus and Covid-19.