Download the unabridged version of this report here.
The high-profile battle in Wisconsin over collective bargaining on public-sector benefits, as well as lower-profile battles in Ohio and Massachusetts, was to a great extent about health insurance costs for teachers. Wisconsin governor Scott Walker anticipated health care savings of $68 million for schools from his legislative proposal; actual savings turned out to be even greater, according to recent estimates. Nationally, school budgets have been hit hard by health-care costs for many years, and the recent fiscal strain has brought this into even greater focus.
Data from the Bureau of Labor Statistics (BLS) show that school district costs for teachers’ health insurance rose at an average annual rate of 4 percent above inflation from 2004 to 2012. In 2004, health insurance costs tacked 11.4 percent onto teacher earnings; in 2012, they added 15.5 percent. At roughly $560 per pupil per year, the national average masks wide variation across states, as districts in some states have relatively low insurance costs while costs borne by districts in other states are quite high. The data do not include health costs for other school employees and retirees, which can be quite substantial.
In this study, we examine BLS data to compare the costs to districts for teacher health insurance with similar costs to private-sector employers. We find that insurance costs for teachers are 26 percent higher than they are for private-sector professionals, and this is partly explained by greater unionization in the public sector. We also examine data newly available from Wisconsin to quantify the impact of that state’s recent change in collective bargaining law: we find a reduction in district costs of 13 to 19 percent, the result of lower-cost policies and higher teacher contributions.
Comparing Employer Costs
We begin with a basic, high-level question: How do employer health care costs for teachers compare with those for private-sector professionals? The most comprehensive national data published on employer costs, the BLS National Compensation Survey (NCS), provide estimates of employer insurance costs on a “per-hour-worked” basis for 180 groups of employees, broken down by occupational groups, industries, ownership (private industry or state and local government), and other characteristics. These data do not separate health from other insurance costs (life and disability) for teachers, but these other components are small (approximately 5 percent of the total), so this does not significantly affect our results.
We focus our comparisons on K–12 teachers and private-sector professionals. Using unpublished data provided to us by the BLS, we multiply the hourly employer insurance costs by the number of hours worked to obtain annual costs for each group of workers. Some 97 percent of K–12 teachers work full-time, while 83 percent of private-sector professionals do so. Because part-time workers are less likely than full-time workers to have health insurance from their employers, we adjust the private-sector comparison data to match the percentage of teachers who work full time.
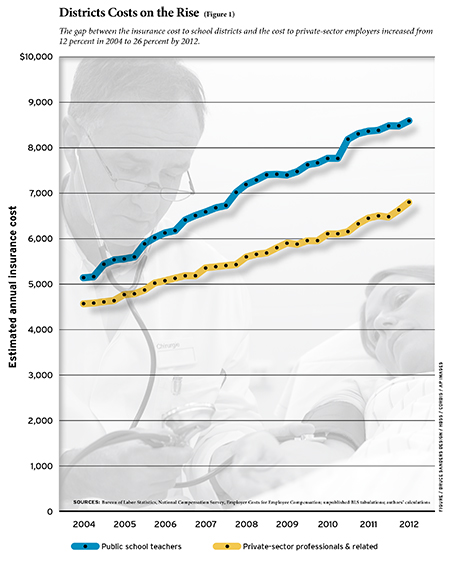
We estimate from these data that the national average of annual employer insurance costs in 2012 was $8,559 for K–12 teachers, and $6,803 for private-sector professionals. The difference between the figures has increased since 2004. Annual employer insurance costs for K–12 teachers rose 67 percent, compared to 49 percent for private professionals. The gap between employer costs was just 12 percent in 2004 but rose to 26 percent by 2012 (see Figure 1).
Our estimates for employer insurance costs average the expenditures across those employees who are covered by an employer’s plan and those who are not. Employees may not be covered either because no plan is offered (an issue for part-time employees in particular) or because the employee chooses not to participate (e.g., because coverage is available through a spouse’s employer). According to the NCS Employee Benefit Survey (EBS), 87 percent of K–12 teachers participate in a health insurance plan (medical, dental, vision, or prescription drug) through their employer, compared to 80 percent of private-sector professionals (our estimate, adjusting for the part-time percentage). Consequently, the difference between teachers and private-sector workers in employer health cost per participating employee is 16 percent ($9,838 vs. $8,492).
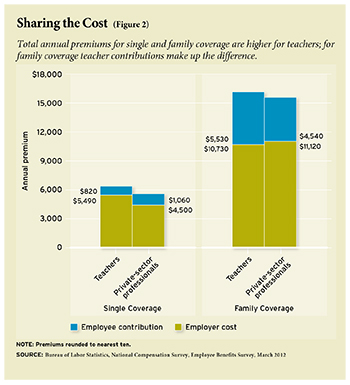
The EBS also collects data on premiums for medical insurance (a slightly narrower category than health insurance). The medical premiums are broken out by single and family coverage, so these data allow us to examine the cost of comparable policies. We find that for single coverage, employer costs for private-sector professionals are 82 percent of those for teachers ($4,496 vs. $5,494), but for family coverage, private-sector costs are 104 percent of those for districts ($11,116 vs. $10,728), slightly higher. This is a notable shift in the last few years. As recently as 2009, the employer cost for single coverage was $1,361 higher for teachers than for private-sector professionals, compared to $998 today, and for family coverage it was $29 higher for teachers instead of $388 lower. This suggests that some school districts have begun to adjust their policies toward private-sector norms.
Employee Contributions and Total Premiums
The EBS data on medical insurance also include information on employee contributions. Together with employer costs, these data indicate that, for both single and family plans, total premiums are higher for teachers than they are for private-sector professionals. For single coverage, teachers pay a smaller share (13 percent) than do private professionals (19 percent). For family coverage, teachers contribute more (34 vs. 29 percent), which is enough to cover the higher cost of their plan. In other words, the total premium for teachers’ family coverage is more expensive than it is for private-sector professionals, but the share coming from teachers more than covers the difference (see Figure 2).
In addition to premiums, employees incur out-of-pocket costs, such as deductibles and co-payments. The EBS data indicate that one reason teachers’ insurance plans are more expensive is that features of the plans (such as lower deductibles) reduce out-of-pocket costs. Although it is accurate to say that teachers pay more to get more in the way of family coverage, it is more precise to state that they pay more up front in premiums and then pay less out-of-pocket.
Union vs. Nonunion Employees
The NCS data allow us to compare medical insurance coverage and premiums for union vs. nonunion workers, where union status is defined by whether the employee belongs to a collective bargaining unit. These breakouts are not available for K–12 teachers or private-sector professionals, but they are available for the state and local government (public) sector and the private sector. The comparisons are still informative because teachers’ health care costs track those of the public sector to some extent.
These data indicate that about 95 percent of union workers have access to employer-provided medical insurance in both the public and private sectors, and their participation rate is essentially the same in both sectors (78 to 79 percent). Nonunion workers are less likely than union workers to participate in a medical plan through their employer, in large part because their employer is less likely to offer them one. The difference from union workers is smaller in the public sector, however, where the nonunion participation rate is 68 percent, compared to 48 percent in the private sector.
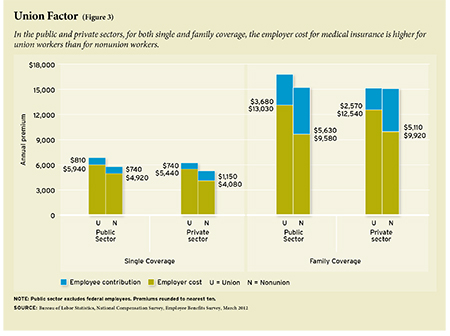
In the public and private sectors, for both single and family coverage, the employer cost is higher for union workers than for nonunion workers. The total premium is significantly higher in all cases except for family coverage in the private sector, where it is about the same for union and nonunion workers. Finally, employee contributions are lower for union workers, except for single coverage in the public sector.
These patterns are the same for the state and local government sector vs. the private sector, with union and nonunion combined: higher employer costs, higher total premiums, and lower employee contributions, for both types of coverage. The unionization rate is higher for the public sector than for the private sector (50 percent vs. 14 percent in the EBS data), suggesting that unionization explains some portion of each of these patterns (see Figure 3).
But these are not the patterns we observed between K–12 teachers and private-sector professionals: they are similar for single coverage but not for family coverage. Whatever impact unionization may have, there are other factors at play.
There is one state in which we have a seemingly natural experiment in changing teacher union strength: Wisconsin. If union strength results in higher employer costs, higher total premiums, and smaller employee contributions, then the removal of teacher health benefits from collective bargaining in Wisconsin might be expected to have the opposite effect: lower employer costs, lower total premiums, and larger employee contributions. This is exactly what happened.
Wisconsin Before and After Act 10
Wisconsin was the first state in the nation with public-sector collective bargaining and has long had one of the nation’s strongest teachers unions. It has also long been a state with very expensive teacher medical insurance. Average district costs in 2011 were $8,311 and $19,356 for single and family coverage, respectively. These costs were about 50 percent and 80 percent higher than the 2011 national averages for teachers, which were $5,500 and $10,723. Although Wisconsin is in a region with higher-than-average medical premiums, this geographic factor accounts for only a minor part of the gap between Wisconsin’s district costs and the national average.
Wisconsin’s high district costs reflected both the choice of expensive plans and low teacher contributions. In 2011, teachers made no contribution at all for single coverage in 43 percent of the state’s districts, nor for family coverage in 31 percent. By comparison, the noncontributory rates in 2011 among teachers in the national data discussed above were 39 percent and 16 percent, respectively. Among private-sector professional employees, the noncontributory rates for single and family plans were lower yet, 17 percent and 9 percent.
Act 10, proposed by Governor Walker and enacted by the legislature in 2011, removed benefits from local collective bargaining, thereby giving districts greater freedom to shop for less-expensive plans and to negotiate premiums. The law also allowed districts to establish higher employee contributions. Among the provisions of Act 10 was a 12 percent floor on the employee contribution rate, which applied directly only to the state-administered plan, but now serves as a benchmark that many school districts have followed.
These changes were intended to achieve savings on district benefit costs, through adoption of plans with lower premiums and increased teacher contributions. We examine the change in medical insurance costs for the school year ending in 2012, the first to be affected by Act 10, using data from the Wisconsin Association of School Boards (WASB). These results may not represent the total impact, as not all districts have renegotiated insurance contracts. Some are under contracts with insurers predating Act 10, including those with pre–Act 10 collective bargaining agreements that have not yet expired.
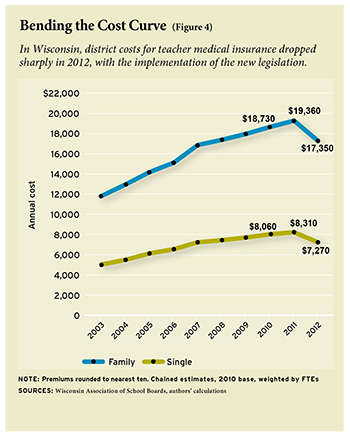
We calculate estimates of yearly changes using only districts for which data are available in consecutive years. The main finding from the WASB data is a sharp drop in employer costs in 2012 after years of steady growth. District payments for their employees’ medical care increased every year from 2003 to 2011. But from 2011 to 2012, average district costs for family coverage fell by an estimated $2,010, while district costs for single coverage declined by $1,042 (see Figure 4).
These figures underestimate the district savings attributable to Act 10, since premiums were steadily rising prior to Act 10 and were expected to continue doing so. When we account for this expected growth (using average growth from 2007 to 2011), we estimate savings of $2,614 for family coverage and $1,304 for single coverage. These estimates represent declines of 13 to 19 percent from the projected district costs for 2012.
Districts saved on teacher medical insurance costs in 2012 for two reasons: reductions in total premiums and increases in the portion paid by teachers. As discussed above, Act 10 did not directly raise teacher contributions, but the 12 percent minimum it established for the state plan set a standard that districts were now free to follow. For single coverage, between 2003 and 2011 the average share of medical insurance paid by teachers drifted up slightly, from about 3 to 4 percent, followed by a jump to more than 10 percent in 2012. Similarly, for family coverage, the average teacher contribution drifted up slightly over the period, to about 5 1/2 percent, and then jumped in 2012 to more than 10 percent. These figures now place Wisconsin in the vicinity of the national average contribution rate for teachers with single coverage of 13 percent, but still far below the average for family coverage of 34 percent.
In dollar terms, teacher contributions for family coverage rose by $939 in 2012, relative to the previous trend, while total premiums for family coverage declined by $1,674. Our estimate of $2,614 for the impact of Act 10 on district costs reflects these changes. The estimated impact on total premiums accounted for two-thirds of the reduction in district costs, and the act’s impact on employee contributions comprised the other third. We find a similar breakdown for single coverage.
These data have two important limitations. First, they likely understate the share of district savings attributable to higher employee costs because some (maybe most) of the reduction in total premiums is due to a rise in employee out-of-pocket payments (such as higher deductibles). Second, these data do not tell us anything about the quantity and quality of health care provided. Efficiency may have been enhanced as employees paid more of the cost and as employers became free to shop around, but we have no hard data on this.
As a check on the WASB data, we examined data from the Wisconsin Department of Public Instruction (DPI) on districts’ fringe benefit costs for teachers. Unlike the WASB data, these data are available for all districts but do not separate out health benefits from other fringe benefits, including retirement contributions, Social Security, and life insurance. The impact of Act 10 captured by these data will therefore include not only the effect on health insurance, but also the shift of about one-half of retirement contributions from employer to employee as mandated by Act 10.
The DPI data show a steady rise in fringe benefit costs from 1998 to 2011, in both dollar amounts and as a percentage of teacher salary, with the latter measure rising from 34 percent to 51 percent over the period. After Act 10, the average benefit rate dropped 8 percentage points to 43 percent. This is still quite high by comparison with the private sector, but markedly reduced. It is likely that at least one-half and perhaps two-thirds of the $4,500 drop in district fringe-benefit costs reflects the shift in retirement contributions, but virtually all of the remainder represents the reduction in district health-benefit costs. Thus the DPI data suggest a drop of $1,500 to $2,200 in average annual district health costs per teacher.
The DPI and WASB estimates show broadly consistent evidence of a large first-year impact of Act 10 on district costs for teacher health insurance, but we can only speculate on what the future effect will be. As mentioned above, some districts have not yet been able to use their new powers because of unexpired collective bargaining contracts or insurance policies, so there are more savings to be had. Many of the underlying drivers of rising health-care costs are independent of Act 10, and over the long term these will push Wisconsin employer costs back up, but from a significantly lower starting point. Moreover, as districts gain more experience in the open health care market, unfettered by collective bargaining, it is possible that they will be able to lower the rate of growth.
It is important to note that even with the dramatic savings from Act 10, district costs and total premiums in Wisconsin are still well above the national average for teachers. Indeed, by some estimates, prior to Act 10, a number of Wisconsin districts had insurance plans that were set to trigger the federal tax on “Cadillac plans” under the Affordable Care Act of 2010, scheduled to begin for 2018. This may still be true. Thus, there will be continuing pressure to reduce costs toward the national average, especially if and when the luxury tax is implemented.
Conclusion
The national data from the Bureau of Labor Statistics indicate that annual employer insurance costs are 26 percent higher for teachers than for private-sector professionals; adjusting for higher participation rates among teachers reduces the difference to 16 percent. Direct estimates of employer costs for medical plans present a mixed picture: higher employer costs for single coverage but not for family coverage. For both categories, total medical premiums are higher for teachers than they are for private-sector professionals, but for family coverage the teachers incur the extra expenditures themselves.
Unionization is associated with higher total premiums, higher employer costs, and lower employee contributions in both the public and private sectors. This suggests that the high unionization rate among teachers plays an important role in their employers’ higher average cost. Equally important, differences in teacher union strength across states help explain the wide variation in employer and employee health-insurance costs. In some nonunion states, teacher medical benefits are not particularly generous, owing to either low-cost plans (e.g., those with high deductibles) or high teacher contributions. In Arkansas, teachers typically pay 65 or 70 percent of the premiums for family coverage (the national average is 34 percent). In other states, with strong unions, such as Wisconsin, district insurance costs can be very expensive. It is in those states that the opportunities for district cost reduction are most promising, as data from Wisconsin so clearly show.
District cost reduction would ideally derive from changes that enhance efficiency, such as greater competition for health insurance. There should be no illusions that such efficiencies will come easily. In all likelihood, a great deal of any district cost reduction will take the form of higher teacher payments toward their health care through higher contributions and increased out-of-pocket expenses. This raises the question of the role of teacher health benefits in the total compensation package. The overall size of the package will continue to be the subject of debate. It is worth briefly commenting, however, on the importance of the structure of the package.
There are three reasons that efficiency might be enhanced by reallocating some of the compensation package from employer-paid health benefits to salary. First, efficiency in health-care expenditures is more likely enhanced when employees pay for services, since price signals provide the consumer with appropriate incentives. Second, shifting compensation back to salary (in the aggregate) provides greater opportunity for districts to use salary differentials to retain and recruit higher-quality teachers. Finally, as a matter of consumer choice, not all employees may want their employers to devote, say, $20,000 out of a $70,000 compensation package to medical insurance. Take-up rates well below 100 percent suggest that many teachers ascribe less value to the medical benefits offered than they cost. Thus, both efficiency (in attracting recruits) and equity (toward non-participants) might be enhanced by such a shift. Employers can offer greater choice among health plans of varying cost, with lower subsidies, fixed in size, and higher salaries that allow employees to choose how much they want to spend on higher-cost plans. As districts under fiscal distress increasingly turn to cost-cutting measures, such potential efficiency enhancements will become all the more important.
Robert Costrell is professor of education reform and economics at the University of Arkansas and fellow at the George W. Bush Institute. Jeffery Dean is distinguished doctoral fellow at the University of Arkansas. This paper is drawn from a chapter in A Bigger Bang for Education’s Bucks (George W. Bush Institute, forthcoming).
This article appeared in the Spring 2013 issue of Education Next. Suggested citation format:
Costrell, R.M., and Dean, J. (2013). The Rising Cost of Teachers’ Health Care: Private-sector employers pay much less. Education Next, 13(2), 66-72.