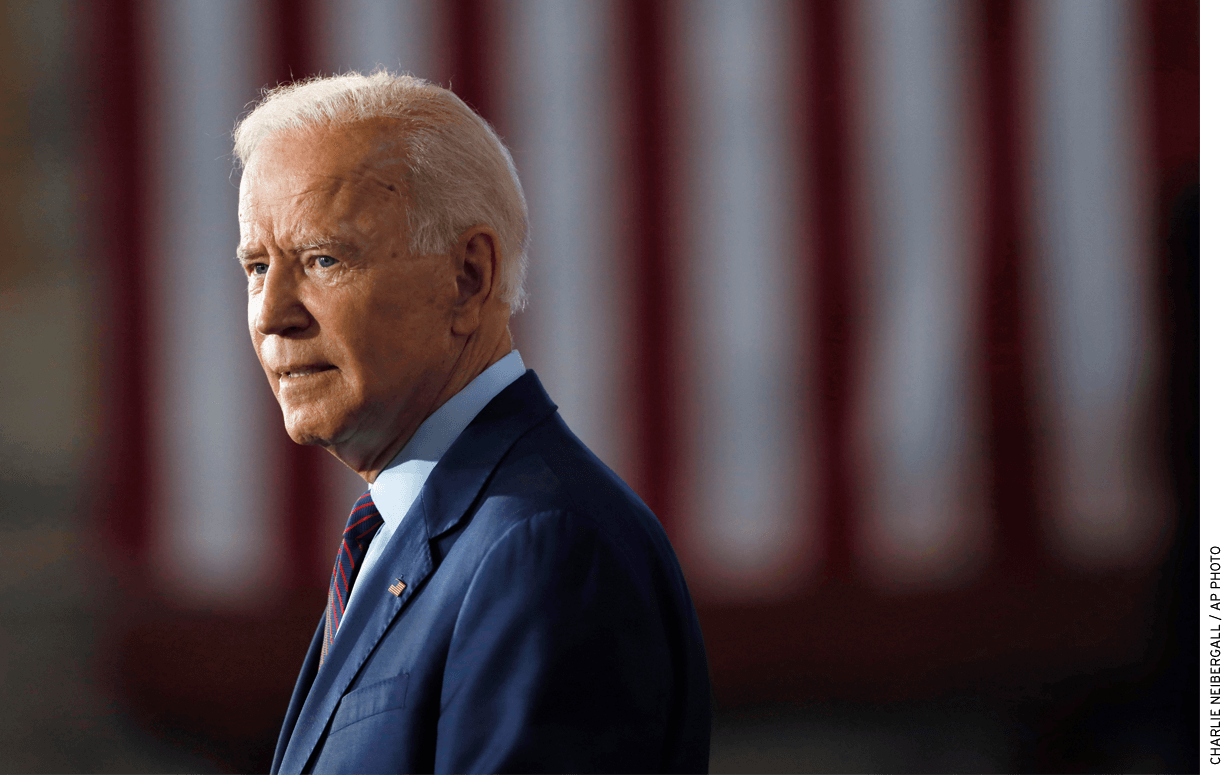
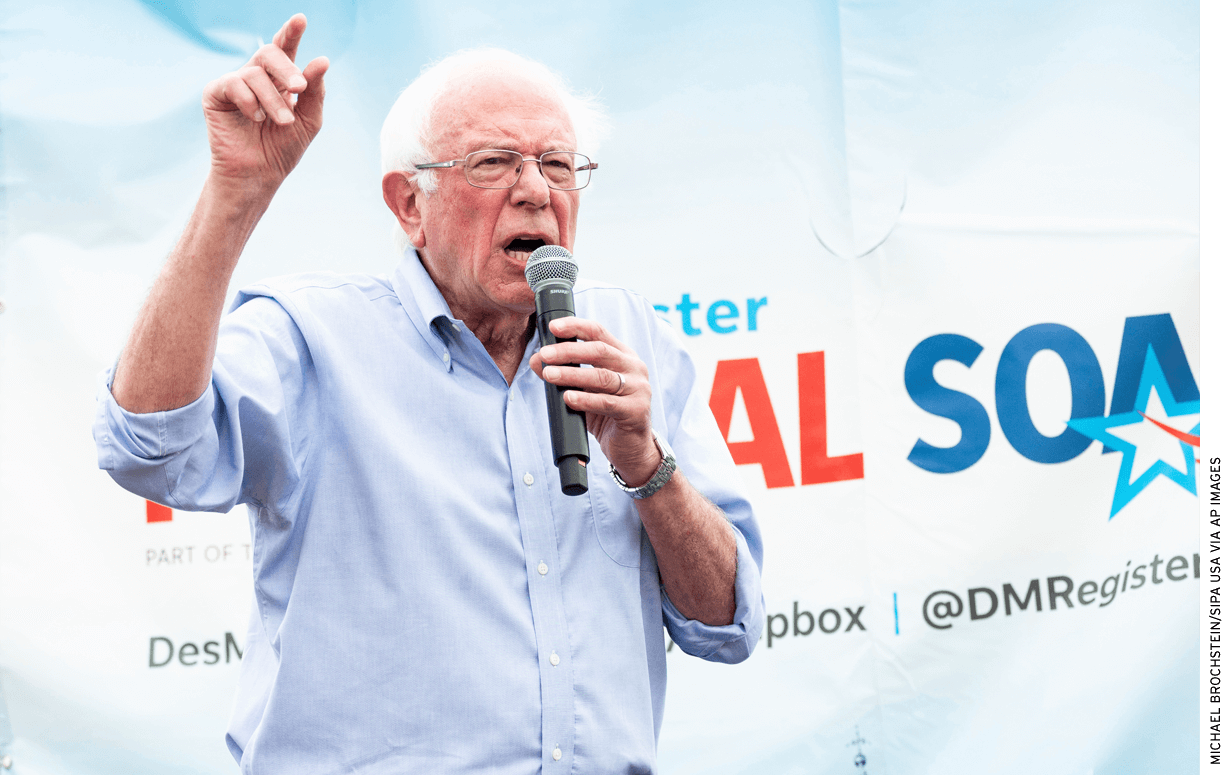
With the 2020 presidential election campaign now underway, education-policy proposals previously at the edge of the political debate are entering the mainstream. On the Republican side, the Trump administration has intensified its campaign for school choice. U.S. education secretary Betsy DeVos is asking Congress to enact $5 billion in tax credits annually to encourage donations to state-approved organizations providing scholarships that, if the state allows, could be used to attend private schools. Meanwhile, several Democratic candidates are calling for tuition-free college, an idea proposed in 2016 by Senator Bernie Sanders of Vermont but rejected that year by the nominees of both political parties. Democratic candidates are also promising dramatic increases to the federal fiscal commitment to K–12 education. Responding to recent teacher strikes for higher pay, Senator Kamala Harris of California proposes federal funding of a $13,500 average pay raise for teachers over their current annual salaries—at an estimated cost to taxpayers of $315 billion over 10 years. Not to be outdone, former vice president Joe Biden has called for a tripling of federal funding for schools serving the economically disadvantaged.
The tenor of these provocative ideas is resonating with the American public. Support for increasing teacher pay is higher now than at any point since 2008, and a majority of the public favors more federal funding for local schools. Free college commands the support of three in five Americans. Support for school vouchers has shifted upward, and tax-credit scholarships along the lines proposed by the current administration now command the support of a sizable majority of adults.
These are just a few of the findings of the 13th annual Education Next survey of public opinion, administered in May 2019. The poll’s nationally representative sample of 3,046 adults includes an oversampling of teachers, African Americans, and those who identify themselves as Hispanic. (All estimates of results are adjusted for non-response and oversampling of specific populations. See methods sidebar for further details.) This year, for the first time, we also surveyed a sample of 415 high-school students and their parents (see sidebar, “What Do Students Think about Education Policy?”).
On several issues, our analysis teases out nuances in public opinion by asking variations of questions to randomly selected segments of survey participants. We divided respondents at random into two or more segments and asked each group a different version of the same general question. For example, we told half of the respondents—but not the other half—how much the average teacher in their state is paid before asking whether salaries should increase, decrease, or remain about the same. By comparing the differences in the opinions of the two groups, we are able to estimate the extent to which relevant information influences public thinking on teacher pay.
In this essay, we report and interpret the poll’s major findings. Detailed results are available here. Following are the survey’s top-10 findings:
1. Vouchers and tax credits. The percentage of American adults favoring vouchers that help low-income students cover the cost of private-school tuition has risen to 49% in 2019 from 37% in 2016, and support for tax credits for donations to organizations that give scholarships to low-income students has edged upward to 58% from 53% over this same time period.
2. Charters. Public support for charter schools has climbed back to 48% from a low of 39% in 2017. Sixty-one percent of Republicans currently espouse charter schools, but only 40% of Democrats do. Only 33% of white Democrats favor charters, though 55% of African American Democrats and 47% of Hispanic Democrats back them.
3. Teacher pay. Support for teacher pay hikes is now higher than at any point since 2008. Among those provided information about current salary levels in their state, 56% say teacher salaries should rise—a 20-percentage-point jump over the approval level seen just two years ago. Among those not provided this information, 72% say salaries should increase, 5 percentage points higher than in 2018.
4. Spending. Public support for higher levels of school spending has also grown over the past two years. Among those not told current levels of expenditure, 62% think K–12 spending should increase, 8 percentage points higher than in 2017. Although only 50% of those told current levels favor an increase, that level still constitutes an increase of 11 percentage points over 2017.
5. Federal, state, and local spending. The public is more supportive of K–12 expenditure by the federal government than by state and local governments. Two thirds of those informed of the share currently contributed by the federal government say it should foot more of the bill. But only 36% of those told how much the local district contributes think districts should ramp up their expenditures. Half thought the state should contribute more, once they were informed of current levels.
6. Common Core. Support for the Common Core State Standards is rebounding. Overall, 50% of Americans endorse use of the standards in their state, up from 41% two years ago. The resurgence in support is strongest among Republicans, leaping to 46% from 32% over the past two years.
7. Opinion on local schools. More Americans have a positive view of their local public schools than at any point since 2007. Today, 60% of respondents give their local public schools a grade of A or B, a 9-percentage-point rise over last year.
8. Free college. Sixty percent of Americans endorse the idea of making public four-year colleges free, and even more (69%) want free public two-year colleges. Democrats are especially supportive of the concept (79% approval for four-year and 85% for two-year). Only 35% of Republicans back free tuition for four-year colleges and 47% favor the policy for two-year colleges.
9. Opinion on colleges. Americans think more highly of U.S. public four-year colleges and universities than of K–12 schools. More than twice as many Americans grade public four-year institutions nationwide with an A or B (58%) than hand out the high marks to K–12 schools (24%). The nation’s private four-year colleges and universities draw even higher esteem, with 66% of the general public rating them with grades of A or B. The share of Republicans who grade public four-year colleges across the country with these top marks is 17 percentage points lower than for Democrats, at 49% and 66%, respectively.
The public is even more generous in its evaluation of higher-education institutions in their own state. Seventy-six percent of respondents grade public four-year colleges in their state with an A or B. Similarly, 79% grade private four-year colleges in their state with these top marks.
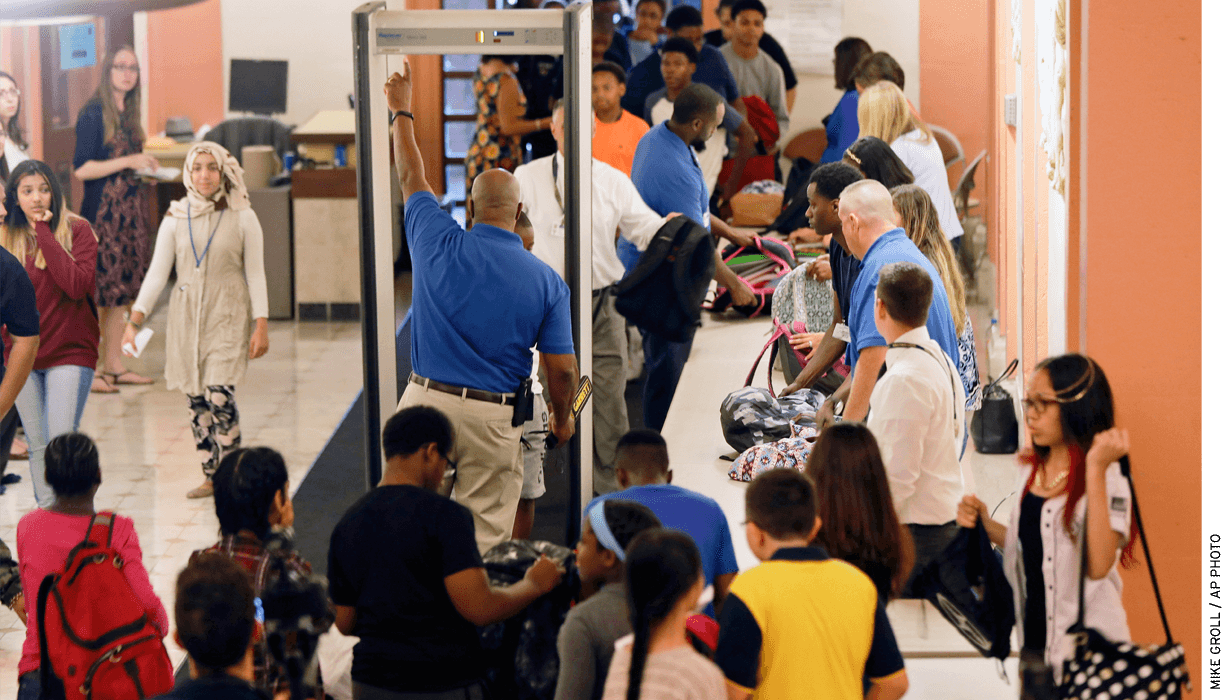
10. Student perspectives. Students have a lower opinion of their schools than do their parents. Seventy percent of parents give their local public schools an A or B grade, and a vast majority of 82% assign their child’s high school those top marks. Among students, these proportions drop by 15 percentage points for the local public schools and 13 percentage points for their own high school. However, students are less likely than parents to think that schools should take additional security measures. Seventy-seven percent of parents, but only 63% of their children, would install metal detectors at every school. Similarly, 81% of parents, but only 73% of their high-school students, would screen all students for severe emotional distress.
School Choice in the Trump Era
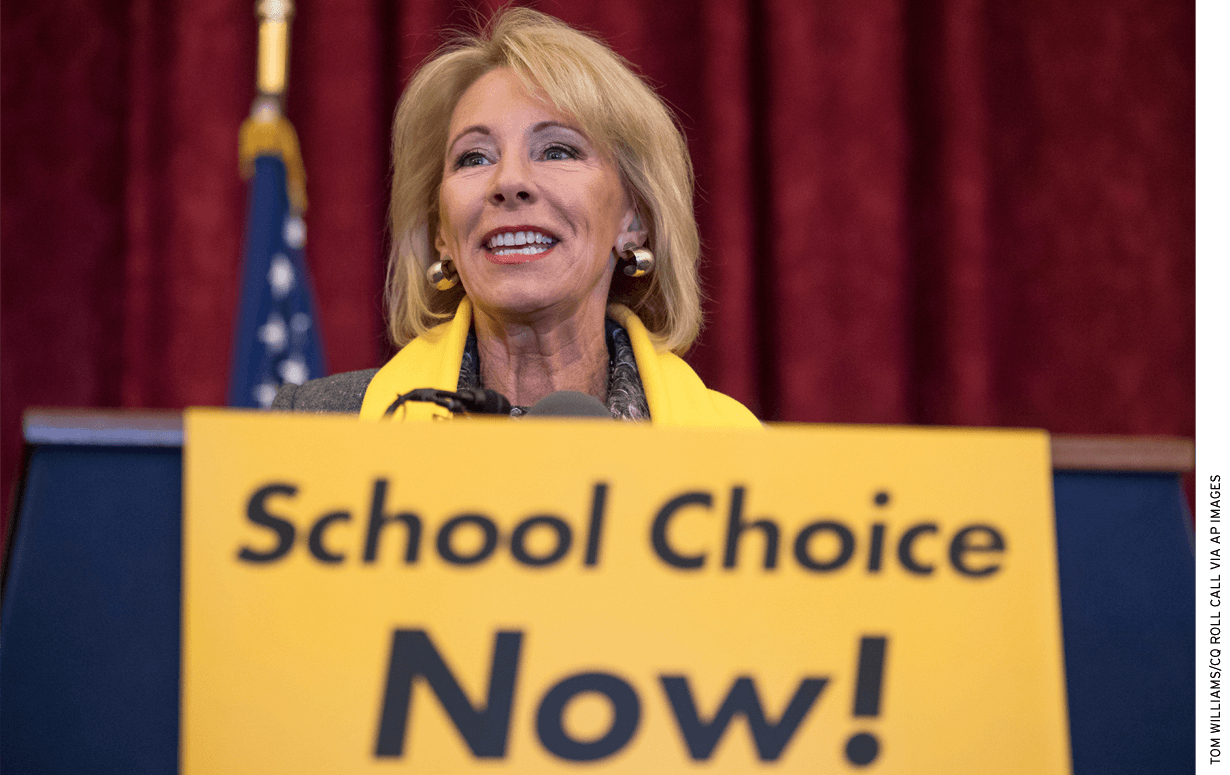
Though school choice was but a minor issue in the 2016 election, the Trump administration has sought to give it center stage in the national political debate over education. When the president nominated Betsy DeVos, chair of a pro–school choice advocacy group, as education secretary, her confirmation divided the Senate so evenly the vice president had to break the tie with a vote in her favor. DeVos has nonetheless become one of the longest-serving members of Trump’s cabinet and, far from retreating on the issue of school choice, she is backing a bill that would provide a federal tax credit for donations to organizations providing scholarships for private-school tuition or other state-approved educational expenses. DeVos says the law, if enacted, would give “hundreds of thousands of students across the country the power to find the right fit for their education.” The new Democratic majority in the House of Representatives makes it clear no such law will win a majority on their watch. Nor has the Republican-controlled Senate taken action on DeVos’s proposed school-choice legislation.
Has DeVos’s steadfast support for educational choice had an impact outside the Beltway? Have Democratic leaders succeeded in swaying public opinion against choice programs? Or, has opinion simply polarized along party lines?
To explore these questions, we looked at trends in public opinion between 2016 and 2019 on four school-choice policies: 1) targeted vouchers limited to students from low-income families; 2) universal vouchers for all families; 3) tax credits for contributors to organizations that give scholarships to low-income families; and 4) charter schools. We find, somewhat to our surprise, that public opinion about several school-choice policies has shifted closer to the views held by Betsy DeVos. But on one topic—charter schools—we see polarization along party lines (see Figure 1).

Targeted vouchers. The program to which DeVos devoted so much of her public life before becoming secretary is the least popular of the four school-choice programs. In 2016, a near majority of the public opposed “a proposal [to] give low-income families with children in public schools a wider choice, by allowing them to enroll their children in private schools instead, with government helping to pay the tuition.” Forty-eight percent said they were against targeted vouchers, and only 37% favored them. The remainder took a neutral position, saying they neither supported nor opposed the policy. A year later, approval for targeted vouchers rose to 43%, a 6-percentage-point bump. Now, in 2019, a near majority (49%) of respondents say they favor vouchers for low-income families, with just 41% expressing disapproval. On balance, support for targeted vouchers has gained 12 percentage points over the past four years, while opposition has gone down by 7 percentage points.
Both Republicans and Democrats are more in favor of targeted vouchers than they were three years ago. In 2016, a majority (54%) of Republicans opposed low-income vouchers, and less than a third (31%) liked the idea. By 2019, Republican approbation has jumped 13 percentage points upward to 44%, while opposition has fallen by 4 percentage points to 50%. The trend is the same for Democrats. Even in 2016, Democrats were more favorably disposed to targeted vouchers than Republicans, dividing between 42% in support and 43% opposed. Rank-and-file Democratic support for vouchers in 2018 rose to 47%, though opposition remained at 41%. Now, in 2019, Democratic approval for low-income vouchers has climbed to 52%, with disapproval receding to 37%. In short, criticism by Democratic elites has not stopped grassroots support from increasing by 10 percentage points and opposition from declining by 6 percentage points since 2016.
Universal vouchers. Although no state has ever implemented a universal voucher plan, the drift in public opinion in favor of such vouchers resembles that for targeted ones. In 2016, the public was equally divided over “a proposal [to] give all families with children in public schools a wider choice, by allowing them to enroll their children in private schools instead, with government helping to pay the tuition.” Forty-five percent of the adult population expressed support, with 44% opposed. A year later the level of support did not change significantly, but disapproval shrank to 37%. By 2018, a clear majority of 54% in favor of universal vouchers had emerged, with disapproval falling to 31%. The shift upward in approval has remained steady in 2019, with 55% in favor, though disapproval has returned to its 2017 level. Over the four years, the side endorsing universal vouchers has grown by 10 percentage points, while opposition has slipped 7 percentage points.
Republicans are more likely to back vouchers for all than those reserved for the poor. Even in 2016, 41% of Republicans liked the idea of universal vouchers, though 49% did not. With the Trump administration promoting the voucher concept, the mood shifted sharply in favor of universal vouchers in 2017 by a 54% to 33% margin. Now, in 2019, approval for such vouchers among Republicans has risen to 61%, with a third opposed. The change between 2016 and 2019 constitutes a 20-percentage-point shift upward in the level of Republican support for vouchers for all students. Democrats also like the idea of universal vouchers, but their opinions haven’t changed much since 2016. That year, Democrats backed the policy proposal by a 49% to 39% margin; in 2019, support has risen just slightly to 52%, with 40% against. In short, universal vouchers have gained in popularity among Republicans without losing ground among Democrats.
Tax credits. Tax credits for “individual and corporate donations that pay for scholarships to help low-income parents send their children to private schools” constitute the most popular of the school-choice programs, perhaps explaining why DeVos has built on this model for her proposed Education Freedom Scholarships legislation. Tax credits do not require any direct government outlay, and proponents can make the case to state legislatures that they save dollars for state taxpayers, as the cost of the scholarships permitted in many states is more than offset by the decrease in state aid to local districts. In Florida, a tax-credit initiative survived constitutional scrutiny when a voucher program did not, and, in Illinois, a deep-blue state, a tax-credit bill was signed into law in 2018.
These tax-credit success stories are rooted in continuing and bipartisan support among the public. Back in 2016, the concept commanded a 53% to 29% approval majority, with 18% taking a neutral position. Not much changed a year later, but in 2018 support edged up to 57%, with opposition slipping slightly to 26%. That level of endorsement has held steady in 2019 (58% to 26%). Even in an era of polarization, tax credits retain bipartisan favor. Sixty-five percent of Republicans like the idea, as compared to 49% in 2016. But the increase in Republican approval has not engendered polarization. In 2016, a 57% majority among Democrats favored the idea. That percentage has not changed materially in any subsequent year.
Nor does the public seem to care whether it is the state government that offers the tax credit, as in 18 current state programs, or if it is the federal government, as DeVos proposes. We learned this by asking half of the respondents a version of the question that said the credits would be offered by the feds. This version elicited a level of support—57%—that is statistically similar to what we observe when the federal government is not mentioned.
Charter schools. Charter schools are a small but increasingly entrenched part of the K–12 education system. Forty-four states and the District of Columbia have passed laws granting various entities—typically nonprofit organizations, government agencies, or universities—the power to authorize the formation of a charter school, and today charters serve about 6% of all students, not far behind the 10% share attending private schools. As judged by learning gains on state tests, a sizable number of charter schools are performing no better and possibly worse than neighboring public schools. Still, parental demand for charter schools is outstripping supply in many parts of the country. Some charters are generating impressive results, particularly in urban areas, and quite a few rank among the best schools in the country.
Still, the political environment for charters is shifting. For more than two decades after the first charter school opened its doors in Minnesota in 1992, charters seemed to be the one choice initiative backed by Democrats and Republicans alike. President Bill Clinton, a Democrat, oversaw the creation of a federal program to support charter-school growth, and his Republican successor, George W. Bush, sought to increase its funding. The Democratic administration of Barack Obama subsequently included charter expansion in its Race to the Top initiative.
In the 2016 election cycle, though, charter policy became an increasingly partisan issue. As a candidate, Democrat Hillary Clinton expressed doubts about whether charter schools serve the most disadvantaged students. In Massachusetts, teachers unions launched a vociferous campaign against charters and defeated a referendum that would have lifted a cap on the number of such schools in the state. In Chicago, Los Angeles, and elsewhere, unions have since secured agreements committing school boards to limit charter-school growth. The NAACP has called for a moratorium on charter schools.
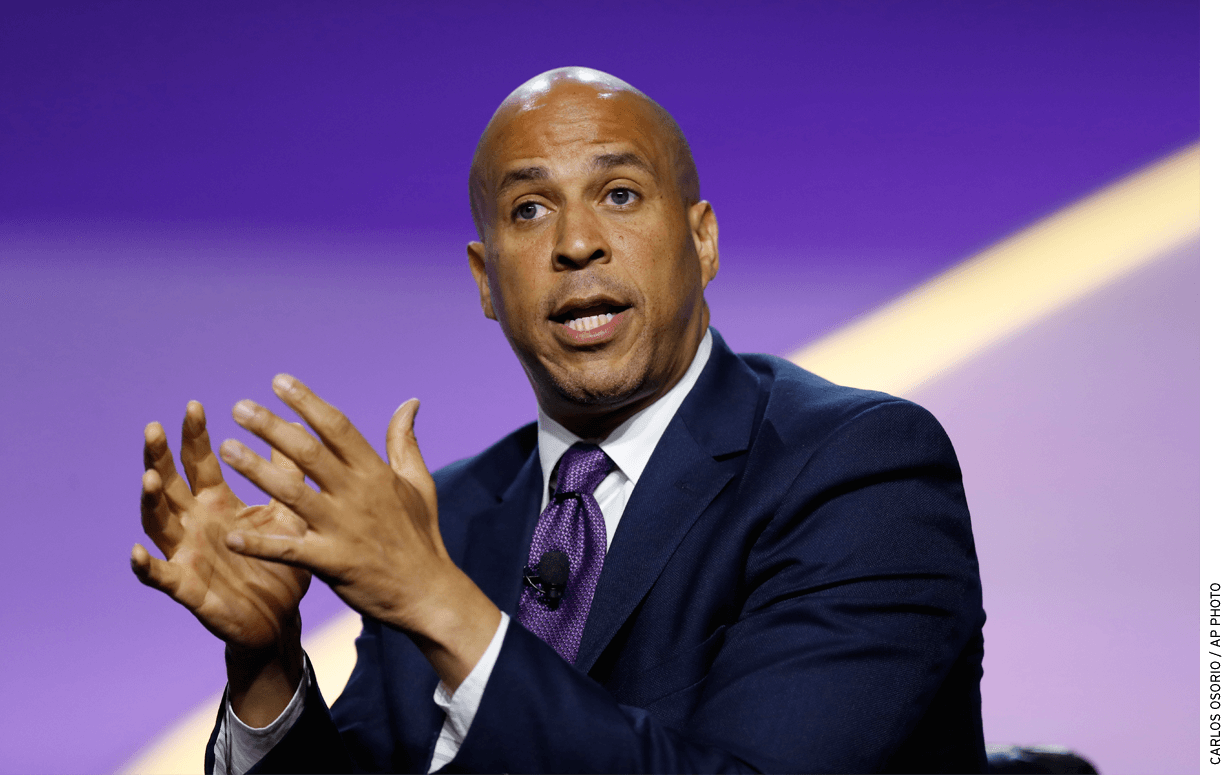
Many candidates seeking the Democratic presidential nomination in 2020 are adding their voices to the anti-charter campaign. Joe Biden, once a supporter of charters, now says “the bottom line is [that charters] siphon off money for our public schools, which are already in enough trouble.” Bernie Sanders has called for a halt to federal funding of charters. Even Senator Cory Booker of New Jersey, who welcomed charters to Newark when he was the city’s mayor, now takes an anti-charter stance: “I look at some of the charter laws that are written around this country,” he says, “and I find them really offensive. . . . They’re about raiding public education and hurting public schools, and that’s something . . . I will fight against.”
In the early days of the Trump administration, forceful attacks on charters seemed to influence public thinking. When respondents were asked in 2017 whether they favored the “formation of charter schools, which are publicly funded but are not managed by the local school board,” only 39% backed them, which was 12 percentage points lower than in 2016. Opposition had risen to 36% from 28% the year before. Charter support recovered modestly to 44% in 2018, with 35% opposed.
This year, support for charters has climbed back to 48%, essentially the same level as in 2016. However, disapproval, at 39%, remains as high as it was in 2017, with fewer people taking a neutral position. In sum, the potential collapse of public approval for charters that had appeared imminent in 2017 has not occurred, but opposition has solidified among a significant minority.
There are also signs of partisan polarization. On one side, Republicans are as committed as ever to charter schools. In 2016, 60% of party adherents backed charters. In 2017, as overall support for charters dipped, Republicans backed charters by a ratio of 47% to 30%. In 2018, Republican approval shifted back up to 57%, with just 27% in opposition. In 2019, the margin has widened, with 61% of Republicans backing charters while opposition remains at 27%.
Simultaneously, Democrats have backed away from charter schools. When Barack Obama held office in 2016, Democrats backed charters by a 45% to 33% margin. Those numbers nearly reversed themselves after the battles over the DeVos nomination, with just 34% of Democrats in favor and 41% against. By 2018, a plurality (42%) of the party’s adherents said they opposed the “formation of charters,” while just 36% were in favor. Democrats now oppose charters by a ratio of 48% to 40%.
Overall, the partisan divide in support for charter schools has widened to 21 percentage points from 15 percentage points between 2016 and 2019.
Knowledge of charter schools. Despite the spiraling controversy over charter schools, most Americans show a lack of full understanding about what they are and the policies that govern them, and people are no better informed in 2019 than they were seven years ago (see Figure 2). In 2012, our survey asked respondents if charters were allowed to charge tuition. Only 24% correctly said they could not; 32% answered incorrectly; and 44% admitted they did not know. The 2019 responses to that question are similar: only 26% give the right answer, 29% give the wrong answer, and 43% say they do not know. We also asked whether charters are allowed to hold religious services (they cannot). Only 22% give the right answer to this question in 2019, the same share that responded correctly in 2012.

We also asked respondents whether there is a charter school within their local school district. Twenty-eight percent say that they do not know. For the rest of the poll participants, Tyler Simko, research fellow at Harvard University’s Program on Education Policy and Governance, checked the responses against data on charter-school locations. As it turns out, many more people say they either “think” or “know” there is a charter school in their local district than is in fact the case. Only 40% of those who say they “know” a charter school is in their district are right. Only 31% of those who “think” their district has a charter school are correct. Those who do not think their home district includes a charter are more often right, with only 12% responding incorrectly. Less than 10% of those who “know” their district has no charter school are wrong.
Despite the high frequency of guessing on that question, people are somewhat more likely to approve of charters if one or more is in fact present in their local district. Fifty-three percent of those residing in places with charter schools favor the idea and only 35% oppose it, as compared to a margin of 47% support to 40% opposition among those living elsewhere. Of course, it is not clear what the causal relationship is here—whether charter schools tend to locate in more-receptive communities or these schools radiate a positive influence on local public opinion.
Divisions among Democrats. School choice divides the Democratic Party coalition along racial and ethnic lines (see Figure 3). Democrats who identify as African American approve of targeted vouchers, universal vouchers, and charter schools at 70%, 64%, and 55%, respectively. Among Hispanic Democrats, support for the three policies registers at 67%, 60%, and 47%. Meanwhile, just 40% of non-Hispanic white Democrats support targeted vouchers, 46% approve of universal vouchers, and 33% endorse charter schools.

Teacher Pay and Personnel Policies
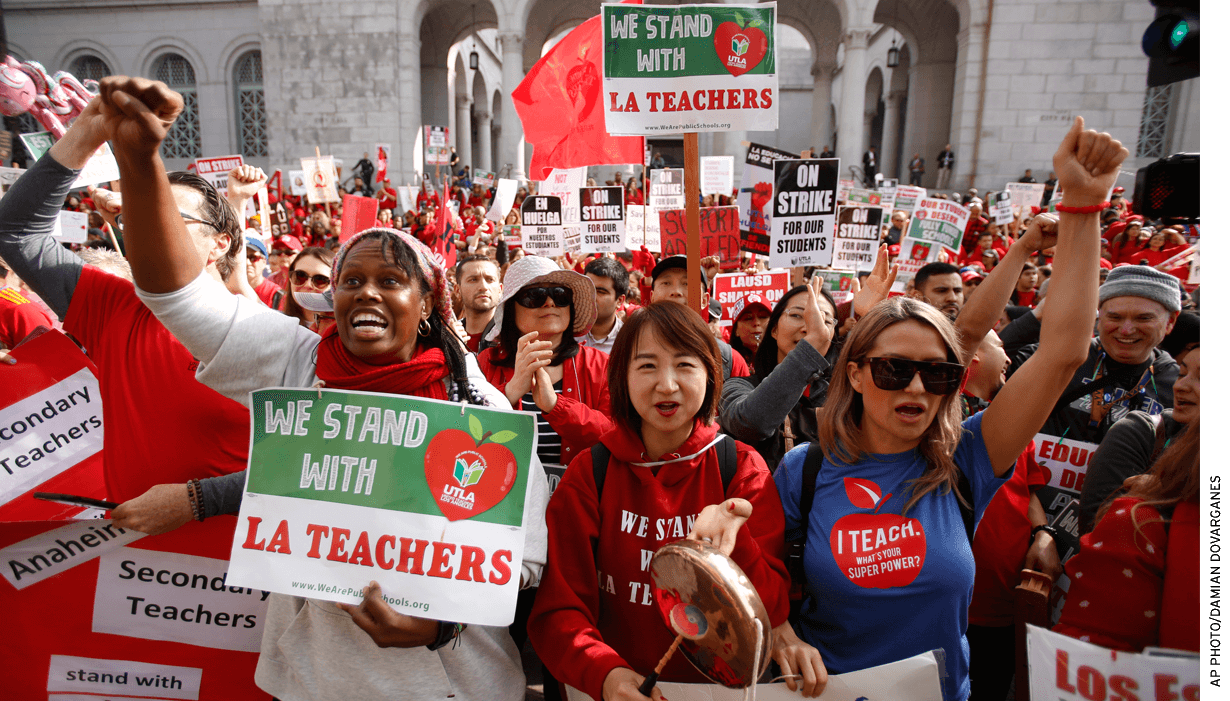
The year 2019 has been one of continued activism on the part of teachers seeking to make the case for better pay and working conditions—and against reforms such as charter schools and merit pay. After a rash of statewide strikes and walkouts shuttered schools in six states in spring 2018, this year has seen protracted strikes in Los Angeles, Oakland, and Denver, as well as the nation’s first-ever strike against a charter management organization. Teachers in each of these settings managed to secure healthy bumps in pay and other concessions, such as restrictions on class size and the hiring of additional non-teaching staff.
But how have these efforts played in the court of public opinion? Do Americans approve of teachers’ ongoing push for better pay? Have they become more sympathetic to those demands in the past year? How have their views of teachers unions changed over time? And do teachers and the public see eye to eye on matters such as tenure and merit pay? This year’s survey provided an opportunity to check the thermometer on each of these issues.
Teacher salaries. We asked all survey respondents whether they thought that salaries for public-school teachers in their home state should increase, decrease, or stay about the same. As in past years, before asking this question we first told a random half of respondents what teachers in their state actually earn. Among those provided this information, 56% say teacher salaries should increase—a 7-percentage-point jump over last year (see Figure 4). Forty percent of “informed” respondents say teacher salaries in their state should remain about the same, while just 5% say they should decrease.

This boost in support for a teacher pay increase comes on the heels of a 13-percentage-point jump that occurred between 2017 and 2018. As a result, support for increasing teacher compensation is now higher than at any point since 2008, when we first surveyed the public on the issue. That year, when we fielded our survey at the peak of the housing bubble and just prior to the financial crisis, marked the only other time in which a majority of poll respondents expressed support for increasing teacher pay when told actual teacher salaries.
More Democrats than Republicans favor increasing teacher salaries, but approval jumped in 2019 among members of both political parties. Support rose to 64% this year from 59% in 2018 among Democrats, and to 43% from 38% among Republicans. Meanwhile, teachers are even more convinced about the merits of increasing their own salaries, with 76% of them registering support.
Among those who are not first informed of what teachers currently earn, a larger proportion of the public favors increasing teacher salaries. Seventy-two percent of this segment say that salaries should increase, 25% say they should remain the same, and 3% say they should decrease. These numbers also reflect an uptick in support over 2018, in this case by 5 percentage points. The higher level of endorsement for boosting teacher salaries among the “uninformed” respondents reflects the fact that most Americans believe that teachers are underpaid and earn far less than they actually do. When asked to estimate average teacher salaries in their state, respondents’ average guess came in at $41,987—30% less than the actual average of $59,581 among our sample of educators.
Teachers unions and the right to strike. The public has also grown more sanguine about the influence teachers unions have on the nation’s public schools (see Figure 5). When asked whether they think the effects of unions are “generally positive” or “generally negative,” 43% of those polled offer a positive assessment and 34% give a negative one. The share opting for positive has risen 6 percentage points since 2018 and 13 percentage points since 2015. That year, just 30% of the public said positive while 40% said negative. The division of opinion over teachers unions falls sharply along partisan lines, with 57% of Democrats, but just 26% of Republicans, selecting positive. Teachers, meanwhile, think that unions have a positive impact by an overwhelming 60% to 26% margin.

Nor has the disruption caused by recent teacher strikes diminished the public’s support for the teachers’ right to take this action. While laws prohibiting teacher strikes are on the books in a majority of states, 54% of the public favors “public school teachers having the right to strike,” and just 32% opposes it; both figures are essentially unchanged over the past year. There is again a strong partisan divide on this issue, however, with 68% of Democrats and just 36% of Republicans in favor. A hefty share of teachers—68%—also support the right to strike; just 24% oppose it.
Merit pay. While Americans have grown more supportive of teacher pay raises, they continue to disagree with teachers over the criteria and methods that determine their compensation. This year, we used two different formats when asking whether part of teachers’ pay should be based on “how much their students learn.” A random half of respondents were asked the basic question, as in previous years of the poll. The other half answered a modified question that also listed a battery of other potential determinants of teachers’ pay. Both versions reveal more support than opposition from the public for paying teachers based in part on student learning. Approval is substantially higher, however, when respondents consider such merit pay alongside other forms of differentiated compensation.
When the question is posed in its traditional form, 47% of the public expresses support for merit pay and 40% is opposed. At 53%, approval for merit pay is higher among Republicans than among Democrats. Democrats are evenly split, with 43% in favor and 44% opposed. Among teachers, however, just 20% favor merit pay and as many as 74% are against it.
The second format of the question used the same language to ask whether part of teachers’ pay should be based on the following factors:
• whether they teach subjects with teacher shortages, like math and science
• whether they teach in schools with many disadvantaged students
• evaluations by their principals
• evaluations by their fellow teachers
• how many years they have been teaching
• whether they have a master’s degree
All of these options were shown when respondents were asked to register their opinion of each, with the items randomly ordered to defuse any tendency on the part of respondents to offer more (or less) support for those presented first.
When the question is asked this way, 72% of respondents express support for merit pay—24 percentage points higher than when the question is asked in isolation (see Figure 6). The public apparently finds the concept more attractive when it is considered in the context of other options for determining teachers’ salaries. Approval among teachers jumps as well, to 42%, though a 51% majority remain opposed.

A majority of respondents also favor five other options for determining pay: experience (74%), principal evaluations (66%), master’s degrees (66%), subject area shortages (65%), and student disadvantage (60%). Basing teacher pay in part on evaluations by their peers draws somewhat weaker support—49%—but that still exceeds the 35% who are opposed.
Teachers express more-selective views on the various options for determining their compensation. Only 33% of teachers endorse peer evaluations, with 57% opposed—the only option to generate more resistance than merit pay. A majority of teachers express support for basing pay in part on student disadvantage (73%), principal evaluations (57%), and subject-area shortages (55%). But far larger majorities express approval for the traditional determinants of teacher pay: experience (89%) and master’s degrees (80%). Teachers may be open to experimentation with alternatives, but they clearly remain most comfortable with the status quo.
Tenure. Teachers also disagree with the broader public on the merits of teacher tenure. A clear plurality of the public—49%—opposes the practice, with 37% in favor, while teachers, as might be expected, strongly approve of tenure—59% to 34%. It is possible that support for tenure among teachers is softening, however. Opposition to the practice rose by 10 percentage points over the past year, while support dipped by 3 percentage points.
Federalism and School Spending
The appropriate role of the federal government in K–12 education has long been a contentious issue. The Trump administration has called for only the most minimal boosts in federal funding. By contrast, candidates seeking the Democratic nomination for president are calling for massive increases. Joe Biden wants to triple the amount of money the federal government spends on the education of low-income children. Kamala Harris wants to spend $315 billion over 10 years to boost teacher salaries, and Bernie Sanders is willing to spend whatever it takes to boost minimum teacher salaries to $60,000 a year.
Although the price tag is larger than in the past, the debate between Republicans and Democrats is an old one. Democratic president John F. Kennedy was unable to persuade Congress to enact a general grant-in-aid to local school districts. It was his successor, Lyndon Johnson, also a Democrat, who crafted a compromise targeting federal dollars to schools with low-income students. Democrat Jimmy Carter kept his campaign commitment to create a federal department of education, but Congress prevented his Republican successor, Ronald Reagan, from keeping his promise to abolish it. Republican George W. Bush defied expectations by constructing a broad bipartisan coalition that passed No Child Left Behind, a law that boosted spending and demanded that states test students annually and sanction schools based on the results. But the partisan divide re-emerged as a Republican Congress won a partial retreat from a large federal role with the passage of the Every Student Succeeds Act of 2015 under Barack Obama, a Democrat.
Despite these twists and turns, the share of fiscal costs covered by federal grants has been surprisingly stable since the Carter administration. The level has wavered over the years, but it has never wandered far from 10% of total funding, with the rest coming from state and local school districts, which chip in roughly equal amounts. In 2016, the most recent year for which information is available, the federal share was 8% nationwide. State and local tiers of government each contributed 46% of the total cost.
Despite the consistency of these proportions over time, public perceptions of the federal share are wildly inaccurate (see Figure 7). When we asked respondents “what percent of funding for public schools in your local school district currently comes from each level of government,” people assign an average of 28% to the federal government, more than three times the actual amount. Meanwhile, the public underestimates the local contribution, positing 34%. The public also miscalculates the size of the state contribution by 9 percentage points, thinking it just 37%.

After respondents estimated the share of school spending contributed by each level of government, we asked them a series of questions on whether school spending in their local district should increase, and from which tier(s) of government. When asked whether “government funding for public schools in your districts should increase,” 62% of respondents said that it should. As in past years’ polls, information on what is currently being spent per child in the local district, which we provided to a random half of respondents, dampens enthusiasm for an increase, as only 50% of the informed respondents call for more spending. Even so, support for a boost in funding has jumped since 2017 by 8 percentage points and 11 percentage points, respectively, among uninformed and informed respondents.
In a second poll experiment, all respondents were told current spending levels in their local district. Half were also told the share of that spending coming from each tier of government, while the other half were not. We then asked both groups whether federal funding, state funding, and local funding for their district should increase.
Among those not given the true fiscal breakdown, 60% say the federal government should spend more on their local schools. Sixty percent also think the state should pony up more cash. Only when it comes to local taxes is the public stingy. Just 46% say the local district should spend more.
Spending preferences differ when the public is informed of the funding proportions, however (see Figure 8). Two thirds of those told how little the federal government contributes to K–12 education say it should foot more of the bill, a share that is 7 percentage points higher than among the uninformed. In other words, there appears to be a broad consensus that the federal fiscal role should expand.

Conversely, when the public learns that the local tier contributes 46% of the cost, only 36% of respondents feel an increase is warranted, representing a 9-percentage-point drop relative to the uninformed. Unless a local school district can make a strong case for more resources, it is likely to find stiff resistance from local taxpayers. Similarly, support for increasing state spending falls from 60% among the uninformed to 50% among those informed that the state was already contributing, on average, 46% of the cost.
Sharp disparities in spending preferences emerge along party lines, perhaps a reflection of long-standing differences in views on the appropriate federal role in education. Among the uninformed, 73% of Democrats, but only 43% of Republicans, favor more federal spending on schools, a 30-percentage-point difference. These margins attenuate by 7 percentage points among those who learn how little the federal government contributes to the cost of K–12 education in their district.
Yet partisan differences may be driven as much by spending preferences as by differing views concerning the role of each tier of government. Among those not told about the share contributed by each level, 55% of Democrats, but only 33% of Republicans, think local districts should spend more. Among those told how much local districts already contribute, partisan differences drop by 4 percentage points, but 43% of Democrats still favor more funding, compared to 25% of Republicans.
The story is much the same for state expenditures. Sixty-nine percent of uninformed Democrats, but only 50% of uninformed Republicans, think the state should spend more. When respondents are told the current state share, support for more funding declines among both groups by about the same percentage. Fifty-eight percent of informed Democrats want the state to spend more, but only 40% of Republicans do.
In sum, the public is not aware of how little the federal government contributes to the costs of K–12 public education. In general, people are in favor of spending more on the schools, but Democrats, as compared to Republicans, prefer a funding hike from all tiers of government. Candidates for the Democratic nomination know their audience when pitching for steep increases in federal support. But when informed about the large fiscal role already played by state and local governments, both Republicans and Democrats are less likely to favor digging deeper into the till. Apparently, the public is more cautious about local dollars coming from local taxes than about money arriving from Washington.
Common Core. After several years of vigorous debate, support for the Common Core State Standards is rebounding (see Figure 9). Overall, 50% of Americans endorse use of the standards in their state, continuing a climb in approval from its low point of 41% in 2017. The resurgence in support is strongest among Republicans, rising to 46% from 32% over the past two years. Even so, Republicans remain divided over the standards, with 47% opposing their adoption. Democrats, who since at least 2014 have consistently expressed higher levels of approval for the standards than Republicans have, hold steady at 52% in favor and 36% opposed. Today, the party gap is the smallest it has been since 2013, when there was almost no difference between Republicans and Democrats over the Common Core. After opening to a 20-percentage-point chasm by 2015, the difference between Democrats and Republicans stands at just 6 percentage points today.

Teacher opinion on the standards has remained steady over the past five years, lingering in the low 40s and sitting at 44% today. This is the first year of the survey in which Republican support exceeds teacher support, though the difference is not statistically significant.
Even as public approval rises and polarization decreases, the politics of the Common Core remain fraught. This is clear when we find that simply referring to the standards as “Common Core” depresses support. When a randomly selected subset of our participants answers a similar question that does not invoke the standards by name, support for the use of “standards for reading and math that are the same across the states” is 66% and there is virtually no difference between Democrats (66%) and Republicans (67%). Perhaps the supporters of common standards could harness this strong majority support by launching public-awareness campaigns and re-branding efforts.
Testing. Americans’ backing of federal testing mandates remains strong. Seventy-four percent support the federal government’s requirement that all students be tested in math and reading in 3rd through 8th grade and at least once in high school. Support is widespread, with similar majorities among most demographic or political groups, including parents, racial and ethnic minorities, Republicans and Democrats. Teachers are the exception. Only 46% of teachers agree the testing requirement should remain in place, with 49% opposed.
One of the critiques of testing is the amount of time it requires. To explore whether time commitments affect opinions of testing, we conducted an experiment in which a random subset of participants were told: “According to the most recent information available, students in grades 3–8 in large cities spend an average of about 8 hours of school time each year taking tests required by the federal government.” We draw these estimates of the time commitment from a 2014 report from the Council of the Great City Schools. Admittedly, the estimate refers specifically to “large cities” and captures only the time spent taking the exams, rather than also factoring in the time spent on test preparation; thus, this experiment provides only a limited test of how information about the time commitment affects support for testing. Nevertheless, the experiment reveals that exposure to even partial information about the time costs of testing can move opinion. Approval drops 10 percentage points among those told about the hours devoted to testing. For teachers, this information decreases backing by just 4 percentage points.
Calls to make public colleges tuition-free are on the rise. Bernie Sanders zeroed in on the issue in the 2016 Democratic presidential primaries, and now several contenders for the 2020 nomination are offering proposals of their own. At the same time, a number of states, such as Tennessee, have launched programs to make tuition free at public two-year community colleges, and others, such as New York, have waived in-state tuition at public four-year colleges and universities.
We asked survey respondents whether they favor or oppose making public colleges in the United States free to attend. Some participants were asked about two-year colleges while others were asked about four-year colleges. For both types of college, free tuition is a popular concept (see Figure 10). Sixty percent of Americans endorse the idea of making public four-year colleges free, and even more (69%) want free public two-year colleges. Democrats are especially supportive of the concept (79% approval for four-year and 85% for two-year). Republicans tend to oppose free tuition for four-year colleges (35% in support and 55% opposed) and are divided over free tuition for two-year colleges (47% in support and 47% opposed).

In today’s economy, it pays to get a college education. Workers with a postsecondary degree consistently earn more than high-school graduates do. Does being informed—or perhaps reminded—of the economic returns of college influence attitudes toward making college free? To answer this, we conducted an experiment in which some respondents were randomly chosen to receive information about the average annual earnings of two- or four-year degree holders. Respondents answering the two-year-college question were told that graduates of these schools earn $46,000 each year, on average, over the course of their working lives. Respondents who got the four-year-college question learned that graduates of these schools earn $61,400 annually, on average, over the course of their working lives. It was not obvious whether—or how—this information might shift opinions. On the one hand, learning the economic returns to a college education could prompt people to think that more Americans should have access to college so they can share in greater economic opportunities. On the other, learning what college-degree holders earn could prompt people to think those who benefit from a degree should bear the cost.
As it turns out, information about earnings has little effect on opinions about free college. Support for a free education at public two-year colleges falls slightly, from 69% to 65%, when people are told the average earnings of graduates of these schools. Approval of a free ride at public four-year colleges among informed respondents (62%) is statistically indistinguishable from the attitudes of those not given the earnings information (60%).
Immigration
The increasingly polarized national debate over immigration shows up in how Americans think about higher education. Poll respondents are evenly split over the question of whether undocumented immigrants who graduate from a U.S. high school should be eligible for in-state tuition at colleges here—44% support the idea, and 44% oppose it. The politicized nature of the issue is evident in the stark differences between Democrats and Republicans. Among Democrats, 63% favor in-state tuition for undocumented immigrants and 25% oppose it. Among Republicans, just 20% support the concept and 71% oppose it.
The partisan debate over immigration has less effect on attitudes about the language in which non-English-speaking students should be taught. Most people (62%) say children who are not proficient in English should be placed in English-only classrooms. Interestingly, the balance of opinion on this issue has shifted against English-based instruction since two years ago, when 68% supported English-only classrooms and 32% favored teaching in students’ native languages.
Only 38% say English learners should be placed in classrooms where instruction is in their native language. While there is a partisan gap on this question, too, the majorities of both Republicans (74%) and Democrats (54%) do favor English-only classrooms.

Grading Public Schools, Colleges, and Universities
More Americans have a positive view of their local public schools than at any point since the EdNext survey began asking about these perspectives in 2007. Today, 60% of respondents give their local public schools a grade of A or B. The 9-percentage-point rise in these grades compared to last year extends a climb that proceeded more slowly over the previous decade. Yet, respondents’ more-positive opinions do not extend to the public schools beyond their local communities. The 24% share of survey takers giving an A or B to the public schools in the nation as a whole remains much the same as it was a year ago. As a result, the gap between respondents’ evaluations of their local public schools and their assessments of public schools in general has widened to 36 points today from 20 percentage points about a decade ago.

This year, for the first time, we also asked respondents to grade institutions of higher education. A random half of respondents were asked about these institutions in the nation as a whole, while the other half were asked about those in their home state.
Despite growing concern about issues such as college affordability and a lack of ideological diversity on campus, Americans think more highly of U.S. public four-year colleges and universities than of the nation’s public elementary and secondary schools. More than twice as many survey respondents (58%) assign these postsecondary institutions an A or B. The nation’s private four-year colleges and universities draw even higher esteem, with 66% giving them A or B grades. Clearly, people think more highly of private institutions of higher education than of public institutions. However, they draw an even greater distinction between institutions in their own state and those “in the nation as a whole.” Overall, 76% of participants grade public four-year colleges in their state with an A or B, 18 percentage points higher than for public four-year colleges in the nation as a whole. Similarly, 79 percent give the top marks to private four-year colleges in their state, 13 percentage points higher than for such colleges elsewhere. In short, respondents rate public and private four-year colleges within their state equally well, and they view in-state public colleges more positively than private colleges nationally.

Republicans consistently judge colleges more stringently than Democrats do, but the size of this opinion gap depends on whether respondents are evaluating public or private institutions and whether they are assessing institutions within their own state or across the country. The share of Republicans who grade public four-year colleges across the country with an A or B is 17 percentage points lower than the proportion of Democrats. For in-state four-year public colleges, the share of Republicans giving out top marks is 8 percentage points lower than among Democrats. For private four-year colleges across the nation, the share is also 8 percentage points lower for Republicans. The political party adherents are closest when it comes to evaluating in-state private four-year colleges, with a differential of only 4 percentage points in granting A or B grades. Democrats and Republicans come closest to agreement when evaluating the quality of private colleges within their states and disagree most when evaluating public colleges nationwide.
Compared to Democrats, Republicans see bigger differences between public and private institutions both in their state and across the country. The share of Republicans handing out A or B grades to private colleges in their state is 5 percentage points higher than for public colleges in their state. When considering schools across the nation, the share of Republicans giving the top grades to private college is 13 percentage points higher than for public colleges. In contrast, Democrats see no difference between private and public colleges in their state, and the share giving A or B grades to private colleges across the country is only 4 percentage points higher than for public colleges across the country.
The survey also asked participants to grade three specific higher-education institutions in their state (referring to each institution by name):
• the flagship public four-year college
• the nearest non-flagship public four-year college
• the nearest two-year public community college
There is remarkable consistency among these evaluations. The shares of Americans giving these schools an A or B grade are 75% for flagship public four-year colleges, 70% for the nearest non-flagship public four-year college, and 69% for the nearest public two-year community college. The partisan gaps found in overall evaluations of in-state public four-year colleges manifest again with respect to specific schools—as the share of Democrats giving the top grades is 11 and 10 percentage points higher than the share of Republicans for flagships and non-flagships, respectively. However, there is no substantive difference between parties in their evaluations of community colleges.
Michael B. Henderson is assistant professor at Louisiana State University’s Manship School of Mass Communication and director of its Public Policy Research Lab. David M. Houston is a postdoctoral fellow at Harvard University’s Program on Education Policy and Governance (PEPG). Paul E. Peterson, professor of government at Harvard University, directs PEPG and is senior editor of Education Next. Martin R. West, professor of education at Harvard University, is deputy director of PEPG and editor-in-chief of Education Next.


|
Methodology This is the 13th annual Education Next survey in a series that began in 2007. Results from all prior surveys are available at www.educationnext.org/edfacts. The main results presented here are based on a sample of 3,046 respondents, including a nationally representative, stratified sample of adults (age 18 and older) in the United States as well as representative oversamples of the following subgroups: teachers (667), African Americans (597), and Hispanics (648). Survey weights were employed to account for non-response and the oversampling of specific groups. Additionally, we surveyed a sample of 415 high-school parents as well as their oldest high-school child. Results for this group are reported separately in this essay. Respondents could elect to complete the survey in English or Spanish; 209 respondents chose to take the survey in Spanish. The survey was conducted from May 14 to May 25, 2019, by the polling firm Ipsos Public Affairs via its KnowledgePanel®. In its KnowledgePanel®, Ipsos Public Affairs maintains a nationally representative panel of adults (obtained via address-based sampling techniques) who agree to participate in a limited number of online surveys. We report separately on the opinions of the public, teachers, parents, African Americans, Hispanics, white respondents without a four-year college degree, white respondents with a four-year college degree, and self-identified Democrats and Republicans. We define Democrats and Republicans to include respondents who say that they “lean” toward one party or the other. In the 2019 EdNext survey sample, 54% of respondents identify as Democrats and 39% as Republicans; the remaining 7% identify as independent, undecided, or affiliated with another party. In general, survey responses based on larger numbers of observations are more precise, that is, less prone to sampling variance, than those based on groups with fewer numbers of observations. As a consequence, answers attributed to the national population are more precisely estimated than are those attributed to groups (teachers, African Americans, and Hispanics). The margin of error for binary responses given by the main sample in the EdNext survey is approximately 1.7 percentage points for questions on which opinion is evenly split. The specific number of respondents varies from question to question, owing to item non-response and to the fact that, for several survey questions, we randomly divided the sample into multiple groups in order to examine the effect of variations in the way questions were posed. The exact wording of each question is available at www.educationnext.org/edfacts. Percentages reported in the figures and online tables do not always sum to 100, as a result of rounding to the nearest percentage point. Information used in the experiments involving school-district spending and revenue were taken from the 2014–15 National Center for Education Statistics (NCES) Common Core of Data’s Local Education Agency Finance Survey for fiscal year 2015, version 1a-final, the most recent available at the time the survey was prepared. Information used in the experiments involving state teacher salaries were drawn from the NCES Digest of Education Statistics, 2017 (Table 211.6), the most recent available at the time the survey was prepared. |
This article appeared in the Winter 2020 issue of Education Next. Suggested citation format:
Henderson, M.B., Houston, D.M., Peterson, P.E., and West, M.R. (2020). Public Support Grows for Higher Teacher Pay and Expanded School Choice: Results from the 2019 Education Next Survey. Education Next, 20(1), 8-27.