The Covid-19 pandemic prompted the largest disruption to American education in living memory. At the onset of the crisis in spring 2020, nearly every K–12 school, public and private, closed its doors. At the start of the next school year (see “Pandemic Parent Survey Finds Perverse Pattern,” features, Spring 2021), the decision to reopen for in-person instruction or to continue operating remotely varied widely among regions of the country, across school sectors—traditional district, charter, and private—and even from school to school in a given community. By the end of the 2020–21 academic year, most K–12 students were back in their classrooms (see “Parent Poll Reveals Support for Covid Safety Measures,” features, Winter 2022), but the emergence of new variants of the virus and strict quarantine rules continued to disrupt the day-to-day business of teaching and learning well into the 2021–22 school year.
Many observers and pundits opined that the great disruption could usher in an era of sweeping changes to the American education system. Would families flee the public sector in droves? Would homeschooling emerge as a viable option for many more children? Or would the crisis prompt greater investments in public education, increasing spending and expanding the publicly funded K–12 infrastructure downward in age to pre-kindergarten and upward to community college?
The pandemic also revealed that the partisan differences that define much of contemporary American politics run even deeper than many imagined, as opinions on Covid-related public-health measures—school closures, vaccines, face masks, and more—became inextricably tied to one’s political identity. Would the politics of education in the United States, with its long history of fractious but not necessarily partisan disagreements, be swept into the broader current of perpetual conflict between Democrats and Republicans? Did the last few years mark a great pivot point, signaling the emergence of two distinct, and distinctly partisan, views of how best to serve students?
[td_block_image_box custom_title=”Interactive results from the 2022 Education Next survey” image_item0=”49715663″ image_title_item0=”Results from the 2022 Education Next Survey” custom_url_item0=”https://www.educationnext.org/2022-ednext-poll-interactive/” open_in_new_window_item0=”true” image_item1=”49715665″ image_title_item1=”Education Next Annual Survey: Trends Through 2022″ custom_url_item1=”https://www.educationnext.org/ednext-poll-interactive-trends-through-2022-public-opinion/” open_in_new_window_item1=”true”]
The results of the 16th annual Education Next survey, conducted in May 2022 with a nationally representative sample of 1,784 American adults (see the methodology sidebar for more details), complicate many of these grand prognostications. While last year’s survey revealed sharp changes in support for a variety of education reforms (see “Hunger for Stability Quells Appetite for Change,” features, Winter 2022), public opinion on most issues has since rebounded to pre-pandemic levels. There are, however, some important exceptions to this pattern. Americans’ perceptions of local school quality have declined since 2019, and support for homeschooling has risen over the course of the pandemic. Public enthusiasm for universal pre-K has increased dramatically, and support for higher teacher salaries is at its highest level in the survey’s history.
The Education Next survey also tells a more complex and nuanced story about the shifting relationship between political partisanship and public opinion on education issues. First, attitudes toward a series of longstanding debates are increasingly organized around political-party identification. Using Education Next survey data from 2007 to 2022, we reveal that the average difference in opinion between the two major parties has grown larger on many of the items we have tracked over the years. Second, we are witnessing the emergence of new issues that reflect exceptionally large partisan splits. Over the past two years, we have introduced questions about schools’ responses to the pandemic and recent debates about how to teach about the role of race in America’s past and present. In contrast to many of the education-policy topics that we have explored in prior iterations of the survey, respondents’ positions on these issues appear to map more directly to their partisan identities. However, there are notable exceptions to both patterns, resisting a simple narrative. Although rank-and-file Democrats and Republicans have diverged over time in their attitudes toward charter schools, members of the two parties continue to converge in their attitudes toward annual standardized testing. While the pandemic ushered in intense partisan disagreement over the benefits of face masks in schools, it enhanced bipartisan interest in the option for high school students to take some classes online. To say that the politics of education is increasingly partisan is not to say that it is exclusively partisan.
Public Opinion During the Pandemic
The Education Next survey found that certain school reforms, such as various forms of school choice, lost some favor at the peak of the pandemic but subsequently bounced back in the public’s esteem. Other concepts, such as mandatory standardized testing, have maintained favorability throughout. A majority of respondents now support increasing teacher salaries, even when they are told the average earnings of teachers in their state.
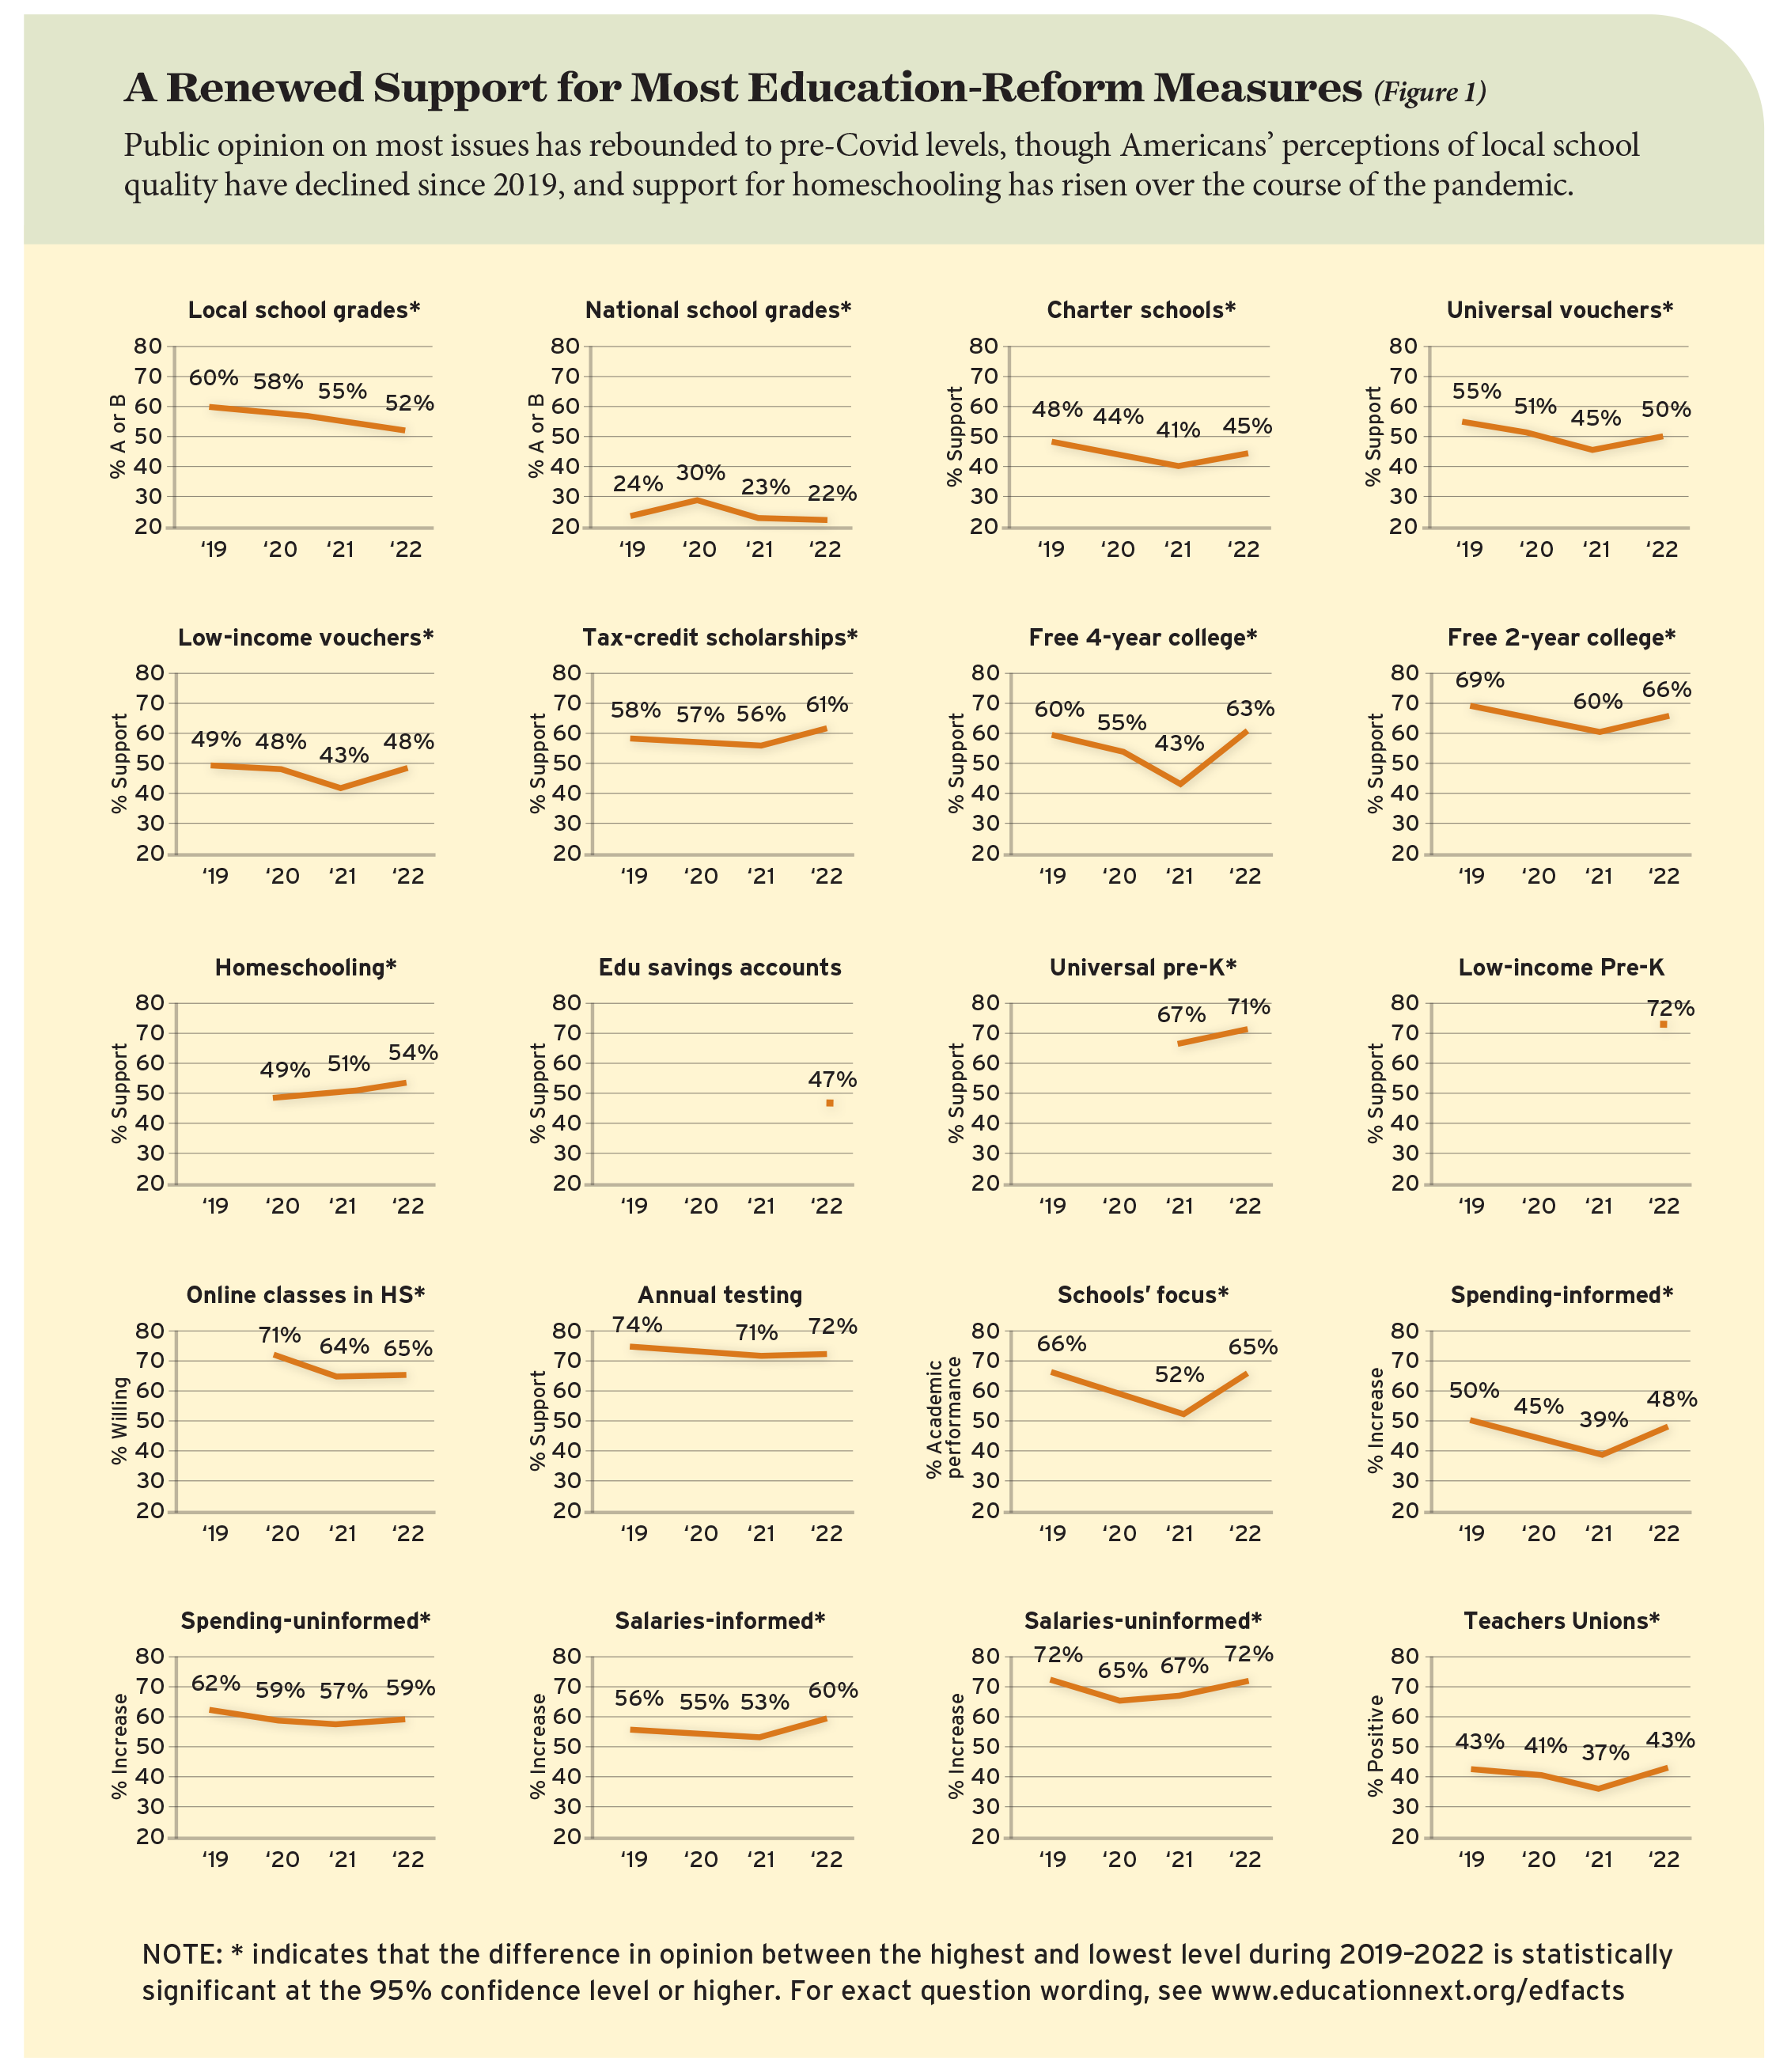
Perceptions of school quality. Despite the unprecedented disruptions to K–12 education, public evaluations of local and national school quality remained robust at the height of the Covid-19 crisis. In spring 2020, when schools across the country closed at the onset of the pandemic, 58% of Americans gave their local public schools a grade of an A or a B—only 2 percentage points down from the recent high of 60% in 2019, a statistically insignificant difference. Furthermore, 30% of Americans gave an A or a B grade to the public schools nationwide, the largest proportion recorded in the history of our survey. Two years later, as the pandemic and its attendant challenges persist, the public’s perceptions of school quality have slipped below pre-pandemic levels. Today, 52% of Americans give their local public schools an A or a B grade, and 22% give all schools nationwide a similarly high mark (see Figure 1).
School reform. Coinciding with these declines in confidence in the schools, support for various school reforms has ticked up from a pandemic low. Last year, we reported decreased public enthusiasm for a range of issues that spanned the ideological spectrum. Support for various forms of school choice dropped, as did support for free tuition to public colleges and universities. We concluded then that the public was still reeling from the enormous shock of the efforts to mitigate the spread of the virus and that the appetite for policy change of any kind was muted. As the public school system returns to a semblance of its former self, we are seeing public opinion on a variety of issues also returning to its pre-pandemic contours.
For example, support for charter schools ticked back up to 45% after lows of 39% in 2017 and 41% in 2021. Similarly, support for both universal vouchers (50%) and vouchers for low-income families (48%) has recovered from its 2021 levels (45% and 43%, respectively). Meanwhile, scholarships for low-income families funded by tax credits, which had 55% support in 2017 and 56% support a year ago, now enjoy the backing of 61% of Americans. On the opposite end of the political spectrum, support for making all public four-year and two-year colleges free to attend leapt back to 61% (from 43% in 2021) and 66% (from 60% in 2021), respectively.
Public enthusiasm for another pair of school choice reforms has also grown. Fifty-four percent of Americans favor allowing parents to homeschool their children, compared to 45% in 2017. Similarly, 47% of Americans now support education savings accounts—government-provided funds that can be used on educational expenses for families that choose not to send their child to a public school—compared to 37% in 2017.
Free preschool; online courses in high school. Back in 2014, we asked about government-funded universal pre-kindergarten (54% in favor) as well as government-funded pre-kindergarten for low-income families (62% in favor). Since then, support for both policies has risen: 71% of respondents back universal pre-K in 2022, and 72% support pre-K for low-income families.
A sizable majority of respondents (65%) say they would be willing to have a child of their own go through high school taking some academic courses online, although that support has declined from a high of 71% in spring 2020. The 2022 favorability rating, though, still represents a noteworthy increase from 2013, when 56% of respondents indicated their willingness to have their child take online high school classes.
Standardized testing.Throughout the pandemic, public support for annual standardized testing remained strong. In 2019, 74% of survey takers supported a federal requirement that all students be tested in math and reading each year in grades 3 to 8 and once in high school. Support for this requirement held steady at 71% and 72% in 2021 and 2022.
Social and emotional learning. The public’s opinions on the relative emphasis schools should place on academic performance has shifted sharply. In 2019, when asked how much schools should focus on students’ academic performance versus their social and emotional wellbeing, the public supported a 66% to 34% split in favor of academic performance. In 2021, as the pandemic continued to disrupt regular school operations, Americans divided almost evenly down the middle, with 52% preferring academic performance and 48% favoring social and emotional wellbeing. As some version of normalcy returns for most Americans, views on this question in 2022 have bounced back to 65%, nearly their pre-pandemic levels.
Education spending and teachers unions. Each year, we conduct a pair of survey experiments in which some respondents are randomly assigned generic questions intended to gauge their attitudes toward education spending in general and teacher salaries in particular, while other respondents, before answering the same questions, are randomly assigned to receive information about average per-pupil expenditures in their districts or average teacher salaries in their states. As seen in previous years, support for increased spending in general and support for higher teacher pay declines among respondents who receive information about current expenditures: to 48% from 59% with respect to overall spending and to 60% from 72% with respect to teacher salaries. In surveys before 2019, informing respondents of actual spending and salaries typically shifted support for boosting these spending categories from a majority to a minority position. Since 2019, however, support for increased teacher salaries—even when respondents are informed of actual compensation levels—has exceeded the majority threshold and is now at the highest level observed since our first survey in 2007. In contrast, positive evaluations of teachers unions remain unchanged since 2019 (43% in 2022). Much like public opinion regarding various reforms, attitudes toward increased spending and salaries and toward teachers unions dipped in 2021 but have since rebounded.
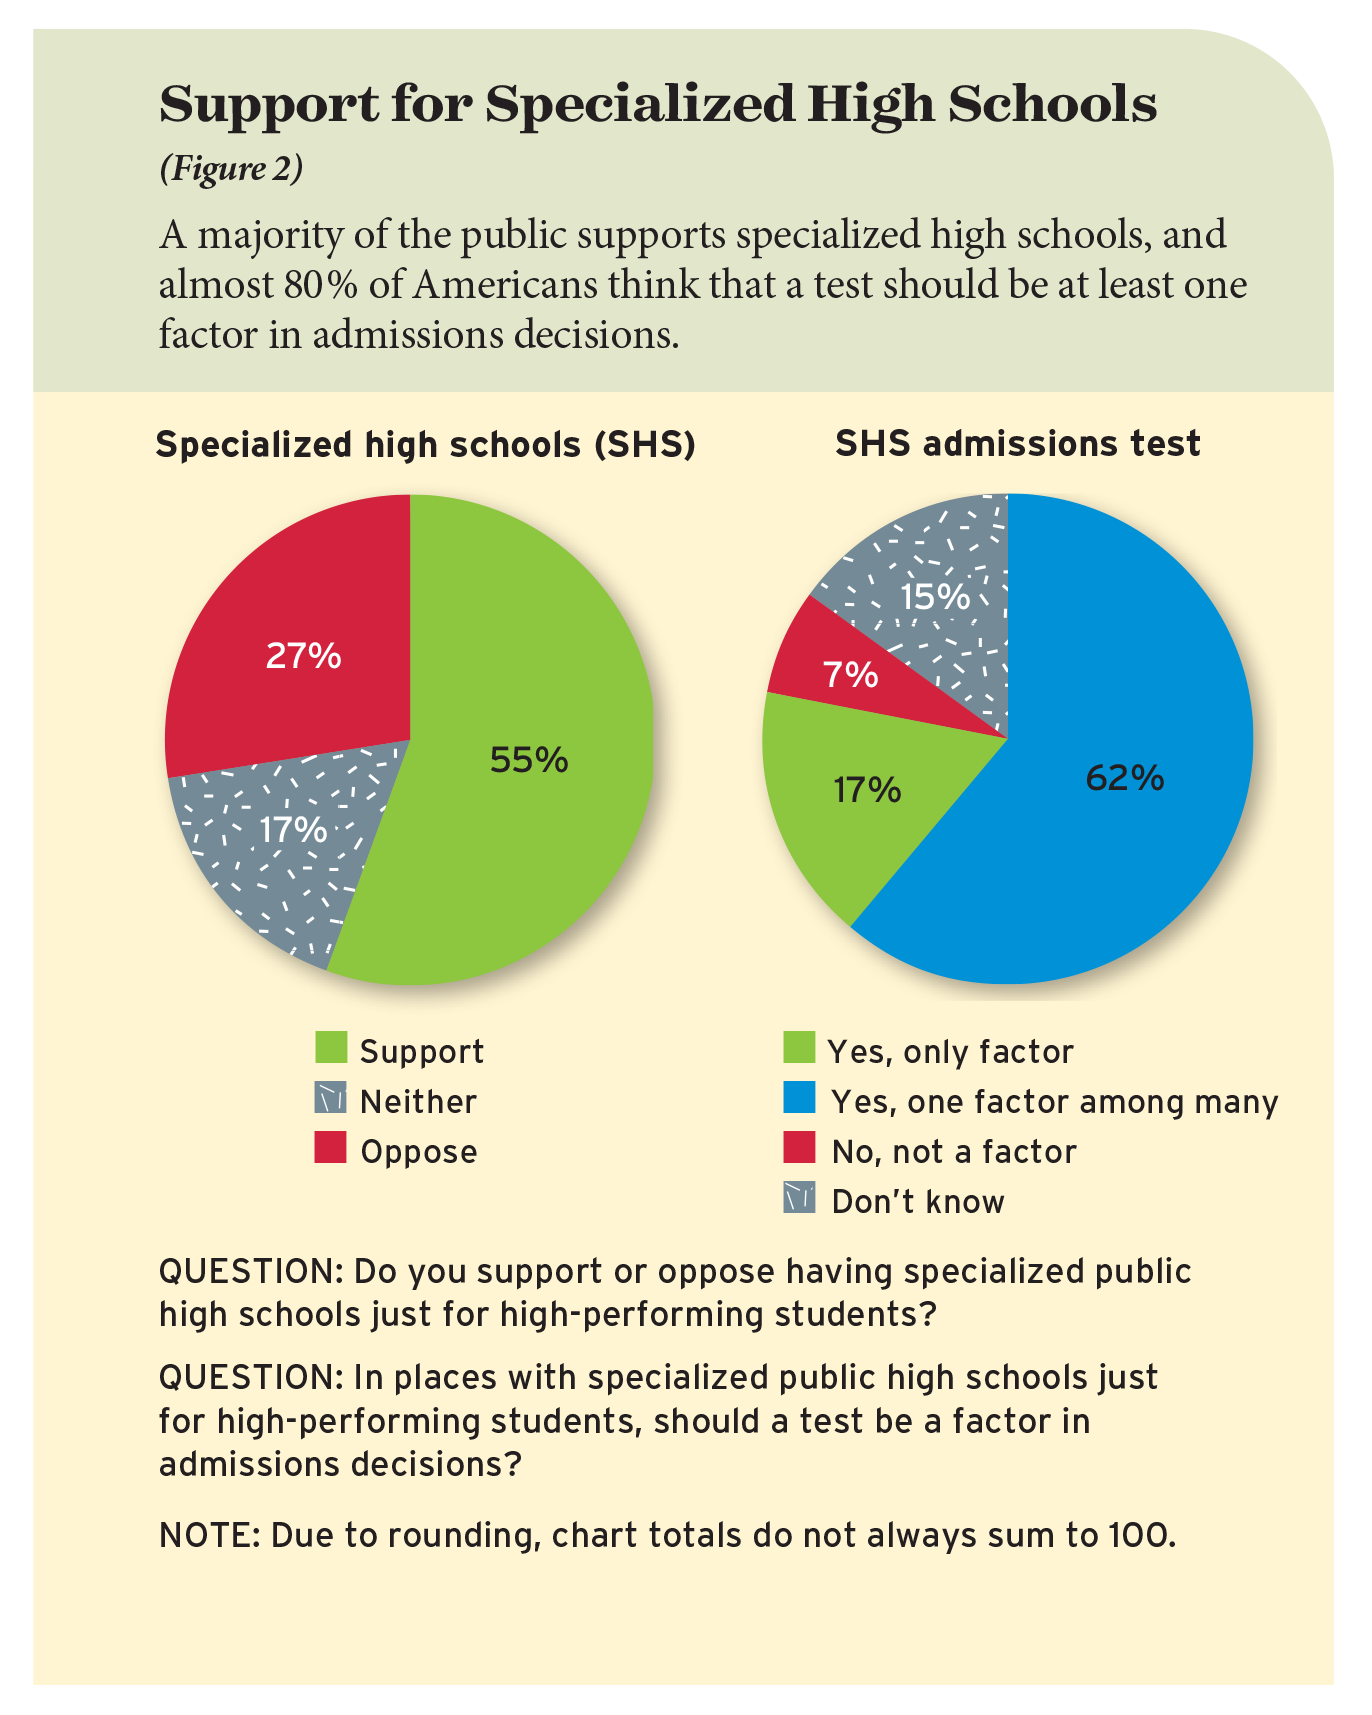
Specialized magnet schools. This year, we also asked two new questions about specialized public high schools for high-performing students, such as Stuyvesant High School in New York City or Thomas Jefferson High School for Science and Technology in Northern Virginia, whose admissions policies have attracted considerable attention and debate (see Figure 2). A majority (55%) support specialized public high schools, with 27% opposed and 17% expressing no opinion. Fully 62% of Americans think a test should be one factor among many in admissions decisions in places with such high schools. Only 17% think a test should be the sole factor, and a mere 7% think tests should play no role in the admissions process.
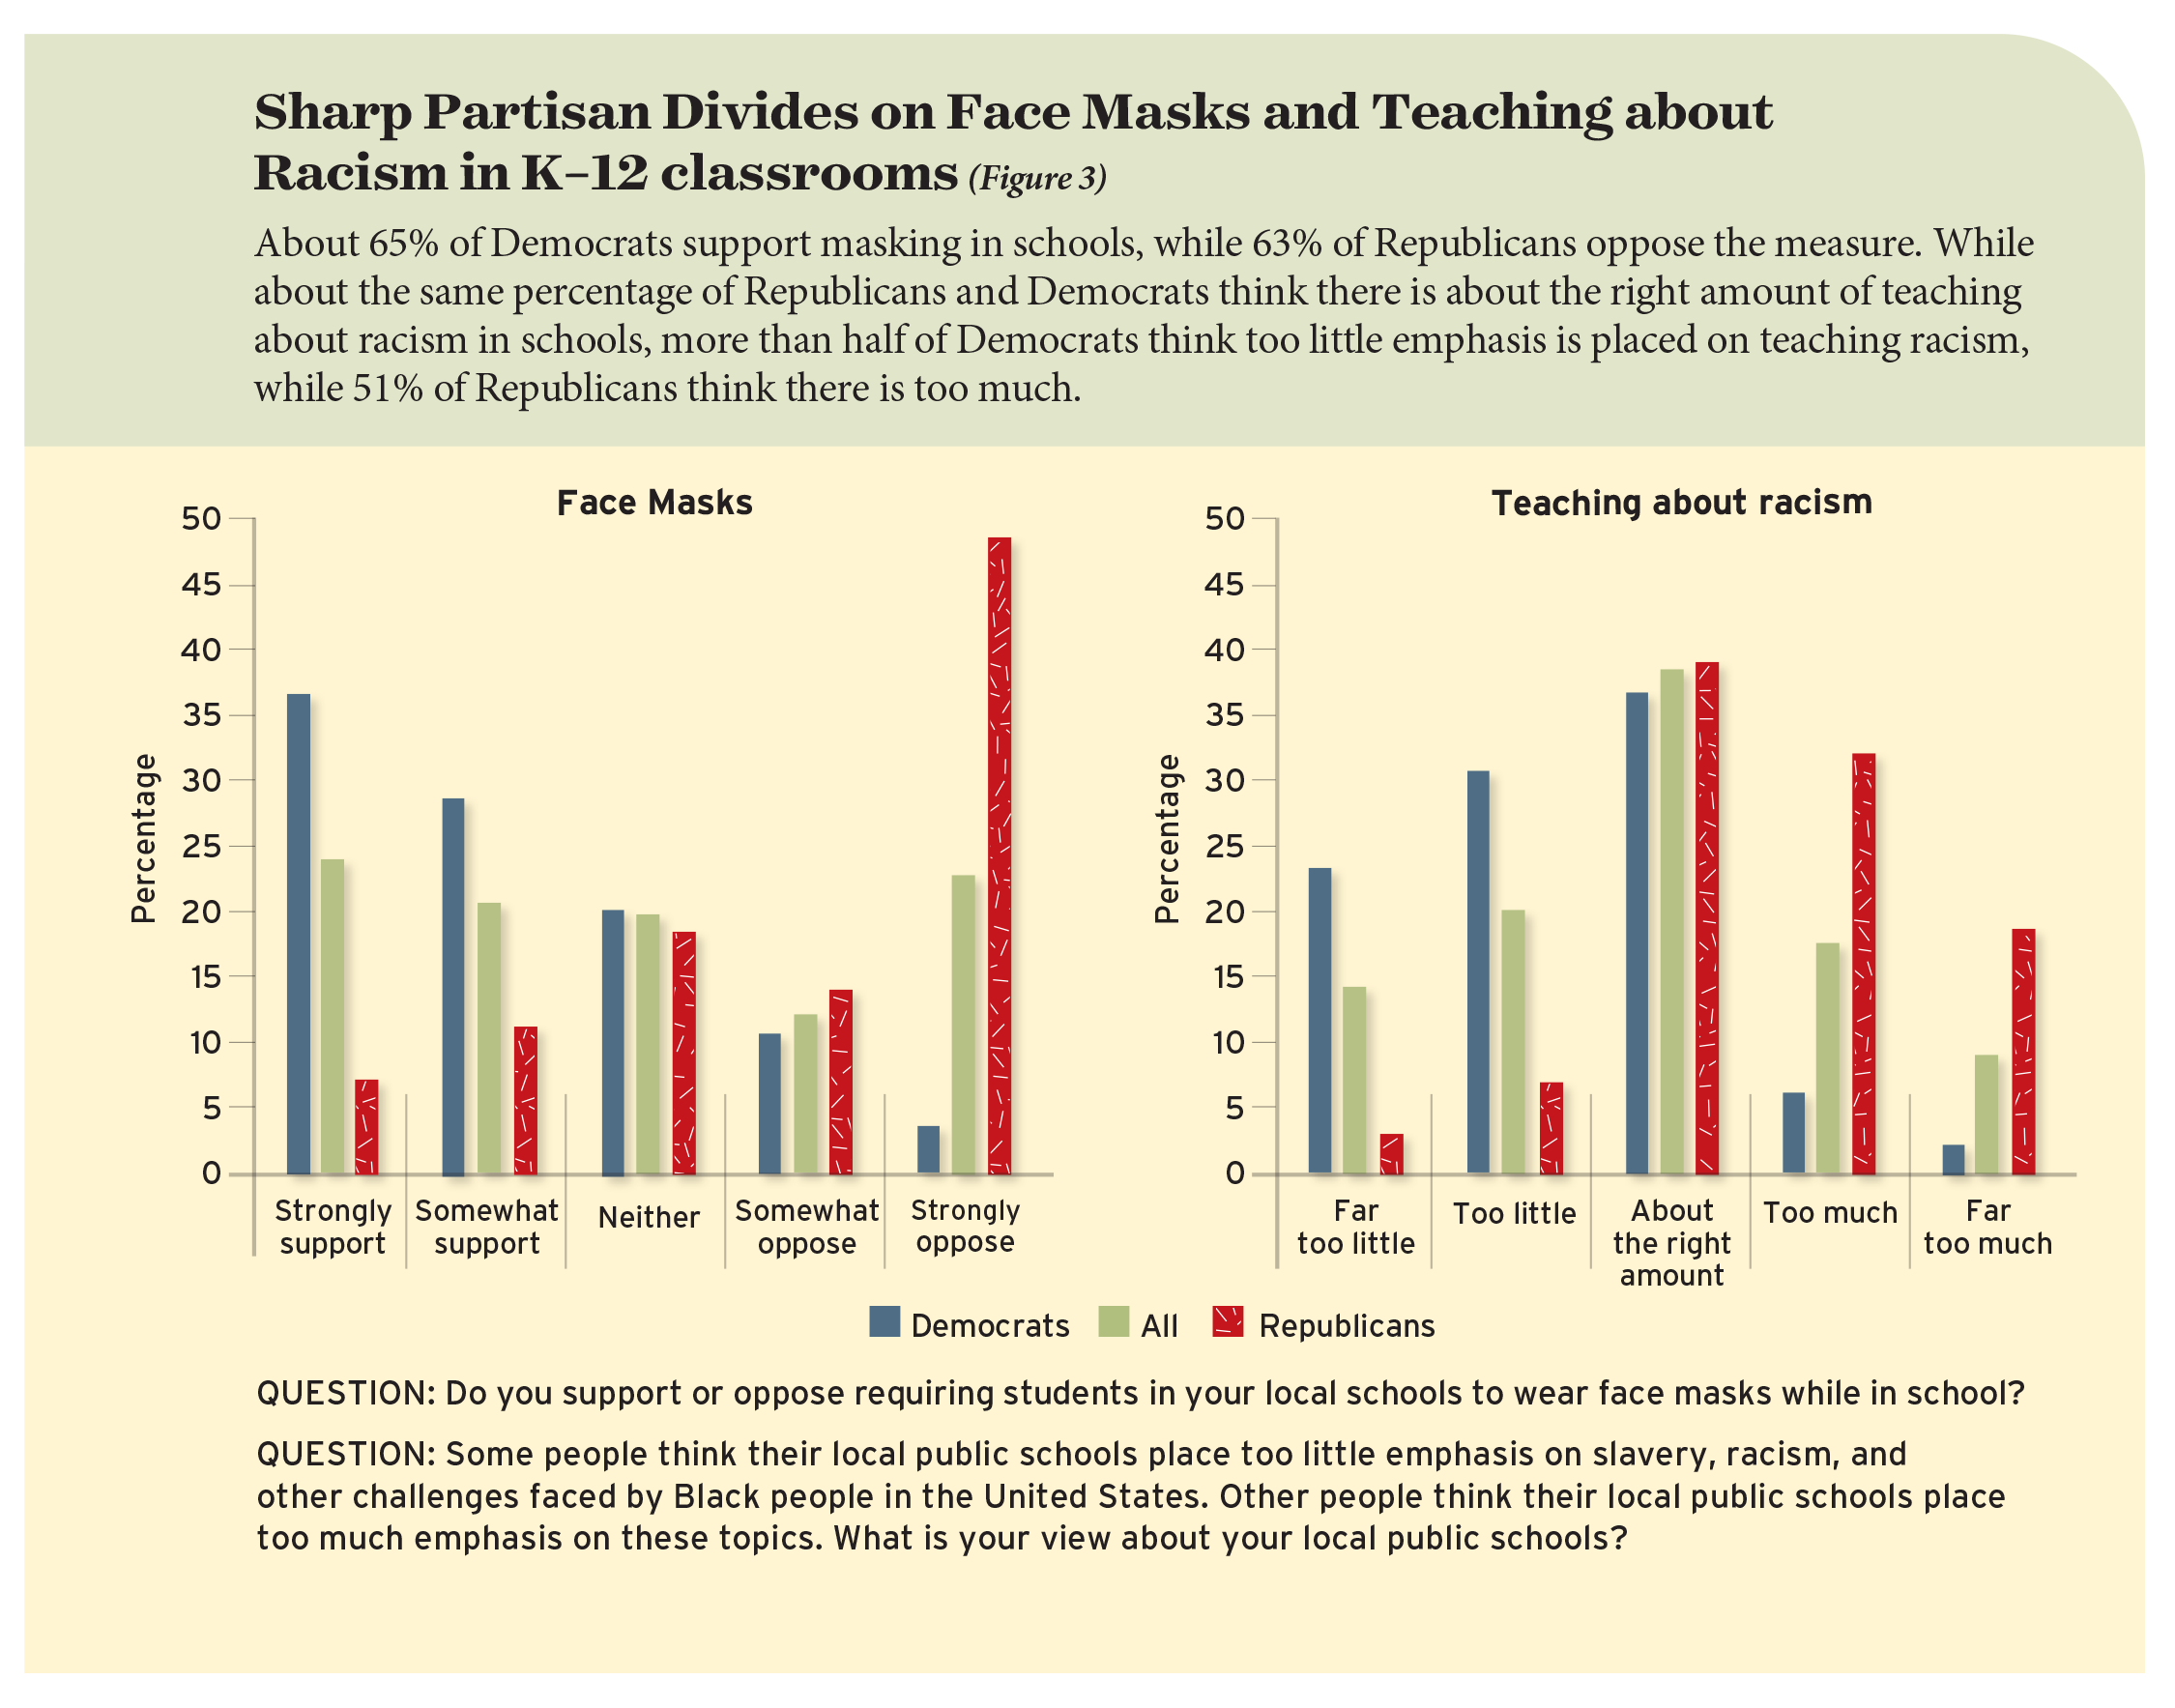
Mask mandates; teaching about racism. We also asked respondents for their opinions on two recent controversies: face mask mandates in schools to mitigate the spread of Covid-19 and the heightened attention in K–12 classrooms to racism as a part of the historical and contemporary American experience (see Figure 3). Neither support for (45%) nor opposition to (35%) face masks commands a majority, with the remainder taking a neutral position. Attitudes toward teaching about racism are also broadly distributed. A plurality of 39% thinks their local public schools are placing about the right amount of emphasis on slavery, racism, and other challenges faced by Black people in the United States. However, 35% of Americans think their local public schools place too little emphasis on these issues, while 27% think there is currently too much emphasis placed on them.
Both topics are subject to exceptionally large partisan disagreements. About 65% of Democrats support face mask mandates in schools, with 15% opposed. Among Republicans, the breakdown is essentially the reverse: 19% in support and 63% opposed. With respect to teaching about racism in the classroom, there is no meaningful distinction between the proportions of Democrats (37%) and Republicans (39%) who are content with their local schools’ current approach. The partisan difference appears when we consider those who are displeased with the status quo. Fully 54% of Democrats think their local schools are placing too little emphasis on racial matters, compared to 10% of Republicans. Meanwhile, 51% of Republicans think there is currently too much emphasis on racial matters, compared to 9% of Democrats.
Partisanship and Public Opinion over Time
While the divides between Democrats and Republicans on face masks and teaching about racism are eye-popping, they do not shed light on whether public opinion on education issues is growing more partisan in general or if these new issues are an exception to the rule. The Education Next survey offers a unique opportunity to explore the extent to which partisan differences have changed over time. We have a long tradition of repeating questions each year—with some items going all the way back to our inaugural survey in 2007—to track rising or falling public sentiment. We frequently pull from our polling archive to contextualize the current year’s results, and we described the long-term trends in detail in 2016 to mark the poll’s 10th anniversary (see “Ten-Year Trends in Public Opinion,” features, Winter 2017”). This year, we leverage this wealth of longitudinal public-opinion data to understand the evolving role of partisanship in the public’s attitudes toward education.
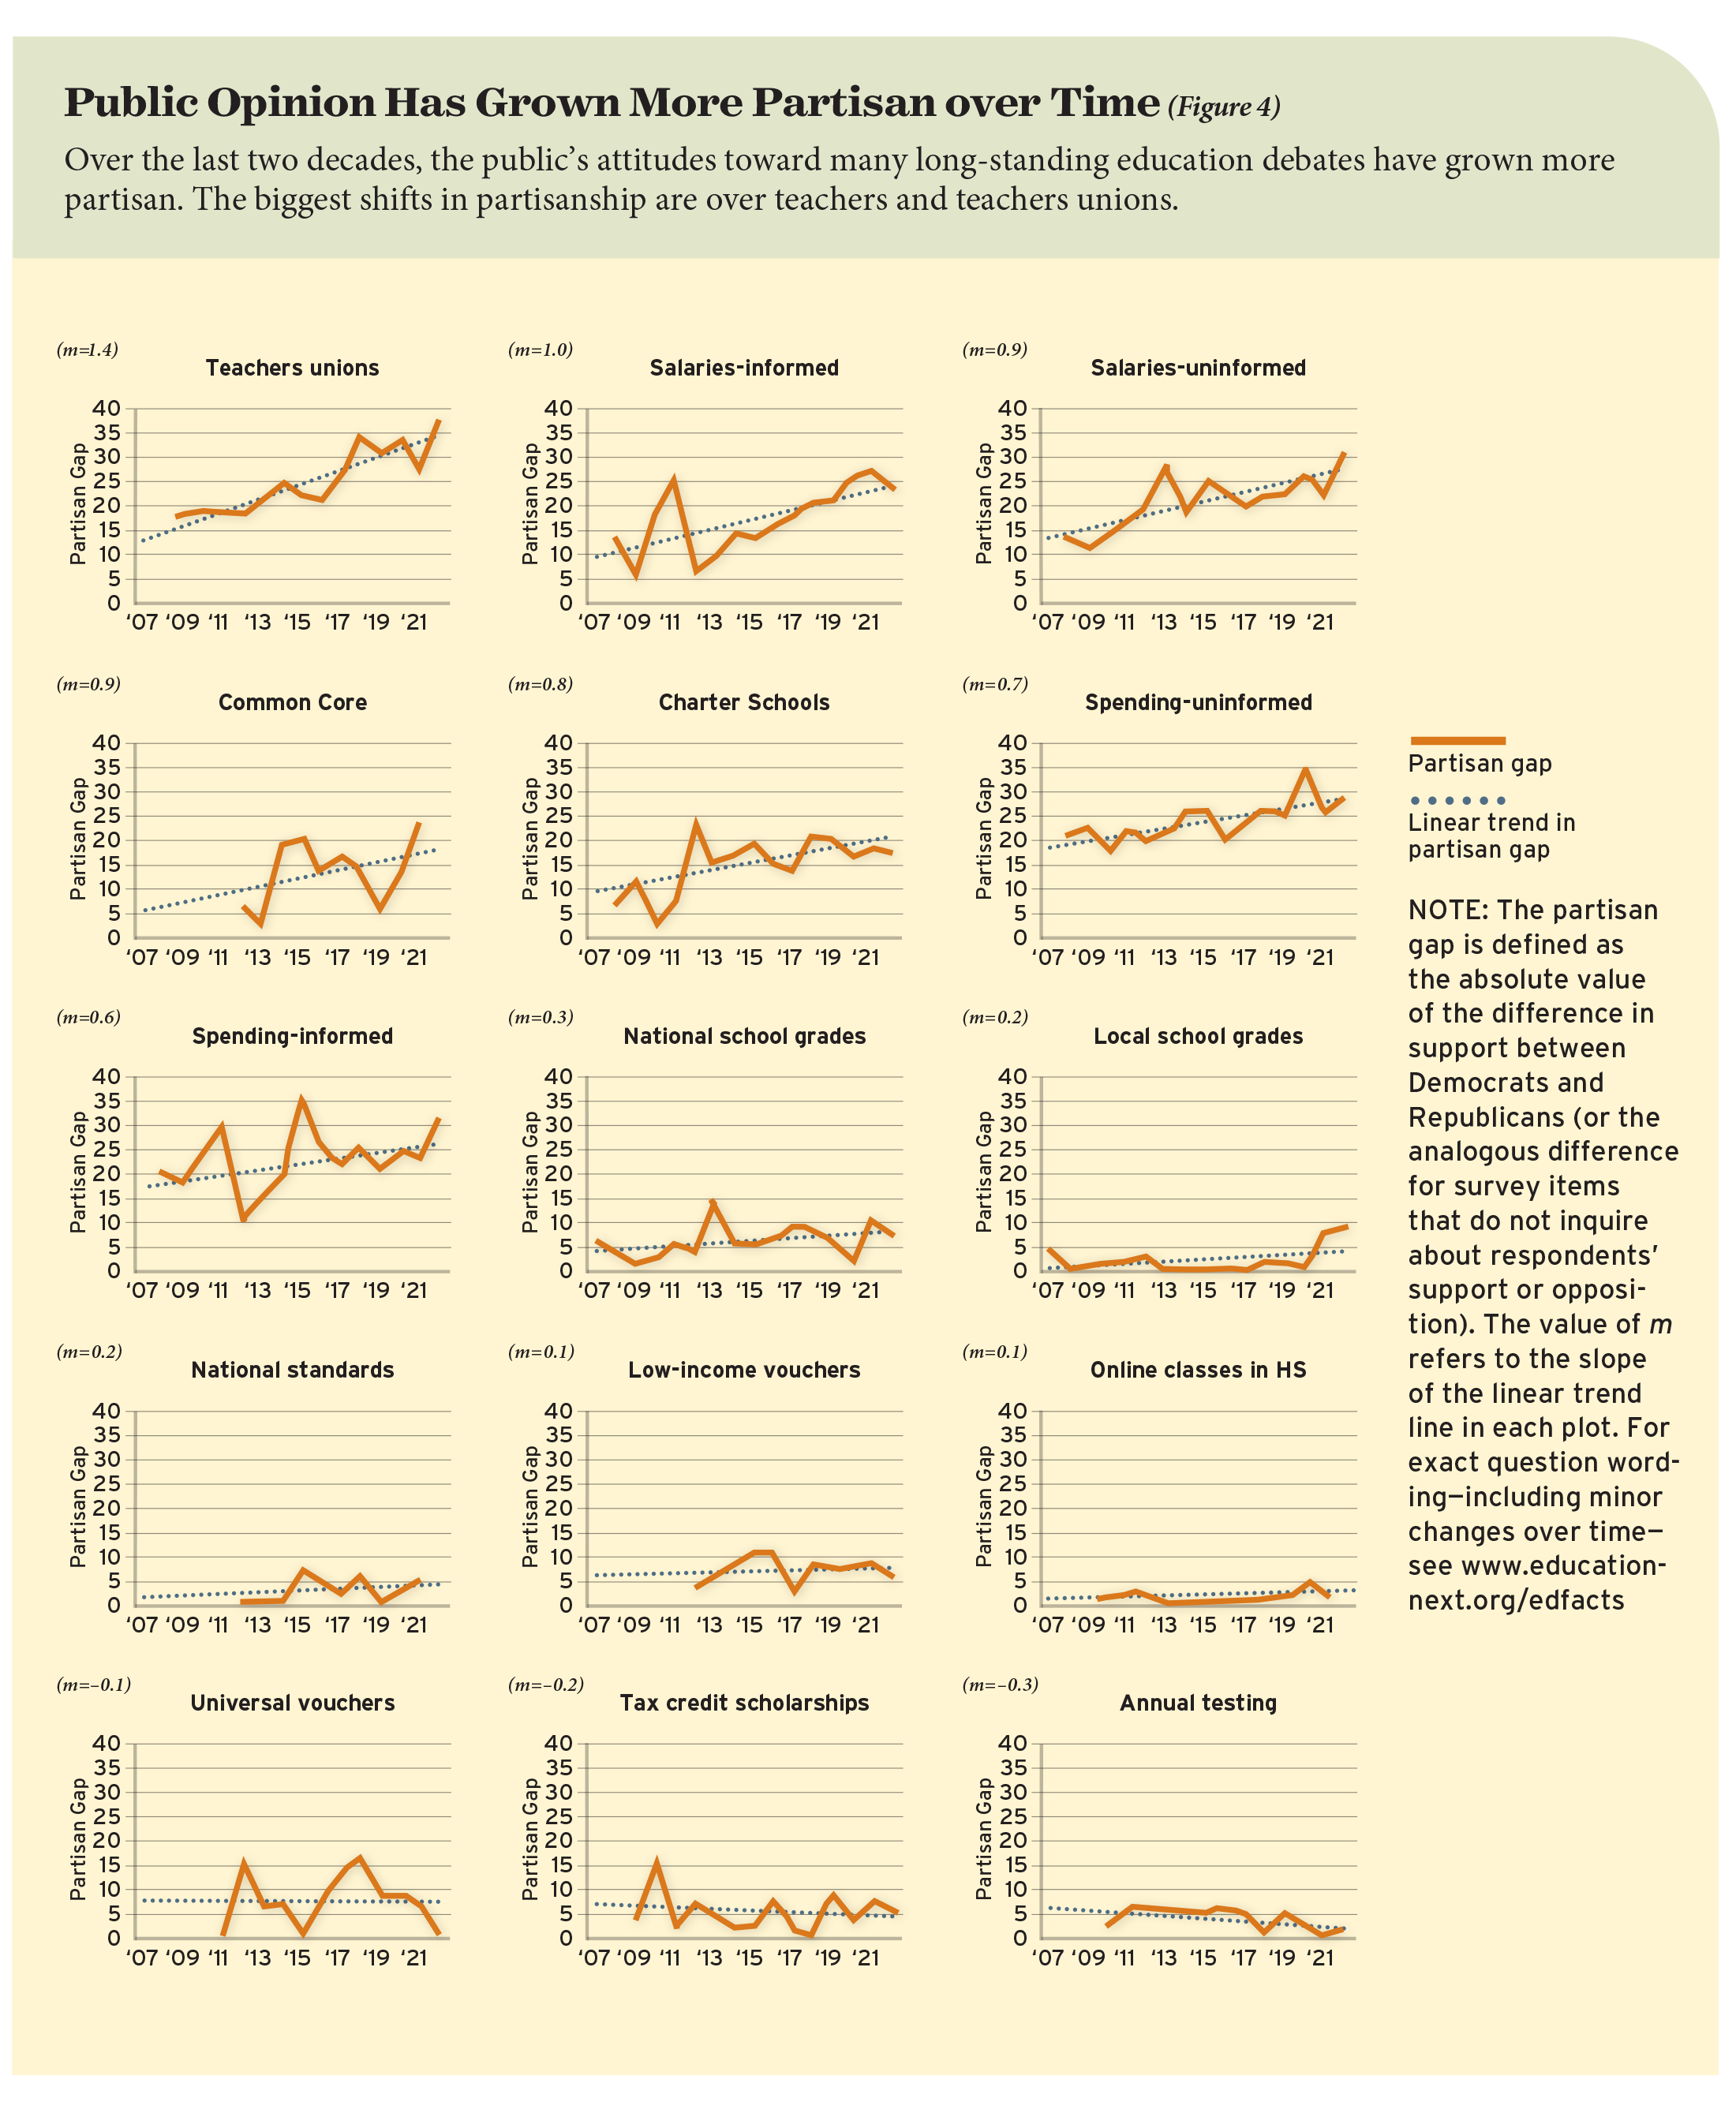
There are 15 survey items that have appeared in identical or near-identical forms over the course of at least 10 years. In Figure 4, we plot the absolute value of the partisan gap (the difference in support between Democrats and Republicans or the analogous difference for survey items that do not inquire about respondents’ support or opposition) for each item over time. We then fit a linear trend (the dotted line) to capture the average yearly rate of change in the partisan gap. The value m in the upper-left corner of each plot displays the slope of each line. This approach allows us to observe which issues have grown more partisan over time, which issues have held steady in this regard, and which issues have become less partisan.
Note that this approach does not provide evidence for or against the influence of a related—and often conflated—phenomenon: partisan polarization. Polarization refers to the extent to which people have adopted more extreme views relative to more centrist or moderate views (that is, a shift of opinion toward the poles at the expense of the middle). Growing partisan gaps could be the result of heightened polarization if Democrats and Republicans are systematically shifting from moderate positions (such as “neither support nor oppose” for many of the survey items) toward firm positions of support or opposition. However, growing partisan gaps could also be the result of greater internal consistency in each party (that is, rank-and-file Democrats increasingly expressing views that align with the conventional Democratic position, and likewise for Republicans), even if there is no greater tendency toward more extreme positions. The latter phenomenon is often referred to as partisan sorting.
The difference is not just academic. In the case of polarization, the potential middle ground is truly vanishing. In the case of sorting, the opportunity for compromise and consensus remains, but there may be strong institutional barriers to achieving it. Because our analysis here does not distinguish between the two, we argue only that public opinion on education is growing increasingly partisan.
Teachers and their unions. The biggest shifts in partisanship show up on the survey items that inquire about teachers and their unions. Democrats tend to be more supportive of higher salaries for teachers and typically view teachers unions more favorably than their Republican counterparts do. The partisan gap on teacher salaries has increased substantially over time. In the version of the question in which respondents are told the average teacher salaries in their states, the gap has increased by about 1 percentage point annually. In the version of the question without salary data, the gap has increased by about 0.9 percentage points per year.
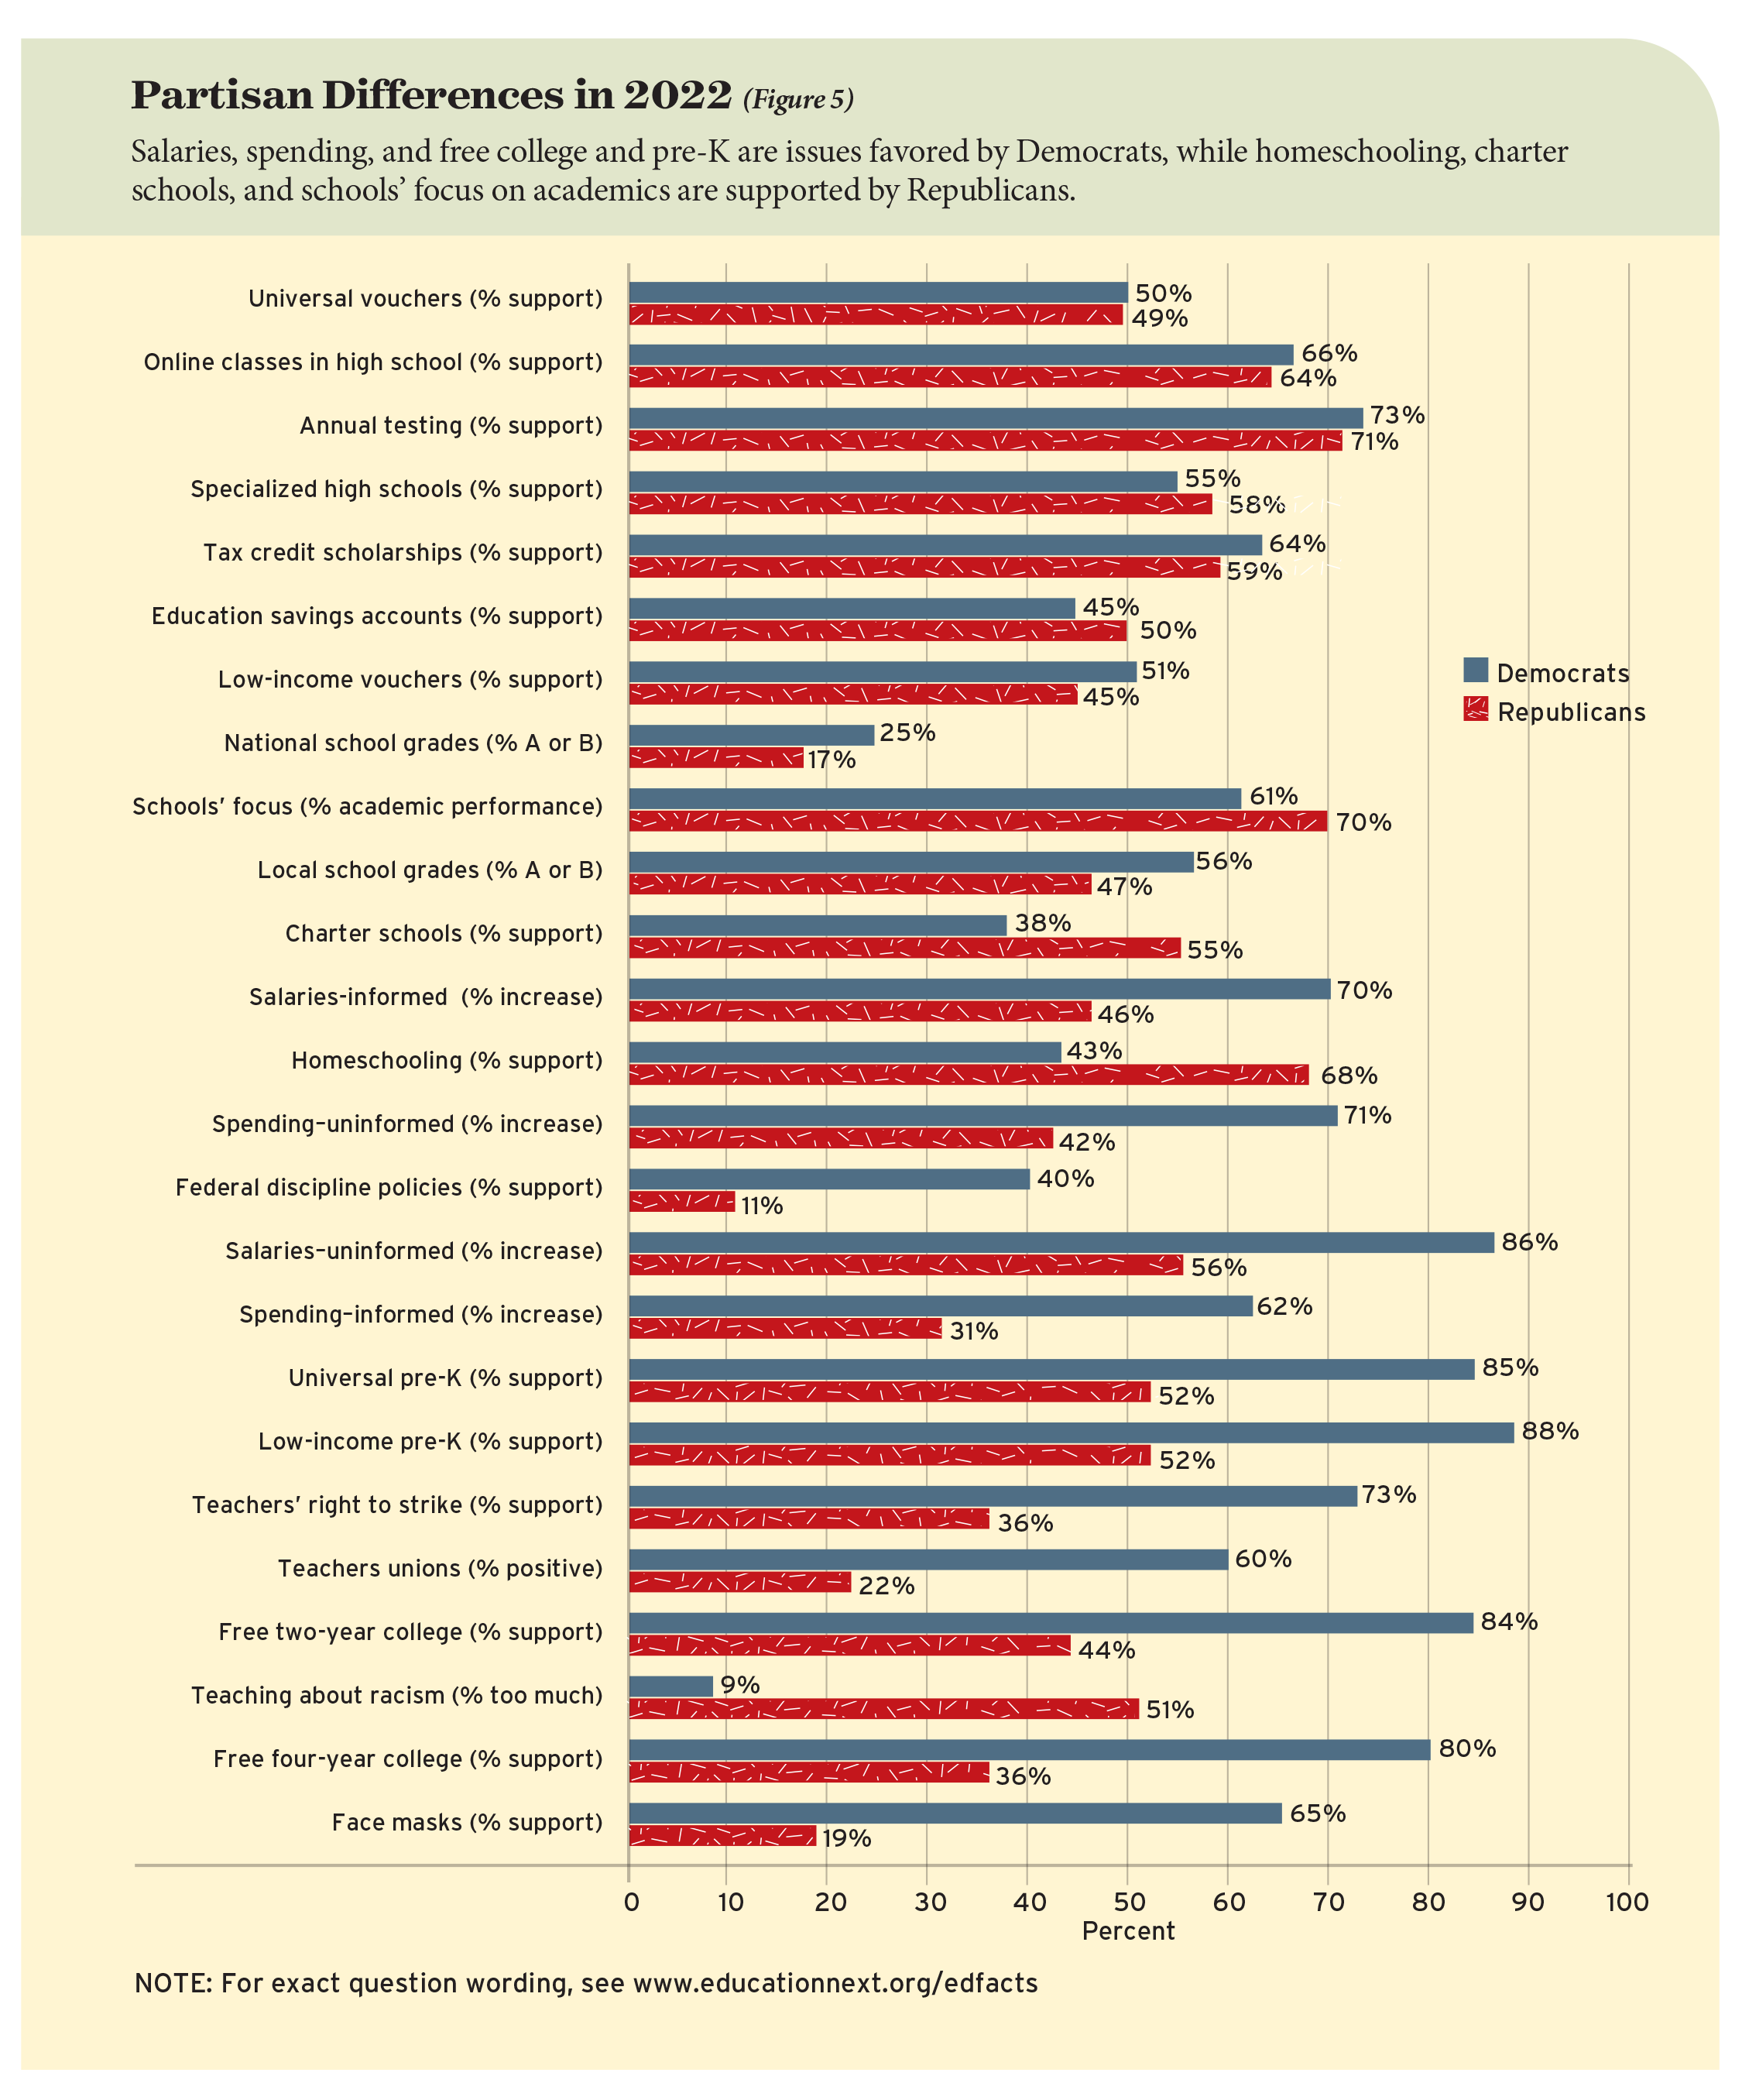
Attitudes toward teachers unions have diverged even more dramatically. The partisan gap on views of teachers unions has seen a yearly increase of about 1.4 percentage points on average. In 2022, the difference between Democrats and Republicans in positive evaluations of teachers unions is nearly 40 percentage points (see Figure 5). As we consider the role of partisanship in relation to many of the longstanding debates in the politics of education, the largest changes appear to revolve around Democrats’ and Republicans’ shifting attitudes toward teachers, how much they ought to be compensated, and how much influence they ought to have over schools.
National academic standards. The political battle over the Common Core State Standards peaked as the Obama administration came to a close and the 2016 presidential election campaign began in earnest. Although support for the standards declined across the board as they encountered political resistance, Democrats remain more supportive of the Common Core than Republicans. However, the intensity displayed in debates over this issue—as exhibited by the large partisan gaps in the 2014, 2015, and 2016 iterations of the survey—was consistently more muted when we asked a question that did not mention the Common Core “brand” but simply referred to K–12 academic standards that were the same across states.
We can observe the same dynamic from a different perspective by examining the changing partisan gaps for the two versions of this question. In 2012 and 2013, before the standards became entangled in national politics, the partisan gap in support for the Common Core was only a few percentage points wide. However, over the next few years, this gap increased by about 0.9 percentage points annually. By contrast, the partisan gap for the generic question about national standards started smaller and only increased by about 0.2 percentage points per year.
Education spending. Our analysis also reveals moderate increases in partisanship for questions about overall education spending (which Democrats are more likely to want increased) and charter schools (which garner more support among Republicans). On the version of the education-spending question in which respondents are told average per-pupil expenditures in their local school districts, the partisan gap has increased by about 0.6 percentage points per year. On the version of the question that does not supply this information, the partisan gap has increased by a similar rate of about 0.7 percentage points per year.
Charter schools. The partisan gap on charter schools is growing slightly faster: about 0.8 percentage points annually. This conspicuous increase is unique among the various school-choice initiatives we have tracked over the years. However, support for the general concept of school choice is highly divisive, with 60% of Republicans, but only 41% of Democrats, expressing a favorable position.
Opinion on school quality. The public’s perceptions of school quality in their own communities and nationwide are also more partisan than they were in the first few years of the Education Next survey. Historically, the proportions of Democrats and Republicans who award their local public schools a grade of an A or a B have differed little or not at all. However, respondents’ assessments of their local schools have diverged along party lines by about 0.2 percentage points per year on average, with most of that change concentrated in the last two years as Republicans evaluated their local schools less positively than their Democratic counterparts.
By contrast, views of schools nationwide have shown larger differences along party lines over the years, with a slightly higher proportion of Democrats giving the nation’s schools an A or a B grade. The national assessments have diverged by about 0.3 percentage points per year on average. Although the annual shifts are modest, they reveal a growing role for partisanship over time in the public’s evaluations of the public school system.
Stability and convergence. Not every longstanding debate is increasingly shaped by partisanship. The partisan gap on annual testing—which has the support of more than 70% of both Democrats and Republicans—has actually been decreasing by about 0.3 percentage points per year on average. We also observe slight reductions in the partisan gaps on tax credit scholarships (0.2 percentage points per year) and universal vouchers (0.1 percentage points per year), as well as trivial increases in the partisan gaps on online classes in high school (0.1 percentage points per year) and low-income vouchers (0.1 percentage points per year).
In short, although partisanship may be playing an increasingly important role in public opinion on many education issues, this dynamic is not universal. With respect to attitudes toward online learning and some forms of school choice, the differences between Democrats and Republicans remain largely unchanged over the last decade. Attitudes toward annual testing have even begun to converge.
Newer topics. For some issues examined in our survey we have fewer historical data points, and the current magnitude of the partisan gap varies considerably among these issues. We observe relatively modest differences between Democrats and Republicans in their support for specialized high schools (4 percentage points), education savings accounts (6 percentage points), and how much schools should focus on students’ academic performance versus their social and emotional well-being (an 8-percentage-point difference in the average value assigned to academic performance). On the other end of the spectrum, we see potent partisan disagreements in support for face-mask mandates in schools (46 percentage points), free public four-year and two-year college (44 and 40 percentage points, respectively), teaching about racism in K–12 classrooms (a 42-percentage-point difference in the proportion indicating that local schools currently put “too much” emphasis on the issue), teachers’ right to strike (36 percentage points), low-income pre-K (36 percentage points), and universal pre-K (32 percentage points). Many of these issues are relatively new to the mainstream political agenda in the United States, suggesting that some elements of the contemporary debate have shifted toward territory that may be less amenable to the cross-party consensus building that has characterized education policymaking over the last few decades.
Conclusions
After holding steady during the last two disruptive and difficult years, the public’s perceptions of school quality—both close to home and around the country—have declined slightly. This shift has corresponded with an uptick in support for a variety of reforms that may have lost some of their luster during the pandemic as communities struggled to maintain even the status quo. As the country anxiously seeks to put the worst of the crisis behind it, public opinion on many of these proposed initiatives has reverted back to form.
But not everything is as it used to be. New issues have moved to the forefront of the education-policy debate, garnering unusually partisan reactions. Among the issues that have hardened the political battle lines are:
- the role of teachers unions
- Covid-19 mitigation measures
- efforts to expand the range of fully publicly funded education downward to pre-K and upward to college
- the form and content of K–12 instruction regarding race and racism
The rising role of partisanship in education politics is not merely a function of the recent emergence of exceptionally politicized issues. The public’s attitudes toward many longstanding education debates have also grown gradually but undeniably more partisan over the last two decades. There are exceptions to this pattern, and, as a whole, the field of education still appears to be riven by smaller partisan divides than many other domains of public policy and debate. However, despite the education-policy community’s long history of trying to keep political pressures at arm’s length, public opinion on education issues seems to be increasingly drawn into the powerful current of partisanship in contemporary American politics.
David M. Houston is assistant professor of education policy at George Mason University. Paul E. Peterson is Henry Lee Shattuck professor of government at Harvard University, director of Harvard University’s Program on Education Policy and Governance (PEPG), and senior editor of Education Next. Martin R. West, the academic dean and Henry Lee Shattuck professor of education at the Harvard Graduate School of Education, is deputy director of PEPG and editor-in-chief of Education Next.
Survey Methods
The survey was conducted from May 2 to May 30, 2022, by the polling firm Ipsos Public Affairs via its KnowledgePanel®. The KnowledgePanel® is a nationally representative panel of American adults (obtained via address-based sampling techniques) who agree to participate in a limited number of online surveys. Ipsos provides Internet access and/or an appropriate device to individuals sampled for its KnowledgePanel® who agree to participate in the panel but lack the technology to do so. For individual surveys such as Education Next’s, Ipsos samples respondents from the KnowledgePanel®. Respondents could elect to complete this survey in English or Spanish. The exact wording of each question is available at www.educationnext.org/edfacts.
The total sample for the survey (3,641 respondents) consists of two separate subsamples. The first is a nationally representative, stratified general-population sample of adults in the United States (1,784 respondents). The second consists of American parents, stepparents, or foster parents of at least one child living in the respondent’s household who is in a grade from kindergarten through 12th (1,857 respondents). The parent sample includes oversamples of parents with at least one child in a charter school (305 respondents), parents with at least one child in a private school (310 respondents), Black parents (283 respondents), and Hispanic parents (429 respondents). The completion rate for this survey is 50%.
For parents, after initially screening for qualification, we created a roster of the children in kindergarten through 12th grade who live in their household by asking for the grade, gender, race, ethnicity, school type (traditional public school, charter school, private school, or home school), and age for each child. In all, the parent sample provided information on 3,204 K–12 students. We asked a series of questions about the schooling experiences for each of these children. After completing these questions about each child individually, parents proceeded to the remainder of the survey. We analyze responses to questions about individual children at the child level. We analyze all other questions at the respondent level.
For both student-level and parent-level analyses, we use survey weights designed for representativeness of the national population of parents of school-age children. For analysis of the general-population sample, we use survey weights designed for representativeness of the national population of adults.
Respondents identified themselves as Republicans, Democrats, or independents at the time they were recruited to participate in the Ipsos surveys, not on the day their responses to the Education Next survey were obtained. If respondents did not indicate either Republican or Democrat, they were asked if they think of themselves as closer to the Republican Party or the Democratic Party. If respondents selected either party, we treat them as Republicans or Democrats in our analyses of partisanship. Republicans compose approximately 44% of the general-population sample; Democrats compose approximately 53% of the general-population sample. When disaggregating parents’ responses by partisanship, we refer to the political party identification of the parent who completed the survey. We classify a state as “blue” if the state popular vote favored Joe Biden in the 2020 presidential election and “red” if the state popular vote favored Donald Trump.
In our analysis of partisanship and public opinion over time, we define the partisan gap as the absolute value of the difference in support for a given issue between Democrats and Republicans (or the analogous difference for survey items that do not inquire about respondents’ support or opposition). For each item, we estimate the average annual change in the partisan gap by fitting a linear regression line to describe the relationship between partisan gap and year. The survey items in this analysis feature identical or near-identical question wordings and response options over time. A description of minor changes in question wordings and response options is available at www.educationnext.org/edfacts.
Information used in the experiments involving school-district spending were taken from the 2018–19 National Center for Education Statistics (NCES) Common Core of Data’s Local Education Agency Finance Survey, the most recent data available at the time the survey was prepared. Information used in the experiments involving state teacher salaries were drawn from Table 211.6 of the NCES Digest of Education Statistics, 2021 (2020–21 school year), the most recent data available at the time the survey was prepared.
Percentages reported in the figures and online tables do not always sum to 100 as a result of rounding to the nearest percentage point.
More from the 2022 Education Next Survey: “Parental Anxieties over Student Learning Dissipate as Schools Relax Anti-Covid Measures“
This article appeared in the Winter 2023 issue of Education Next. Suggested citation format:
Houston, D.M., Peterson, P.E., and West, M.R. (2023). Partisan Rifts Widen, Perceptions of School Quality Decline: Results from the 2022 Education Next survey of public opinion. Education Next, 23(1), 8-19.