In September, President Biden declared that “the pandemic is over,” but parents with school-age children will not soon forget the struggles of the prior two years. Starting in March 2020, nearly all school buildings nationwide closed and remained shuttered for the rest of that school year. These closures upended families’ routines, creating new challenges for parents’ work and children’s education.
In Fall 2020, a new school year started, but how school districts delivered instruction at the start of the year, and how they operated throughout it, varied widely. Many districts remained fully remote at the start of the 2020–21 school year. Many others reopened fully in-person. Others offered a blend of in-person and remote instruction. Over the course of the 2020–21 school year, districts’ instructional offerings shifted as the pandemic ebbed and flowed.
Many parents, frustrated with the lack of in-person schooling options, began to pull their children from public schools. During the 2020–21 school year, enrollment in public schools fell by an average of 3 percent nationally. These declines were larger in districts that reopened remotely compared to those that returned to in-person learning, but a careful look at enrollment data reveals that the story is more complicated than it would initially appear. That’s because the districts that chose to remain closed during the 2020–21 school year were already losing enrollment in the years leading up to the pandemic. These pre-pandemic declines make it challenging to determine how much of the enrollment drop that accompanied the pandemic was driven by districts’ decisions to remain remote in 2020–21. Nor have researchers yet examined whether enrollment losses continued into the 2021–22 school year.
We take advantage of newly compiled district enrollment data for all 50 states through 2021–22, the second full school year after the pandemic’s outbreak, to address these questions. After accounting for differential pre-pandemic enrollment trends, we find that enrollment impacts caused by school districts’ responses to the pandemic may have been as large as, if not larger than, enrollment impacts from the pandemic itself. In short, how districts chose to respond to the pandemic mattered—and may have consequences for their finances for years to come.
Studying Enrollment Choices Over Two Pandemic School Years
A growing body of research on the 2020–21 school year shows that districts that started the year fully remote lost larger shares of enrollment than districts that opened in person. District leaders and policymakers have wondered if enrollments would bounce back the next year. On one hand, families that left public schools during the first year of the pandemic because their district had remained remote might return to their child’s original school, leading to a rebound. On the other hand, parents might choose to leave their child in the new option, causing net enrollment to remain flat. A third possibility is that even more parents in the remote districts would leave their district in the second year, driving even larger enrollment losses.
To determine which of these scenarios is most accurate, we first group districts into three categories based on the cumulative amount of in-person learning time they offered students during the 2020–21 school year. We then examine how district enrollments changed within each group during the two school years following the onset of the pandemic.
The data for our study come from the American Enterprise Institute’s Return to Learn Tracker, the American Community Survey, and USAFacts. The Return to Learn Tracker collected weekly information on modes of instruction for over 8,600 school districts during the 2020–21 academic year.
We categorized districts into three roughly equal groups based on their total in-person instructional offerings during the 2020–21 school year, with the third of districts with highest scores classified as “most in-person,” those with scores in the middle third classified as “middle-remote,” and those with scores in the lowest third classified as “most-remote.”
The Return to Learn Tracker’s enrollment data are drawn from state education department websites and include district-level student counts for the 2016–17 to 2021–22 school years. Forty-six states had both total and grade-level enrollment data that allow us to analyze changes in specific grade ranges. These analyses distinguish between grades 1 to 5 in “elementary school,” grades 6 to 8 in “middle school,” and grades 9 to 12 in “high school.” We also look separately at kindergarten enrollment, as parents may have delayed enrolling their children in school during the 2020–21 school year. In four states (Kansas, Kentucky, Rhode Island, and Tennessee), we only have total counts, which include prekindergarten enrollments that we could not separate from the total. We exclude these states from our grade-level analyses, and our measure of total enrollment in these states includes pre-K enrollment. All other state totals include only grades K–12.
Our final dataset includes enrollments for 8,226 public school districts from 2016–17 to 2021–22, covering approximately 89 percent of total K–12 enrollment in the 2019–20 school year. This sample is notably larger than prior studies examining reopening policies’ effects on district enrollment.
Descriptive Patterns
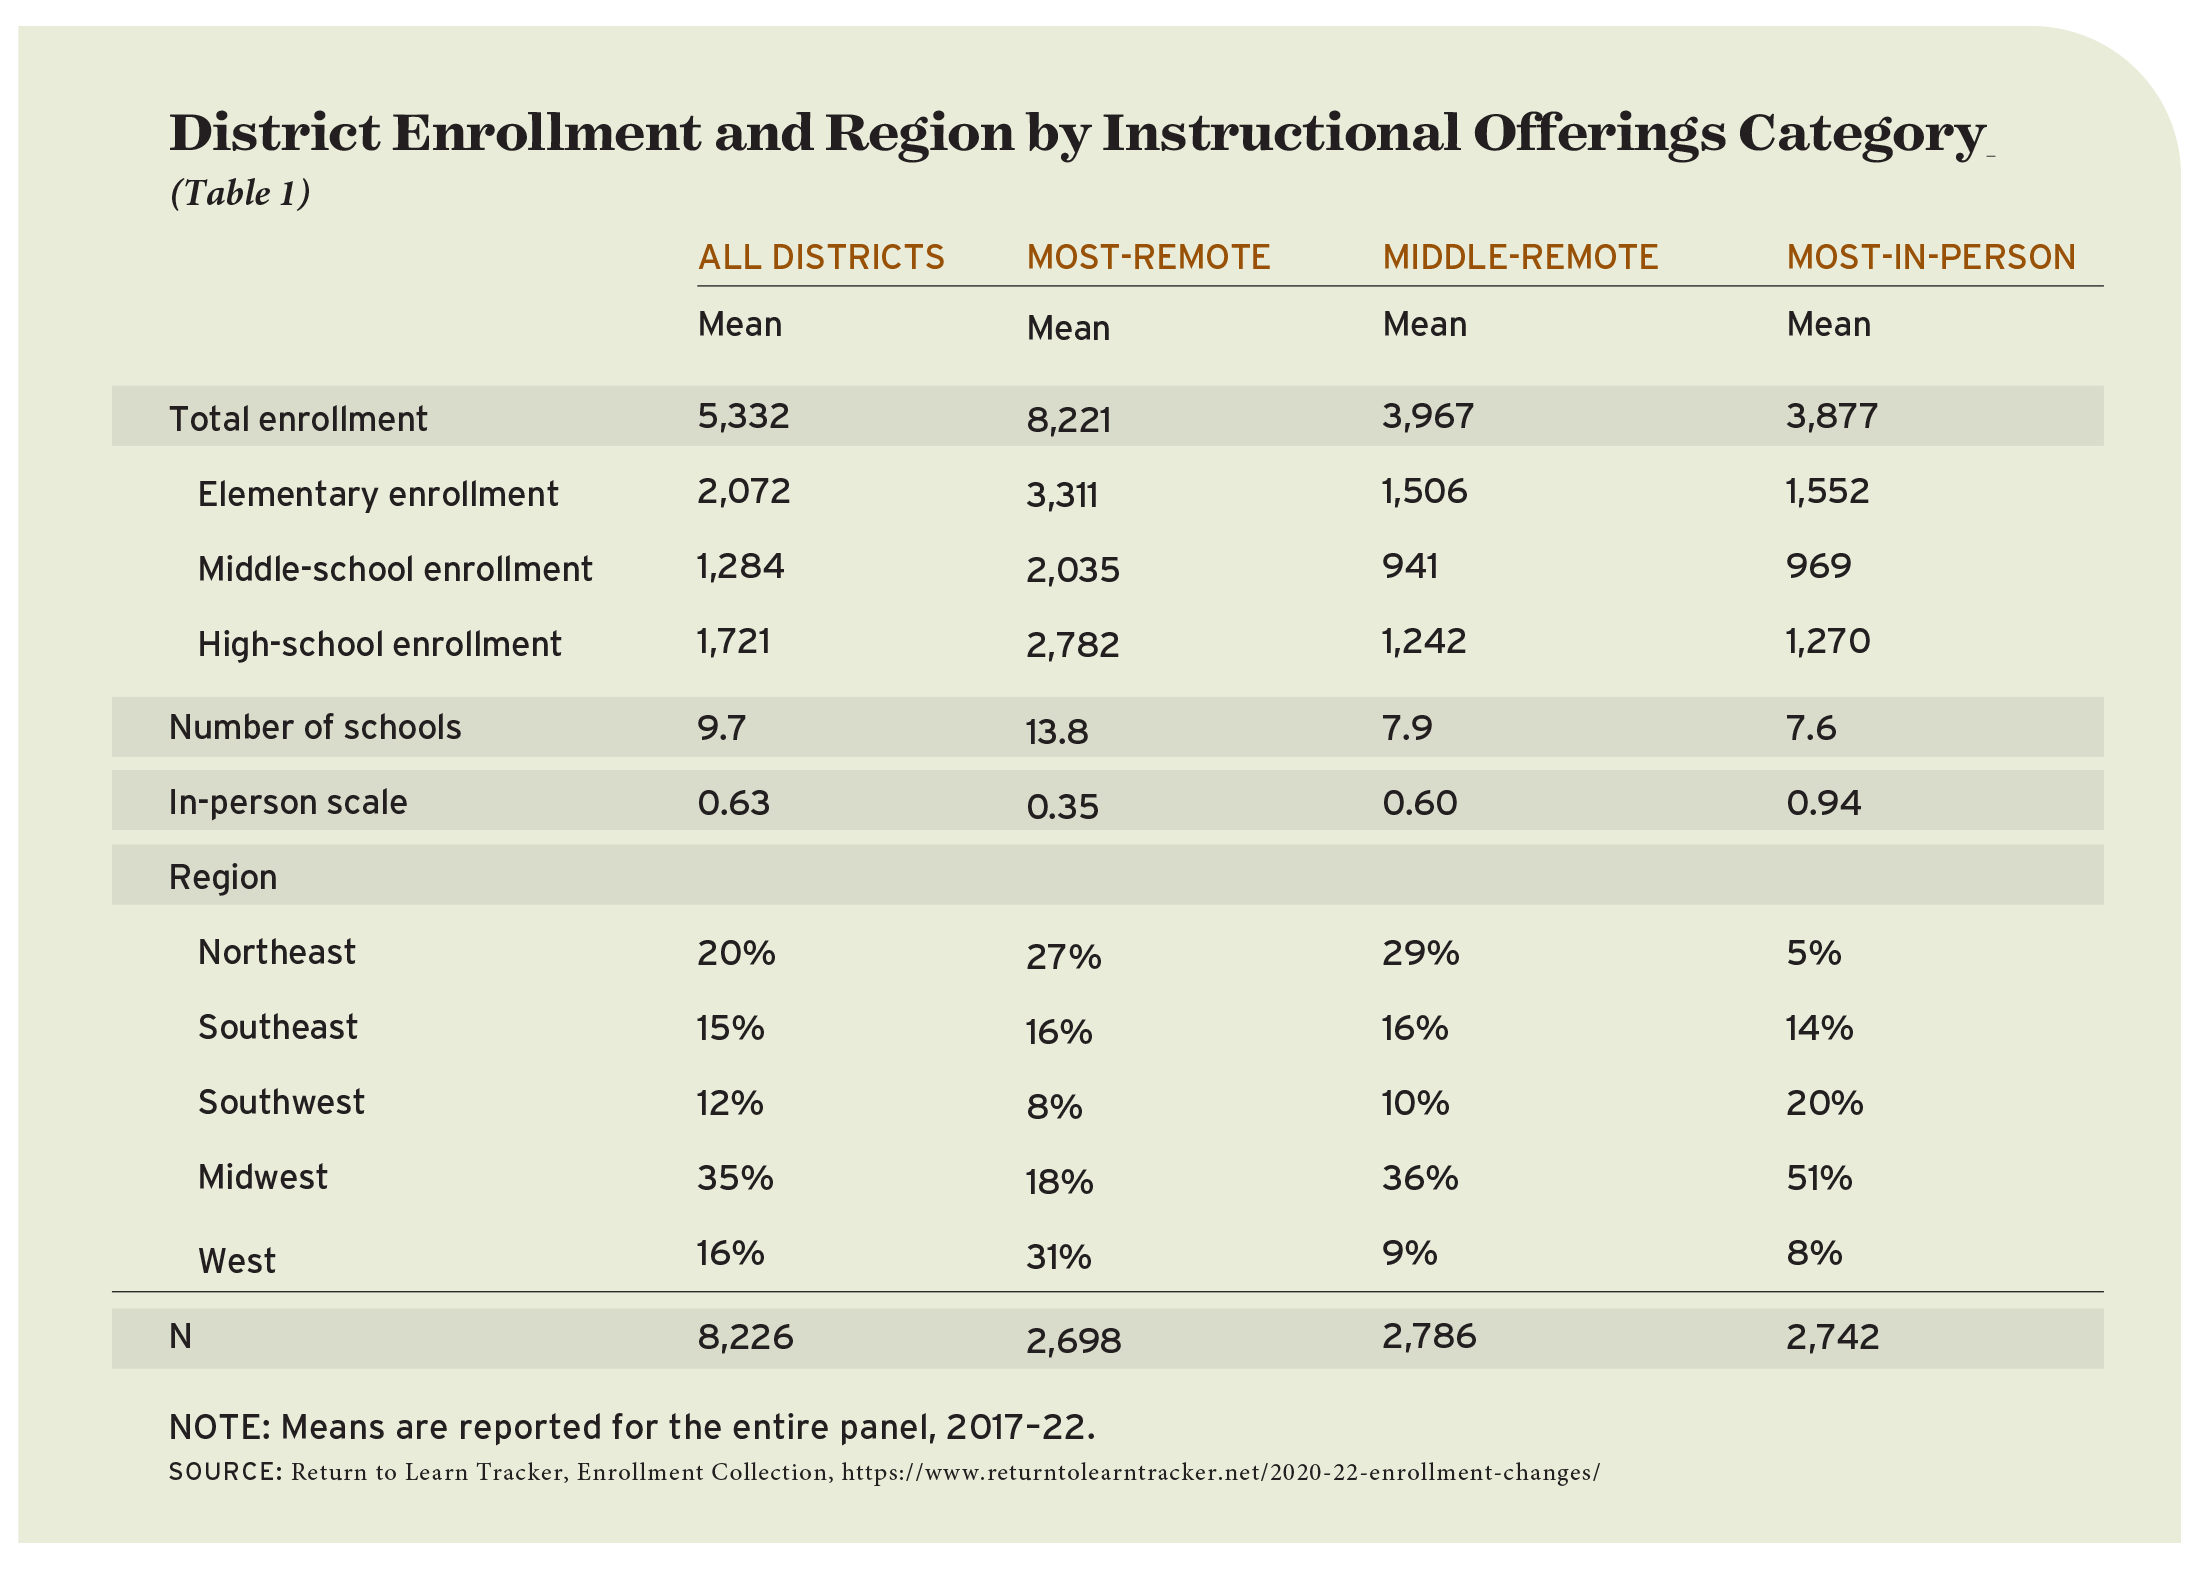
We first use the Return to Learn Tracker data to examine districts’ choices about how to deliver instruction in the 2020–21 school year (see Table 1). In the most-remote districts, in-person options were available to families for only about one third of the year. In contrast, the most-in-person districts offered in-person options for 94 percent of the year. The most-remote districts were larger, with roughly 8,000 students on average, as compared to fewer than 4,000 students in the other two groups. The most-remote districts were also concentrated in the West and Northeast census regions, while districts in the Southwest and Midwest were more likely to offer in-person instruction. The variation in districts’ choices was not purely geographic, however. Each region contained a substantial number of districts in each of our three groups.
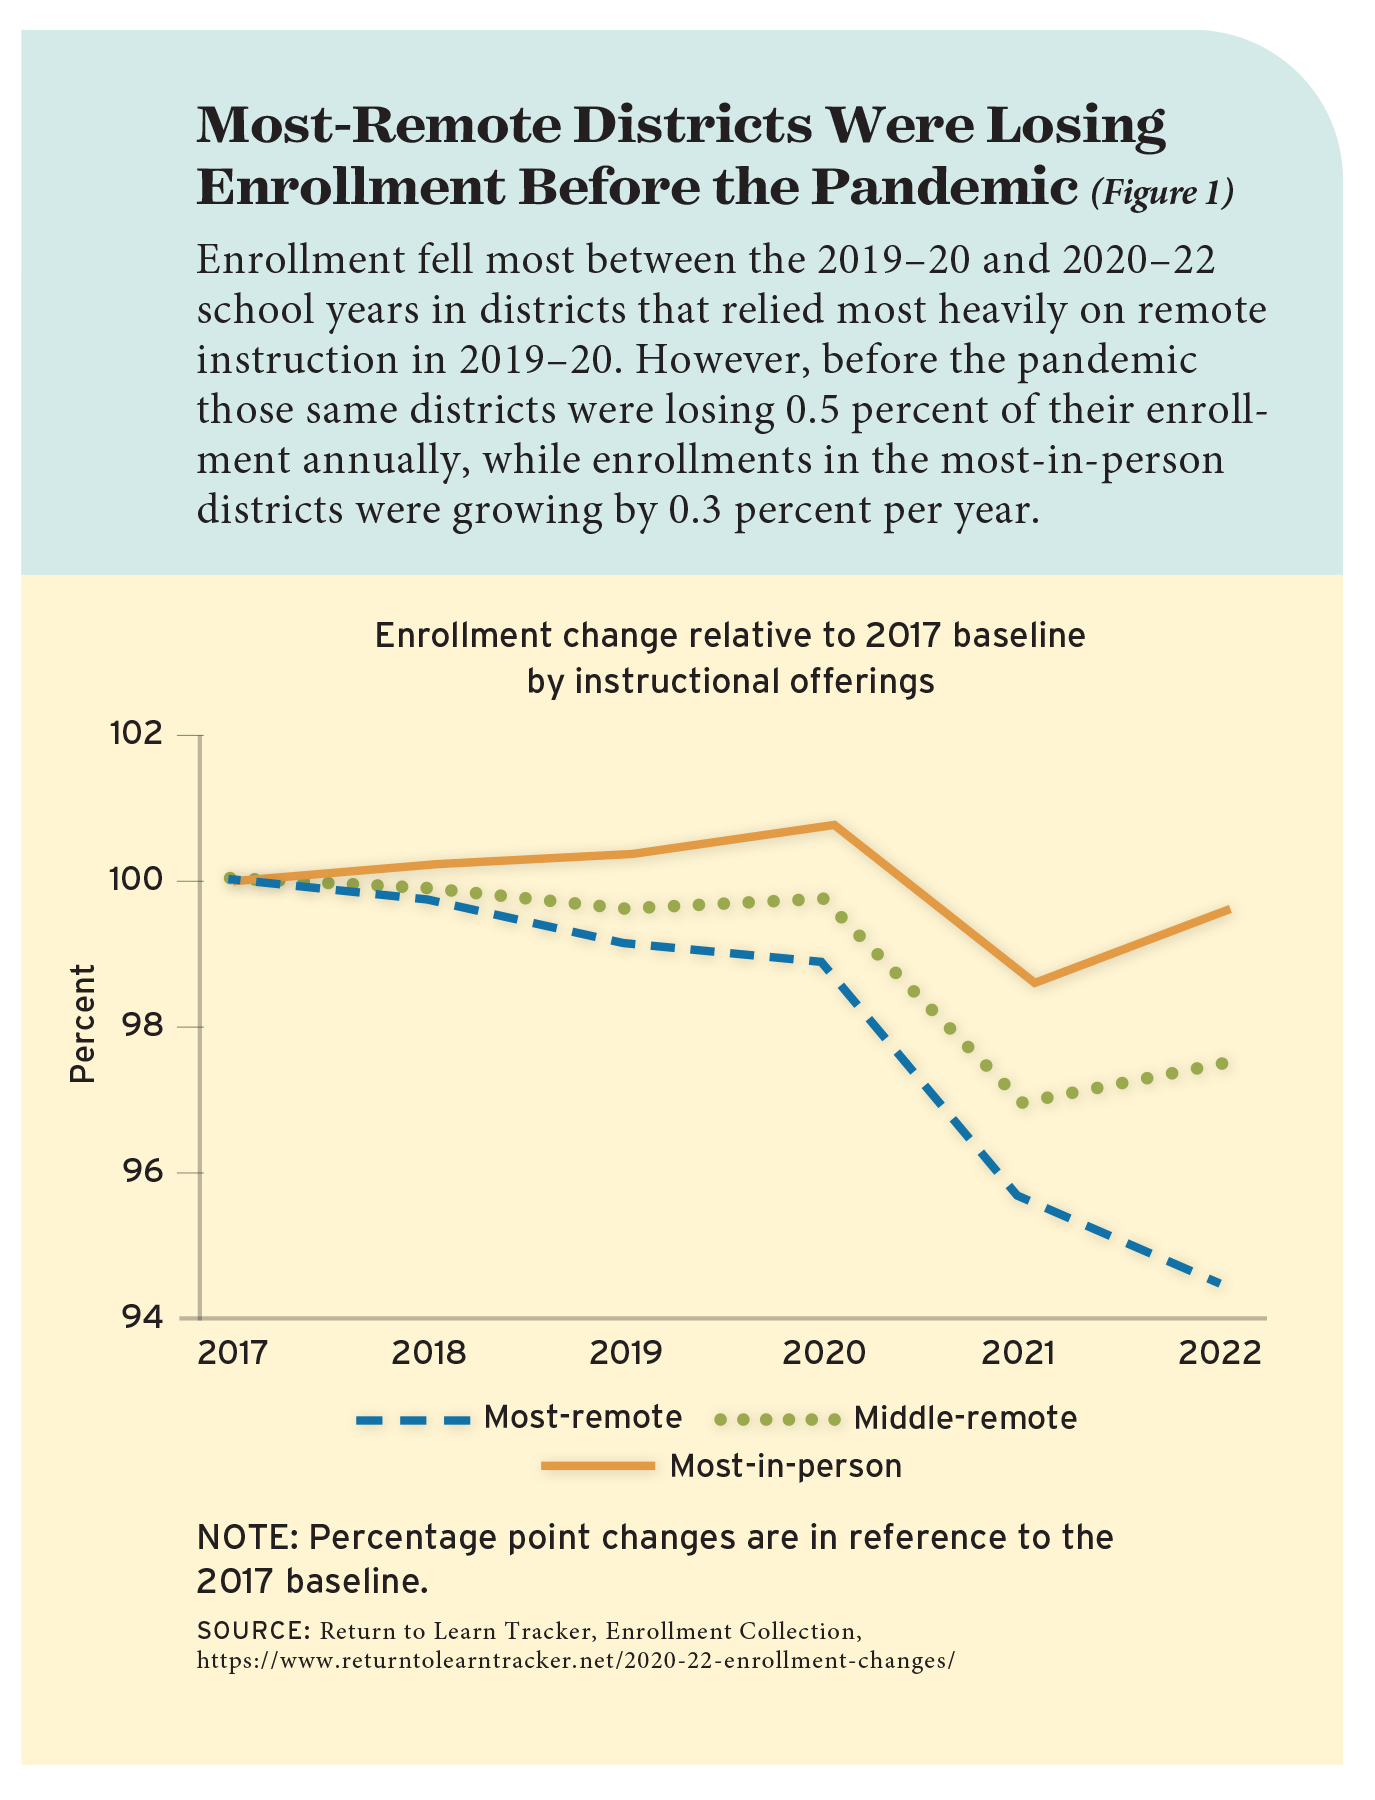
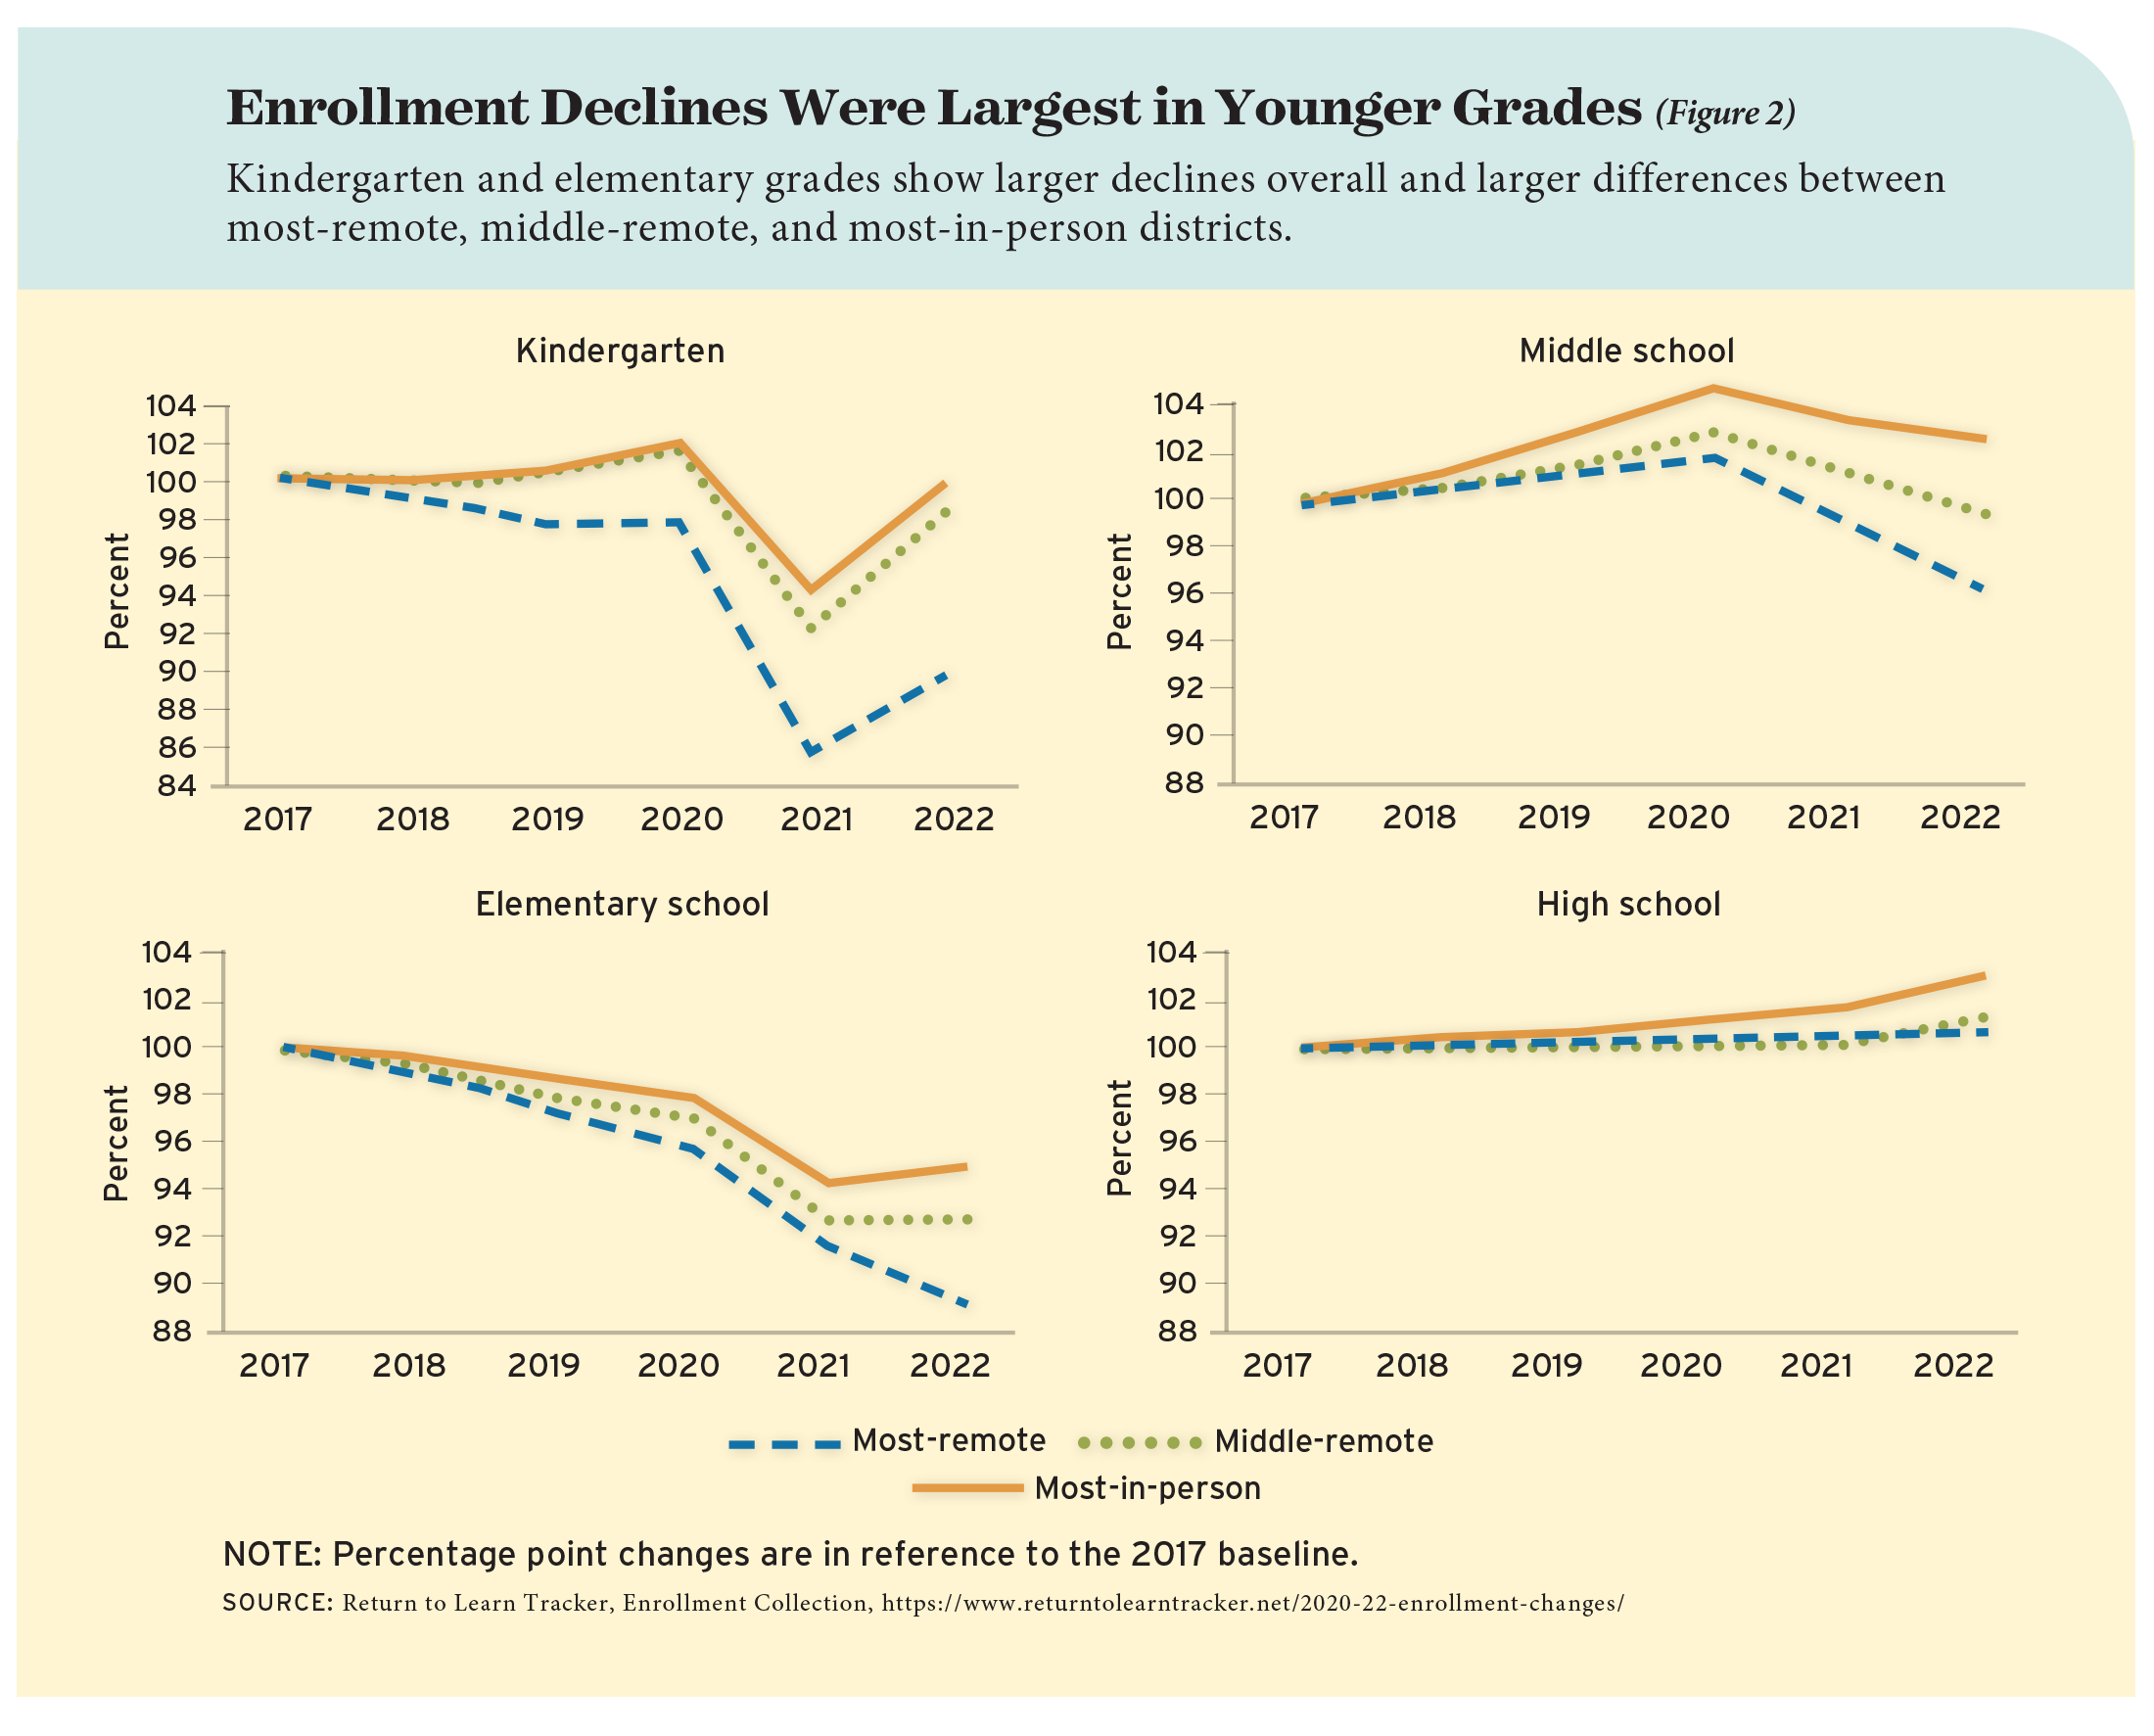
Our enrollment data confirm that the most-remote districts lost the most students in the 2020–21 school year, and those losses continued in 2021–22 (see Figure 1). The most-in-person districts saw the smallest declines in 2020–21 and regained much of those losses in 2021–22. In both years, middle-remote districts’ declines fell between these extremes. Kindergarten and elementary grades show larger declines overall and larger differences between categories (see Figure 2).
However, Figures 1 and 2 also reveal that trends in enrollment differed across the three district groups. The most-remote districts were losing roughly 0.5 percent of enrollment annually leading up to the 2019–2020 school year, while the most-in-person districts’ enrollments were trending upward by roughly 0.3 percent annually. To isolate enrollment changes caused by district’s instructional offerings, we must account for these diverging pre-pandemic trends.
A Closer Look
We use two related approaches to assess whether districts’ instructional offerings causally affected enrollment. Our first method estimates effects on average enrollment over the first two pandemic school years. Our second method allows us to look separately at enrollment in the first and second pandemic school years.
The first method compares enrollment changes between the 2019–20 and 2021–22 school years in the most-in-person districts to changes in districts with more remote instruction, which were the “middle-remote” and “most-remote” districts. By comparing districts only to themselves, these comparisons take into account any differences in district characteristics that might be correlated with their reopening policies. And by comparing districts only in the same year, they take into account any policies or events that affected enrollment nationwide.
We also control for changes in the number of school-age children living in each district and the severity of Covid-19 in each district in each year—two factors that could have affected enrollment independently of districts’ instructional choices. Finally, to address the diverging enrollment trends across most-remote, middle-remote, and most-in-person districts evident in Figure 1, we adjust for the average pre-pandemic trend in each group. We assume that, after adjusting for districts’ characteristics and these pre-pandemic enrollment trends, any remaining differences in the enrollment changes districts experienced are due to their instructional offerings.
This first method shows that the most-remote districts saw enrollment declines that were 1.3 percentage points larger than those in the most-in-person districts across both pandemic school years, while middle-remote districts’ declines were 0.4 percent larger than those of most-in-person districts across the same period of time (see Figure 3).
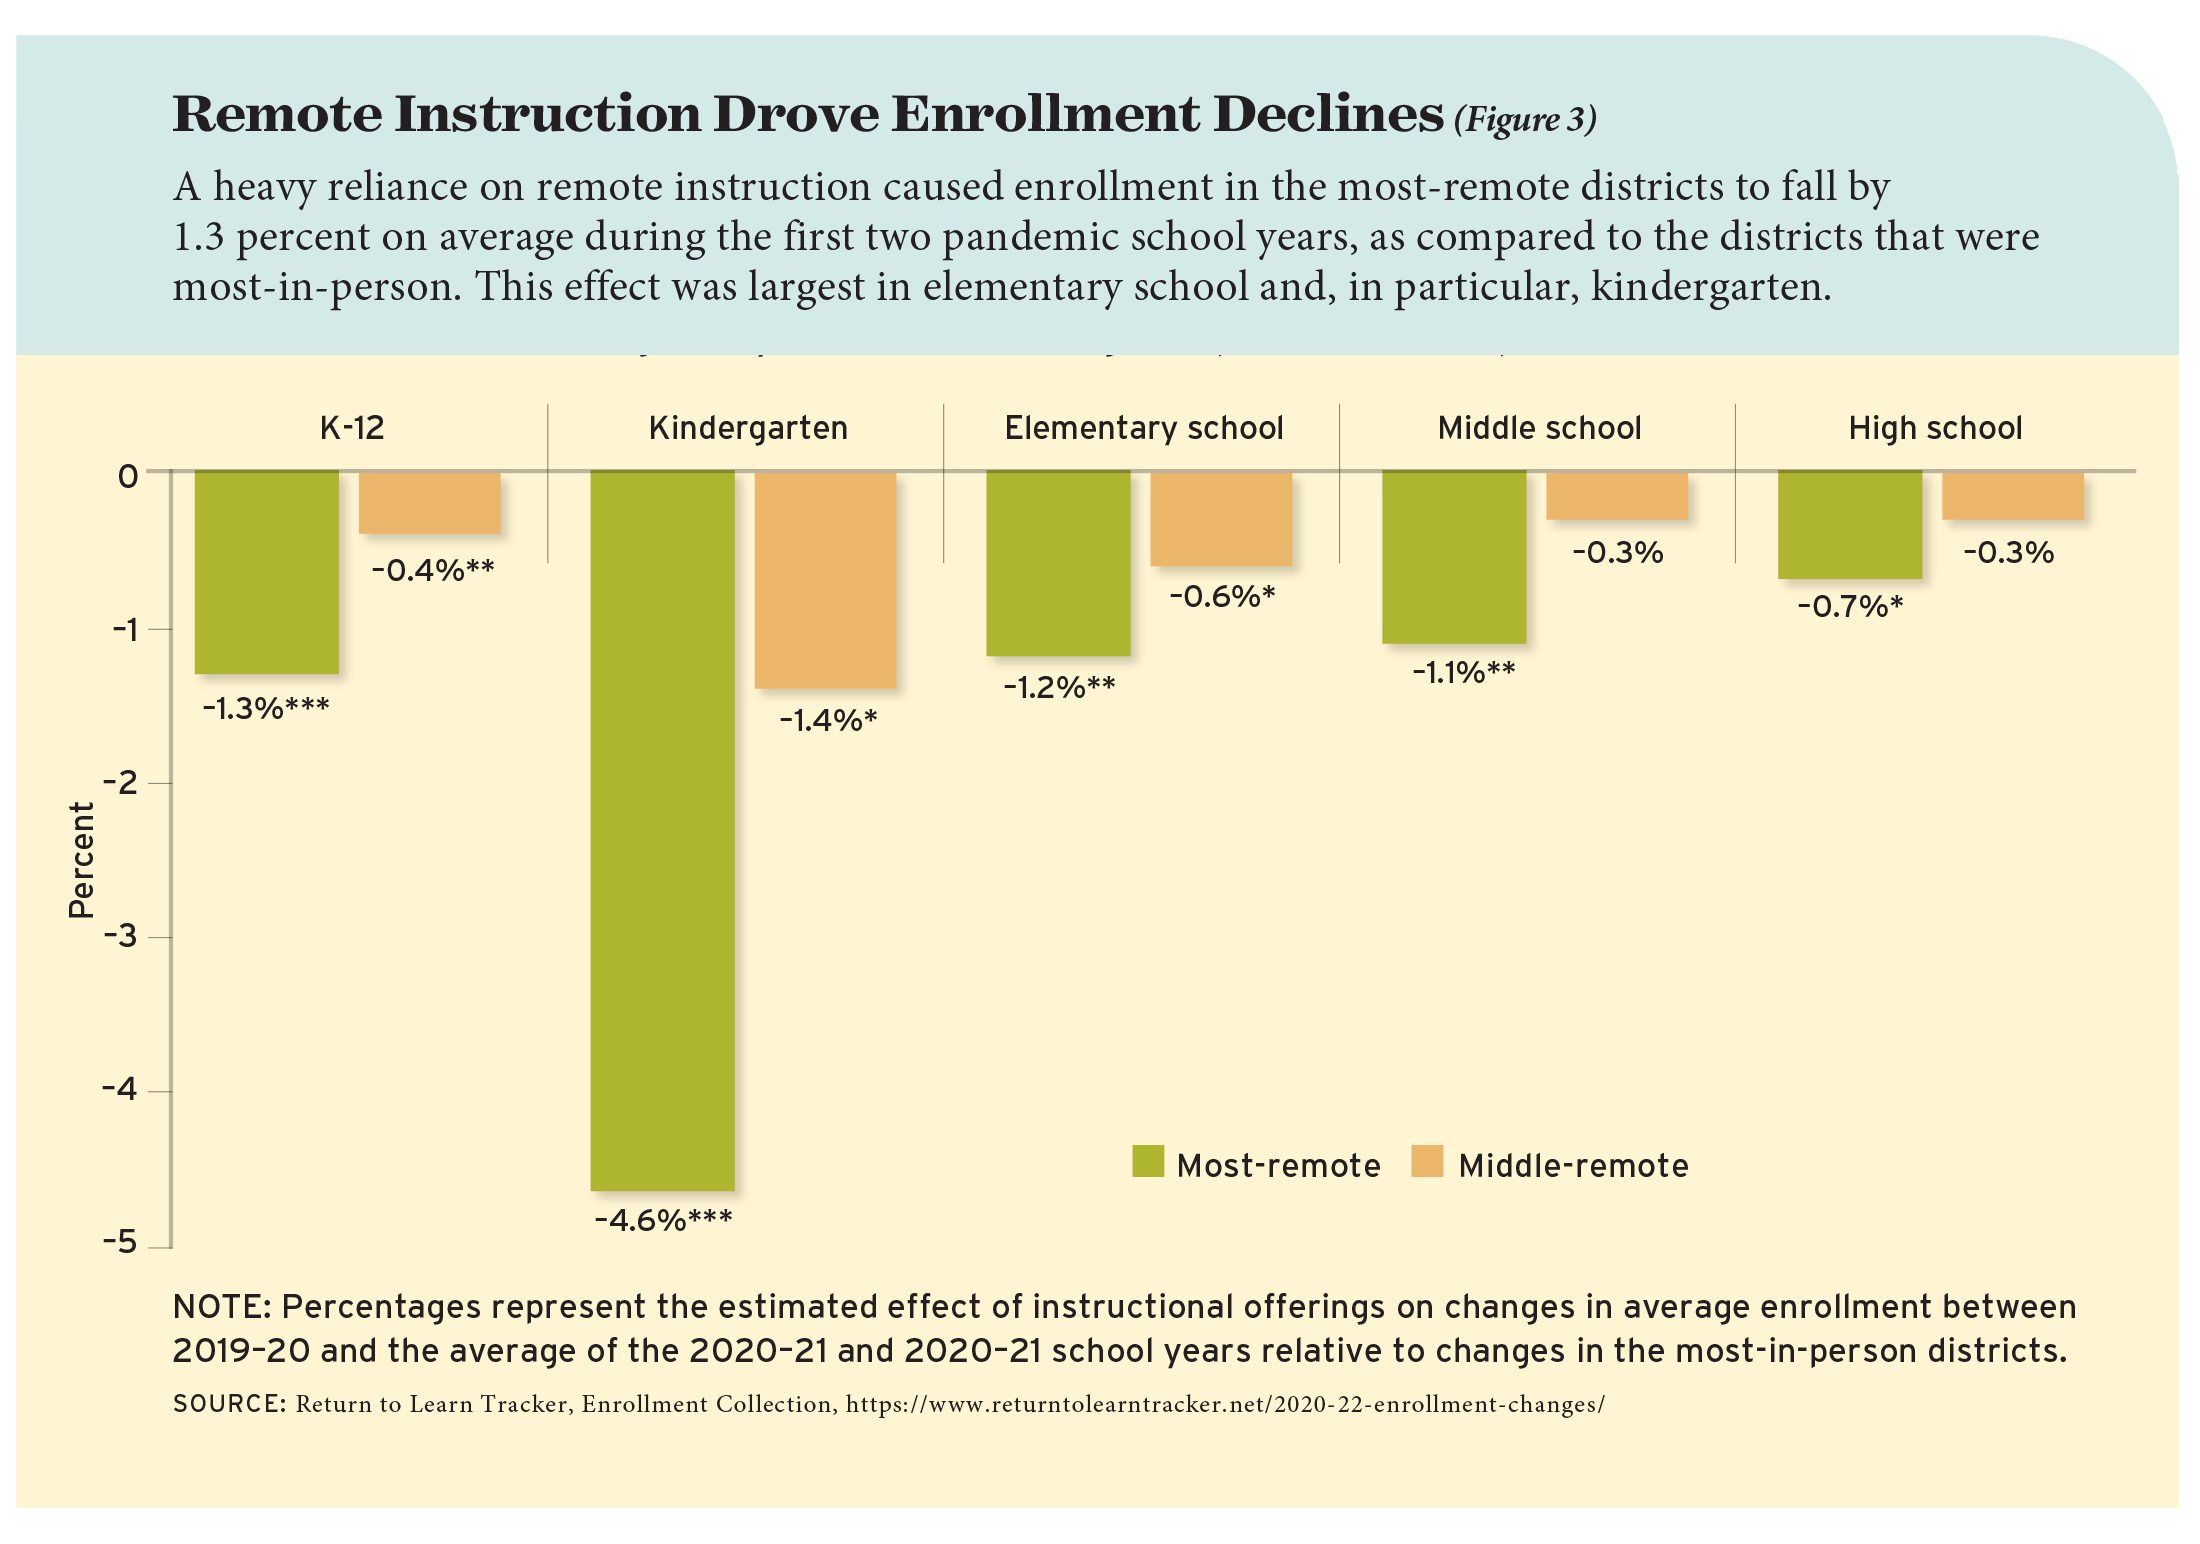
The effects of districts’ reopening policies on enrollment differed by grade level. Kindergarten-enrollment declines in the most-remote districts were 4.6 percent larger than those in the most-in-person districts and 1.4 percent larger than those in middle-remote districts. Elementary-, middle-, and high-school enrollment declines in the most-remote districts were 1.2 percent, 1.1 percent, and 0.7 percent greater than those in the most-in-person districts over both school years.
These findings confirm that a heavy reliance on remote instruction led to larger enrollment declines and that those effects were larger in the lower grades. These estimates are of the average enrollment differences post-pandemic and thus cannot address whether declines were larger in the second pandemic year. We turn to our second research method to address this question.
Our second method looks separately at the enrollment changes in each pandemic school year (see Figure 4). Here we compare the most-remote and most-in-person disticts to the middle-remote districts, whose enrollments were between these extremes, and again adjusts for the pre-pandemic enrollment trends in each group.
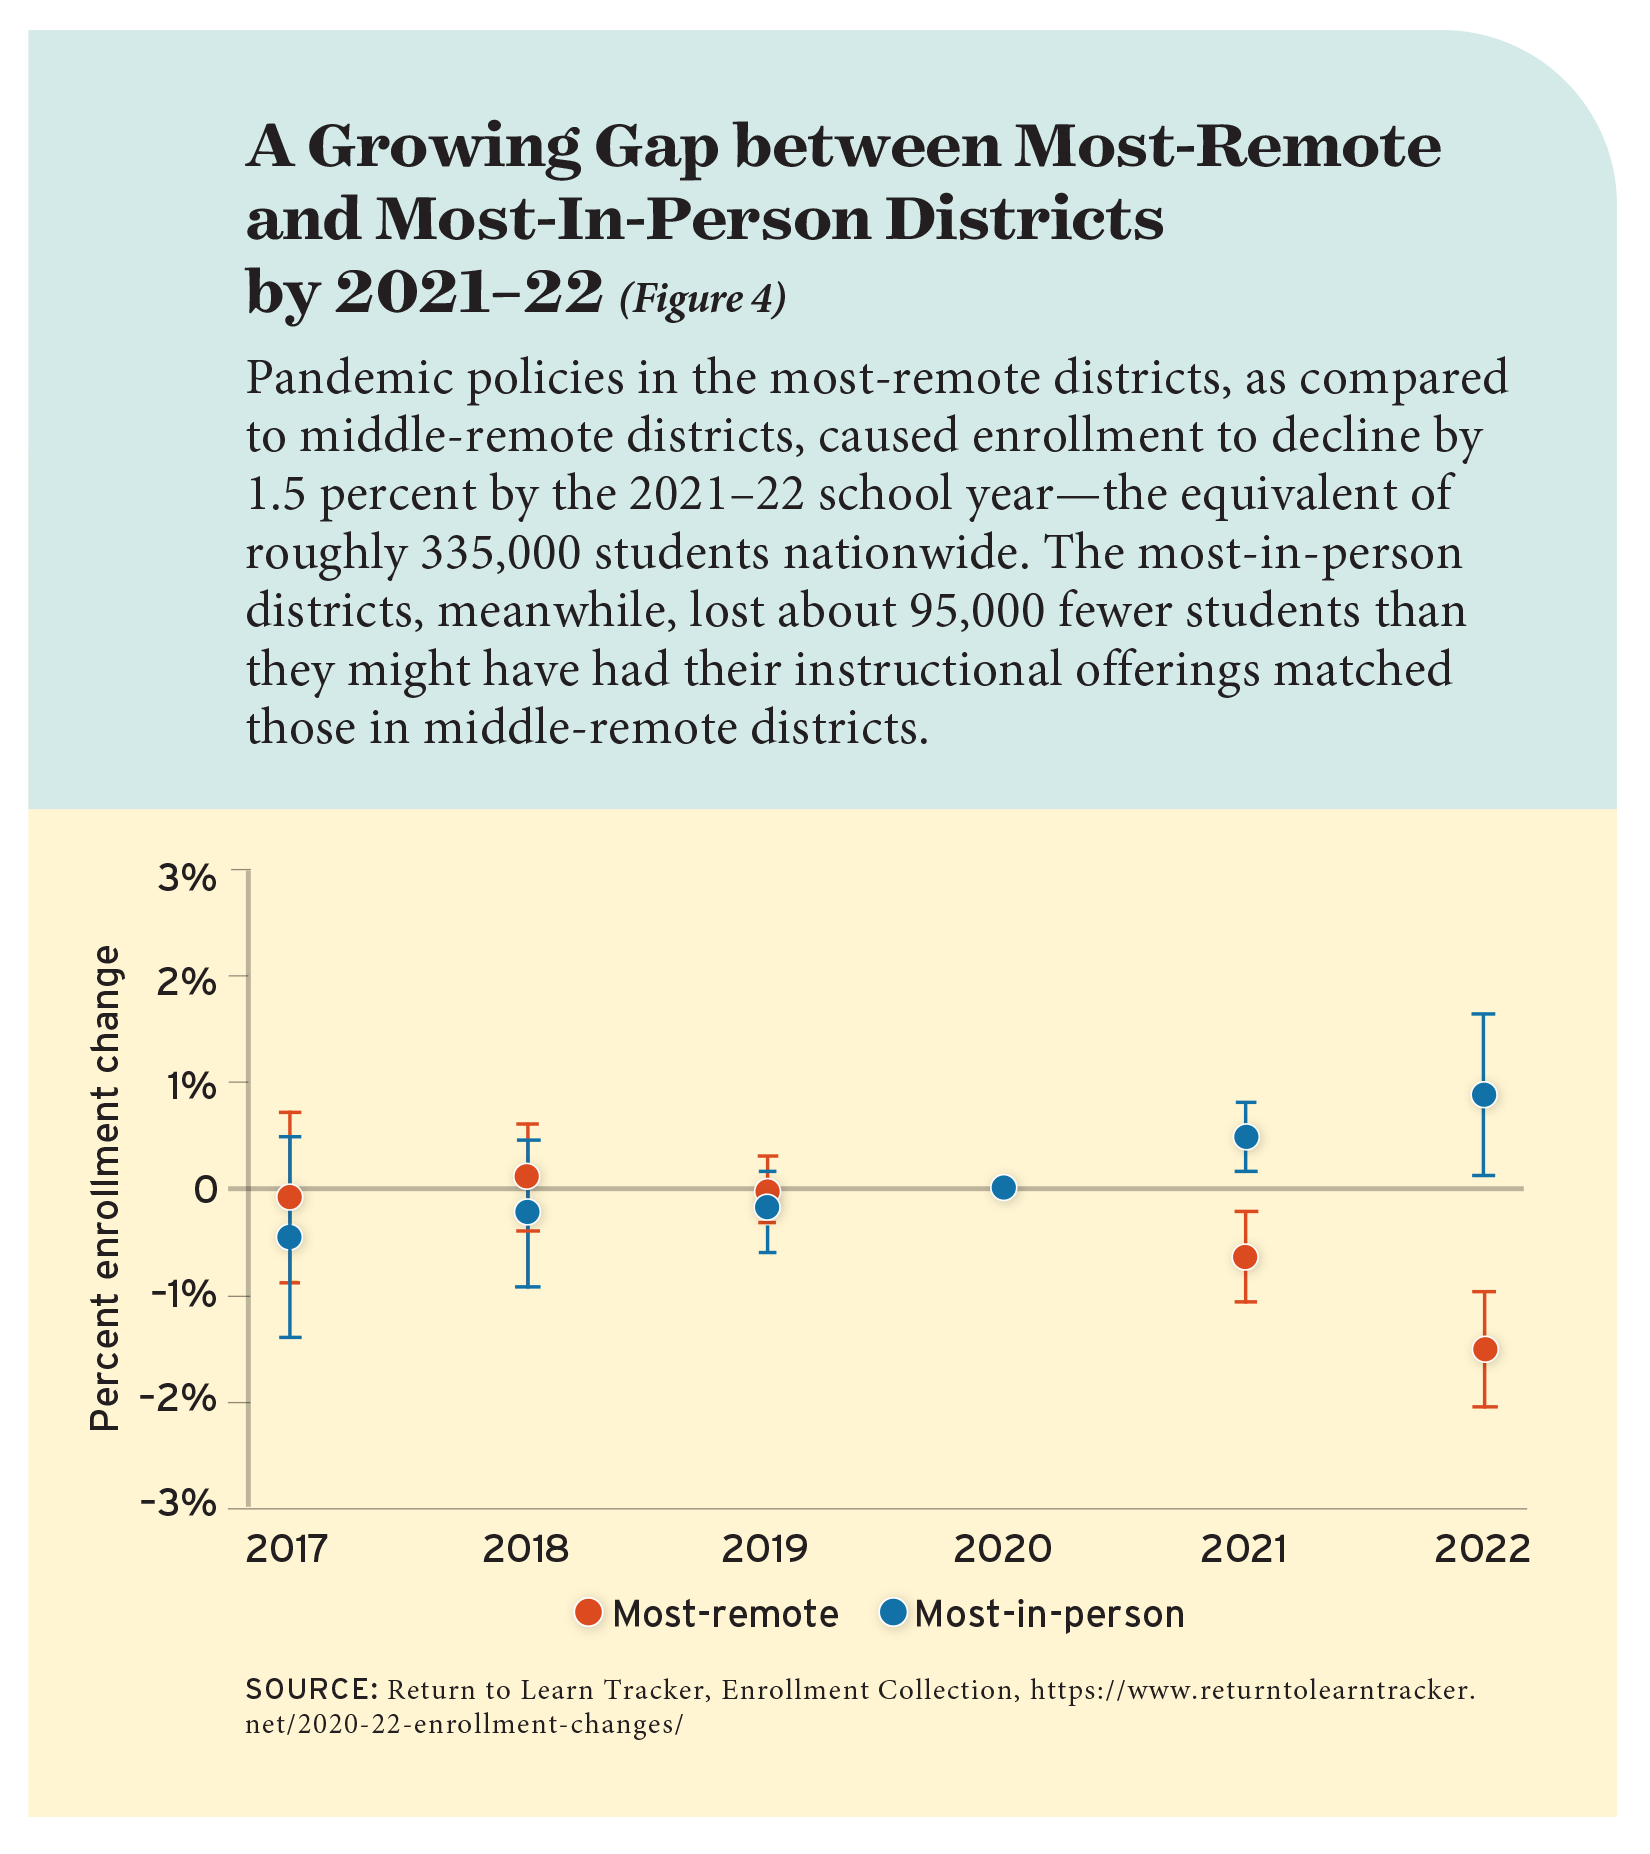
Enrollment differences were larger in the second pandemic school year compared to the first. Relative to middle-remote districts, the most-remote districts’ enrollments declined by an average of 0.7 percent in 2020–21 and 1.5 percent in 2021–22. This gap stems from continued enrollment losses in the most-remote districts in 2021–22, when middle-remote districts’ enrollment remained relatively flat. Taking into account the size of the districts, the most-remote districts as a group lost about 335,000 more students by 2021–22 than they would have if their instructional offerings had matched those in middle-remote districts.
The most-in-person districts saw the opposite pattern. Enrollment was 0.5 percent higher than in middle-remote districts in 2020–21 and 0.9 percent higher in 2021–22. This growing gap is due to the enrollment rebound that the most-in-person districts saw in the second pandemic school year. These results suggest the most-in-person districts lost roughly 95,000 fewer students than they would have had their instructional offerings matched those in middle-remote districts.
In sum, the enrollment gap between the most-in-person and most-remote districts was approximately 1.2 percent in the first pandemic school year. This gap grew to approximately 2.4 percent in the second. The latter difference is equivalent to the most-remote districts losing one more student than the most-in-person districts lost for every 41 students enrolled. In total, the most-remote districts lost 500,000 more students than they would have if their instructional offerings had matched those in the most-in-person districts.
Discussion
Our findings provide the strongest evidence to date on how remote instruction affected public-school enrollments over the first two years of the pandemic. They confirm that it was how districts responded to the pandemic, and not simply the pandemic itself, that caused enrollment to decline. Districts’ pandemic instructional responses explain the bulk of the difference between the large enrollment rebound the most-in-person districts saw in the second pandemic school year and the continued declines in the most-remote districts. In fact, the widened gulf seen in the second full pandemic school year suggests that enrollment impacts from school districts’ responses to the pandemic may have been as large as or larger than impacts from the pandemic itself.
Both the overall decline in enrollment and the differences in the declines caused by districts’ offerings were larger for younger students. This pattern aligns with the familiar notion that remote instruction presented challenges in the younger grades that were not as evident in older grades. That may not be the case when it comes to effects on students’ academic progress or their social and emotional wellbeing, but it provides compelling evidence that parents of younger students were more likely to view the challenges of remote instruction as actionable.
At a more basic level, our results confirm that large numbers of parents are willing to vote with their feet when their fundamental preferences are not met. To be clear, our findings do not support assertions that a majority of families are dissatisfied with their local schools. They do, however, suggest that a subset were dissatisfied enough to find alternative placements because of district actions. A larger portion were likely equally dissatisfied but unable to find alternatives that they could afford.
Only time will tell how long these enrollment losses persist. Given the rebounds seen in districts that were mostly in person in 2020–21, broader rebounds might be underway since all districts were in person in the 2021–22 school year. However, optimism on this front should be tempered by the fact that enrollments in even the most-in-person districts remained below their pre-pandemic baselines. In addition, pandemic-related mitigation measures remained in place longer in 2021–22 in districts that were remote longer in 2020–21.
Districts’ fiscal futures depend on how durable these enrollment declines are. Many states have adopted hold-harmless policies that are sheltering districts from the consequences of having fewer students in the wake of the pandemic. In the long run, however, school resources depend substantially on student enrollments. If enrollment remains lower in the future, smaller districts could lose hundreds of thousands dollars annually, and larger districts could lose millions, compared to pre-pandemic revenues.
In short, whether and when districts’ enrollment numbers recover will have long-term implications for public school district finances and operations. These questions will loom largest in districts that failed to provide in-person options for students during the pandemic.
Nat Malkus is resident scholar and deputy director of education policy at the American Enterprise Institute. Cody Christensen is a doctoral student in the Department of Leadership, Policy, and Organizations at Vanderbilt University. This article is adapted from an American Enterprise Institute paper titled “Public School Instructional Offerings and Enrollment Changes: Evidence from Two Years After the Pandemic.”
This article appeared in the Spring 2023 issue of Education Next. Suggested citation format:
Malkus, N., and Christensen, C. (2023). Parents Punish Schools That Stayed Physically Closed During the Pandemic: Enrollment drops were larger in schools that were most remote. Education Next, 23(2), 40-46.