
Parents, educators, and policymakers all believe school quality matters. But what is school quality? The Every Student Succeeds Act, or ESSA, lays out a few required indicators, including, in the case of high schools, graduation rates. But graduation rates, like test scores and other commonly used quality measures, reflect not only school quality but students’ household incomes, neighborhoods, and family backgrounds and the impacts of structural racism. Schools with large shares of students from historically underserved groups or students who live in poverty tend to have lower graduation rates than wealthier white schools, through no fault of their own.
Recognizing this, the Every Student Succeeds Act requires schools to report graduation rates broken out along four different dimensions: economic disadvantage, race or ethnicity, and English learner and disability status. But people often want a single metric to compare schools. Moreover, indicators for individual subgroups do not reflect either the varying sizes of each subgroup or the intersection of subgroups, such as race and economic disadvantage.
One way forward is to calculate regression-adjusted graduation rates (or other measures of interest) that account for differences between students. The regression adjustment can account for multiple factors, such as race and disability status, and incorporate them into a single summary score. It can also account for how key measures interact (e.g., not all students of color are poor, and not all immigrant students are English language learners).
With regression-adjusted graduation rates, schools are benchmarked against other schools with similar demographics, allowing for fairer comparisons. This approach allows the performance of entire schools to be meaningfully compared without having to compare each subgroup separately. In past work, we have shown what this might look like for colleges, high schools, and states. The chart below, inspired by a recent analysis of schools and outcomes in three states, shows what happens to high schools in Virginia after we adjust graduation rates. After these adjustments, only one school that was previously in the top 10 remains in the top 10, and only 24 remain in the top 50. At the other end, 13 are no longer in the bottom 50.
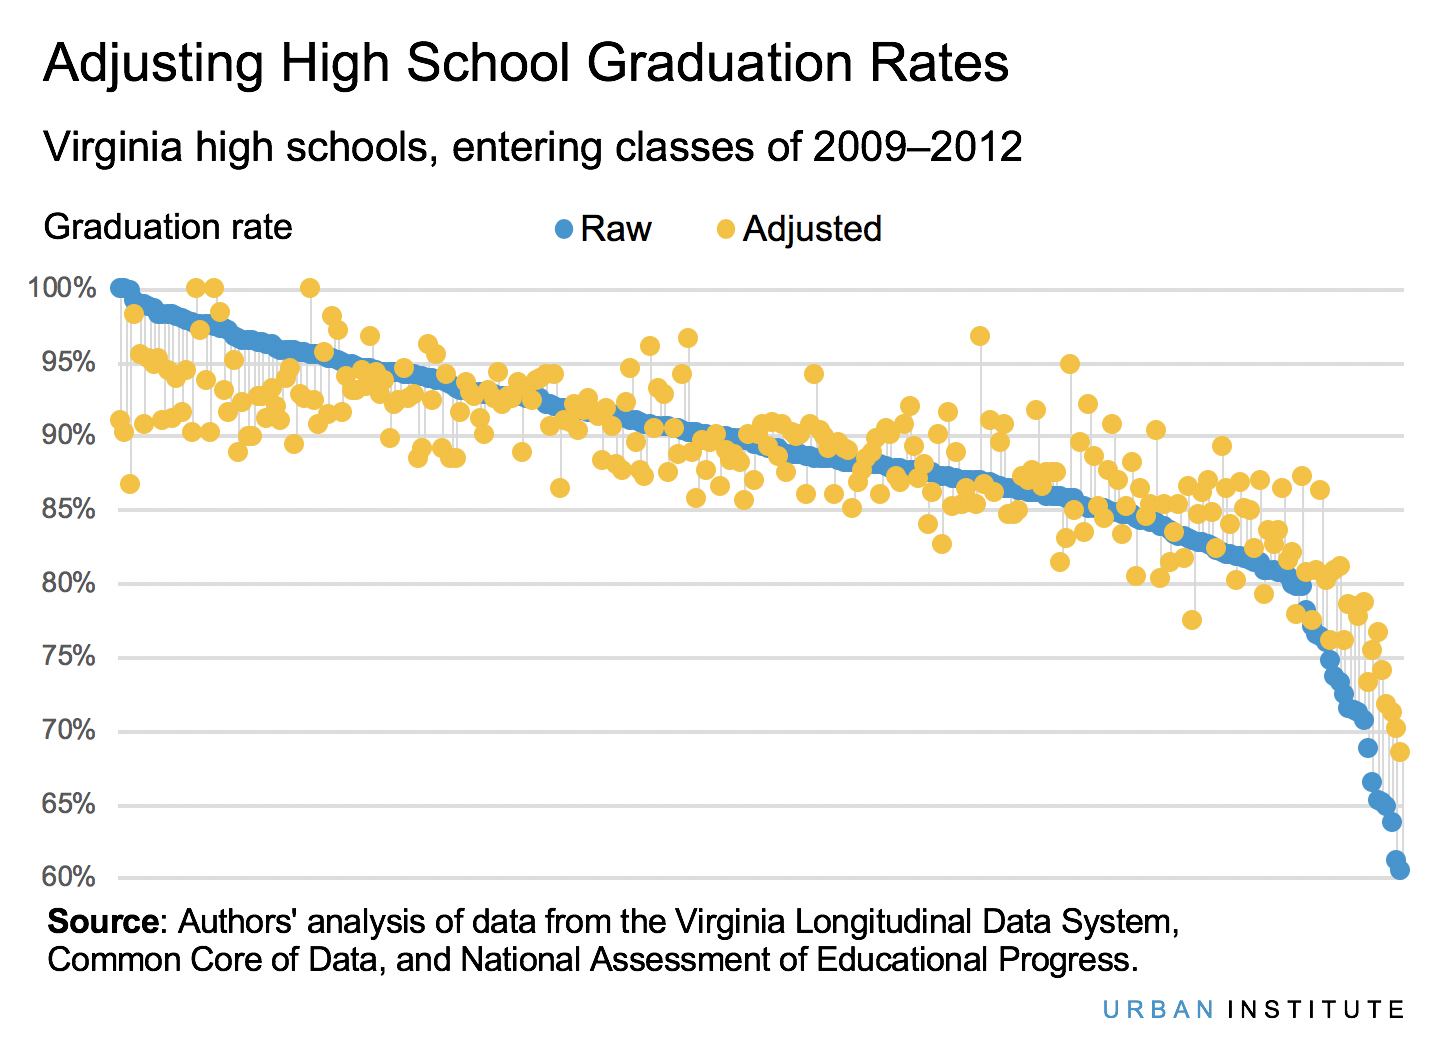
High-poverty high schools, and schools with larger shares of black or Hispanic students, tend to see their graduation rates adjusted upward, and wealthier white high schools tend to be adjusted downward. This is because students of color and those from economically disadvantaged backgrounds tend to face such obstacles as structural racism, low household wealth, and underinvested neighborhoods that affect them even before they set foot in a high school. Adjustments can be made not only to graduation rates but to other quality measures as well, such as measures of college or career readiness or other ESSA “fifth indicators.”
This approach addresses other issues as well. For example, subgroups within schools are often too small to yield reliable data, forcing states instead to report broad ranges like “50 percent or more” or “80 percent or more.” To the extent that additional contextual factors beyond student characteristics, such as neighborhood or district characteristics, vary across schools, they, too, can be included in the model.
Of course, many questions about how precisely to implement such an adjustment remain. For example, we currently rely on binary measures of economic disadvantage, which lack nuance. The quality of the adjusted measure would be improved with access to richer underlying data, such as household income, wealth, and composition, or parental education. Similarly, states are inconsistent in whether and how they collect some indicators of disadvantage, like student homelessness, immigration, or migrant worker status. Regression adjustment of quality indicators is a good first step to make quality measurement more accurate and fair, but, as with all measurement, the results will be only as reliable as the data used to inform the model.
Erika Blom is a research associate in the Center on Education Data and Policy at the Urban Institute. Theresa Anderson is a senior research associate at the Urban Institute. They are among the authors of the recent Urban Institute research report, “Identifying High-Performing Schools for Historically Underserved Students: Exploring a Multistate Model.”