
As 2026 begins, it is worth celebrating the fact that private-school choice policies are reaching more families than ever. Currently, 18 states have established universal choice programs in which all or most students can receive scholarships. But private education isn’t the only place where students’ schooling options are expanding. Choice among traditional public schools, where 83 percent of the nation’s students are enrolled, is becoming more flexible, too.
K–12 open enrollment is a form of public-school choice that allows students to transfer from their residentially assigned district school to other public schools. Since open enrollment policies launched in the 1990s, they’ve been overshadowed by growth in charter schools, vouchers, scholarships funded through tax credits, and education savings accounts.
Most open enrollment programs, which now operate in 43 states, were initially weak, letting districts reject transfer applicants even when space was available. However, the post-Covid surge in school choice options created a renaissance in open enrollment policies. During state legislative sessions in 2025, three states—Arkansas, Nevada, and New Hampshire—enacted open enrollment laws, bringing the total to 17 states that have strengthened their open enrollment statutes since 2021.
Despite these improvements, most state laws remain lackluster. Just 16 states have universal cross-district open enrollment laws, which let students transfer to schools in other districts when extra seats are open, while only 17 states have universal within-district open enrollment laws that let students transfer to non-assigned schools inside their district when space allows.
To gauge the role of these programs in an increasingly diverse K–12 education landscape, a 2024 analysis found that more than 450,000 students in Arizona, Florida, and Wisconsin used open enrollment during the 2021–22 school year (see “The Hidden Role of K–12 Open-Enrollment Policies in U.S. Public Schools,” features, Fall 2024). My analysis here aims to build on that research, including new or updated open enrollment data from 27 states and Washington, D.C. The data revealed three key takeaways:
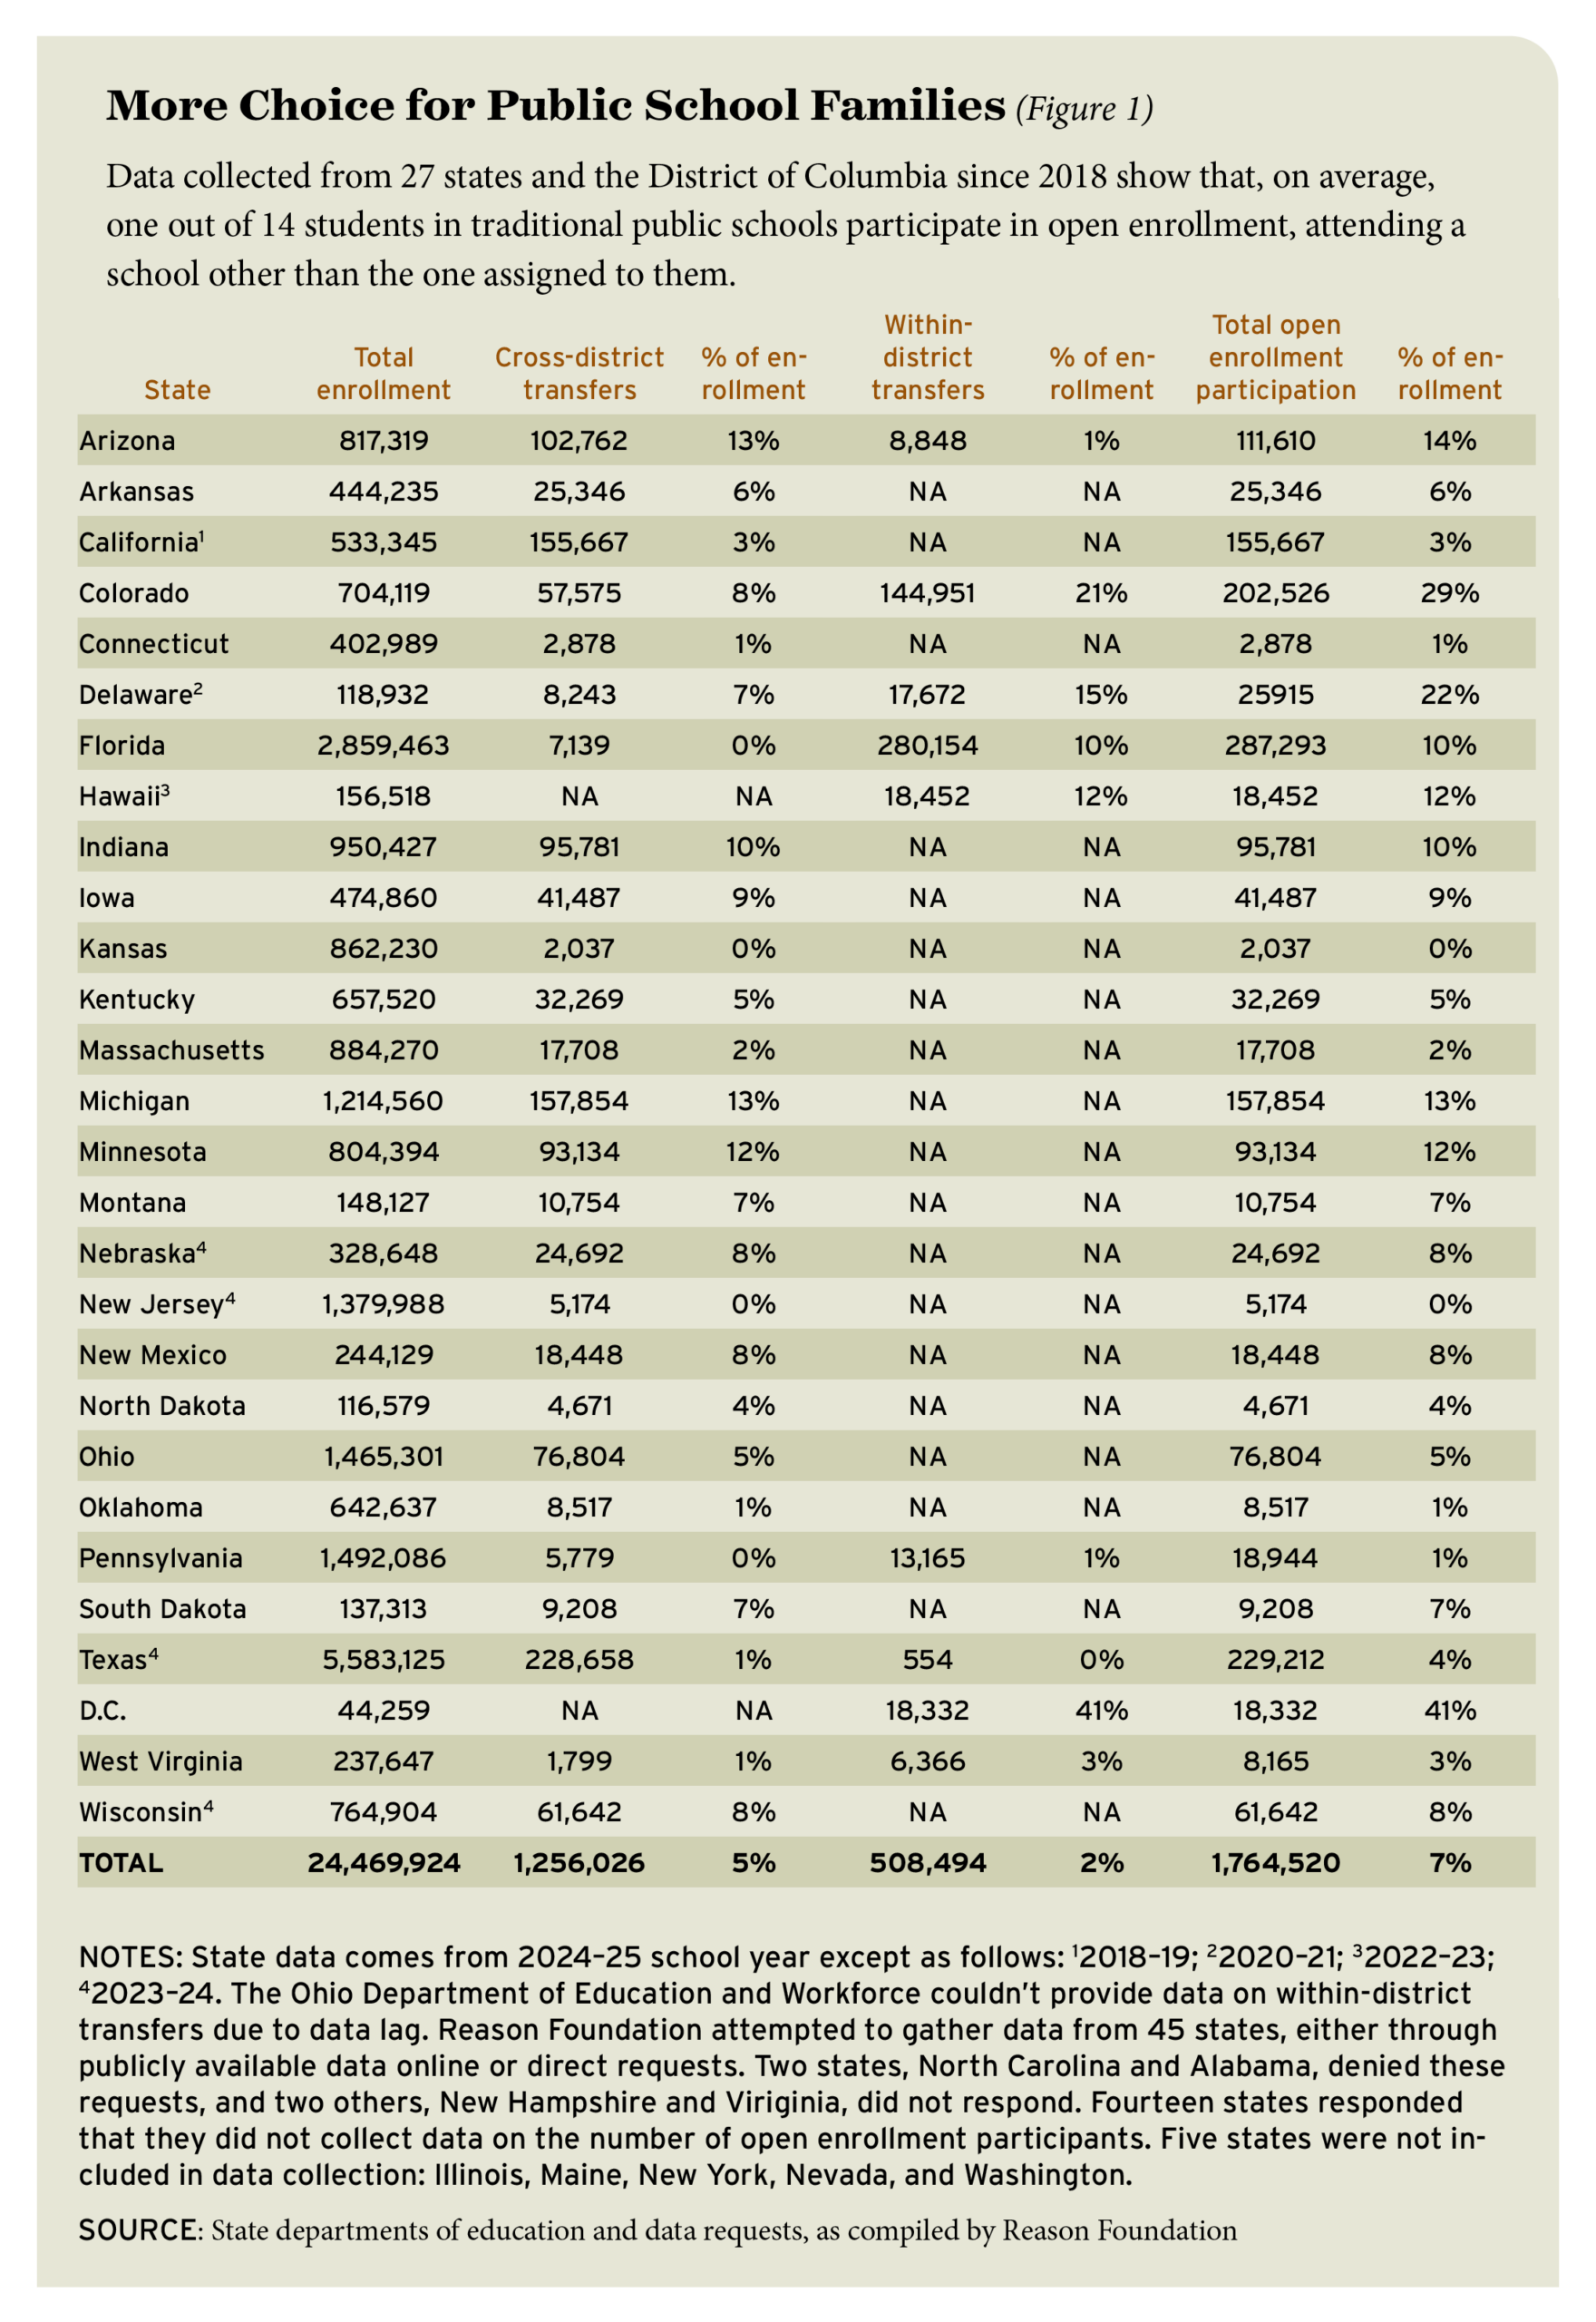
- Open enrollment is one of the most common forms of school choice. About one in 14 students, on average, used open enrollment to attend public schools other than their assigned ones.
- Open enrollment programs tend to scale up gradually with time. Transfer rates in nine out of the 14 states with data from five or more school years available showed that participation grew incrementally. This means school districts often have time to respond to market forces and adjust.
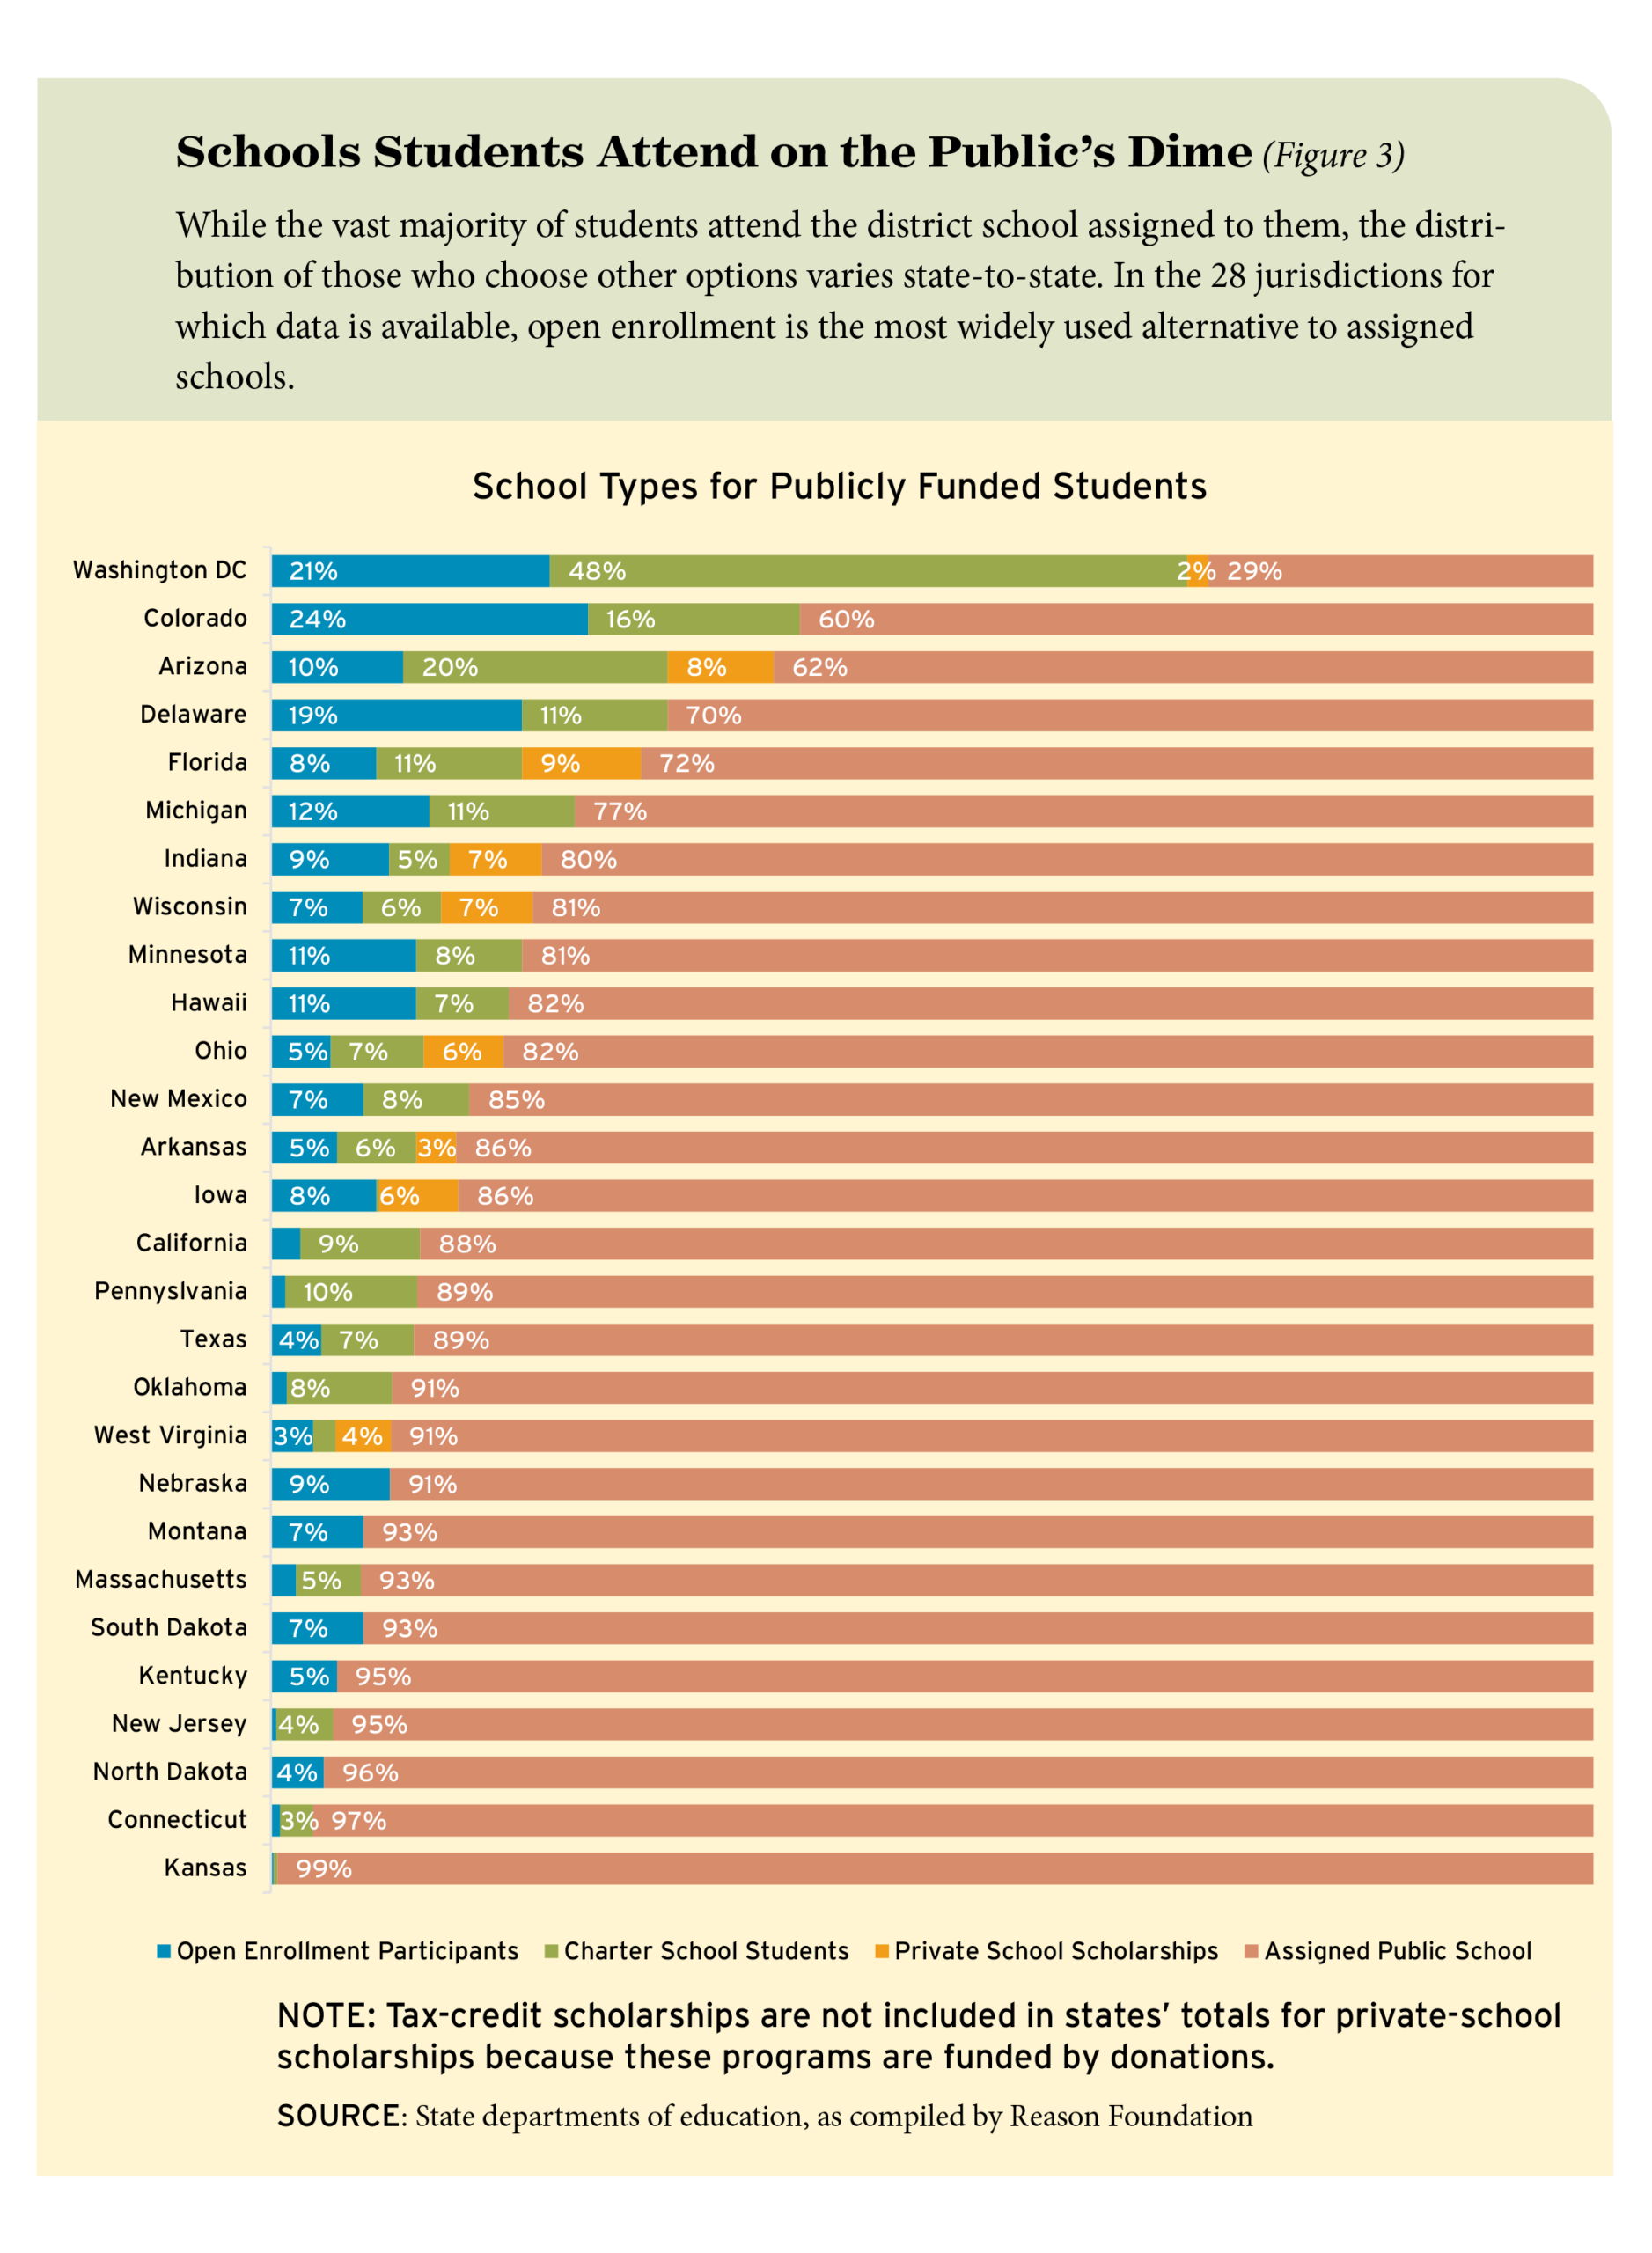
- Reports tracking the share of students attending schools of choice should include open enrollment. Across these 27 states and Washington, D.C., nearly one in six publicly funded students attended charter schools, used open enrollment, or received private-school scholarships to attend schools other than their residentially assigned ones. On average, 83 percent of students still attended their assigned public school, but nearly 8 percent attended charter schools, more than 7 percent attended public schools via open enrollment, and almost 2 percent used private-school scholarships.
Open Enrollment Is a Common Form of School Choice
In 27 states and Washington, D.C., at least 1.8 million students chose traditional public schools other than their assigned one. Almost 1.3 million of those students transferred schools via cross-district open enrollment, while more than 508,000 used within-district open enrollment (see Figure 1). The latter figure is likely an undercount, as only eight states and Washington, D.C., collected this data.
In nine instances, open enrollment transfers accounted for 10 percent or more of students enrolled in public schools, indicating that this policy is a key part of states’ education marketplaces. At the state level, Colorado, Delaware, and Arizona had the highest transfer rates, accounting for 29 percent, 22 percent, and 14 percent of its respective students.
Washington, D.C., had the highest transfer rate overall—42 percent of its public school students participated in open enrollment. This is because it operates as a single district entity in a high-density area with extensive public transportation options. Within-district transfer data from other urban districts showed similar trends. Denver Public Schools saw 36 percent of its students transfer within district during the 2024–25 school year.
Open Enrollment Programs Scale Up Gradually Over Time
Previous research from Colorado, Minnesota, and Ohio has shown that open enrollment participation increases incrementally over time. This is corroborated by a 2025 Reason Foundation report reviewing data from seven states that showed the same tendency, indicating that these programs don’t result in abrupt enrollment shifts.
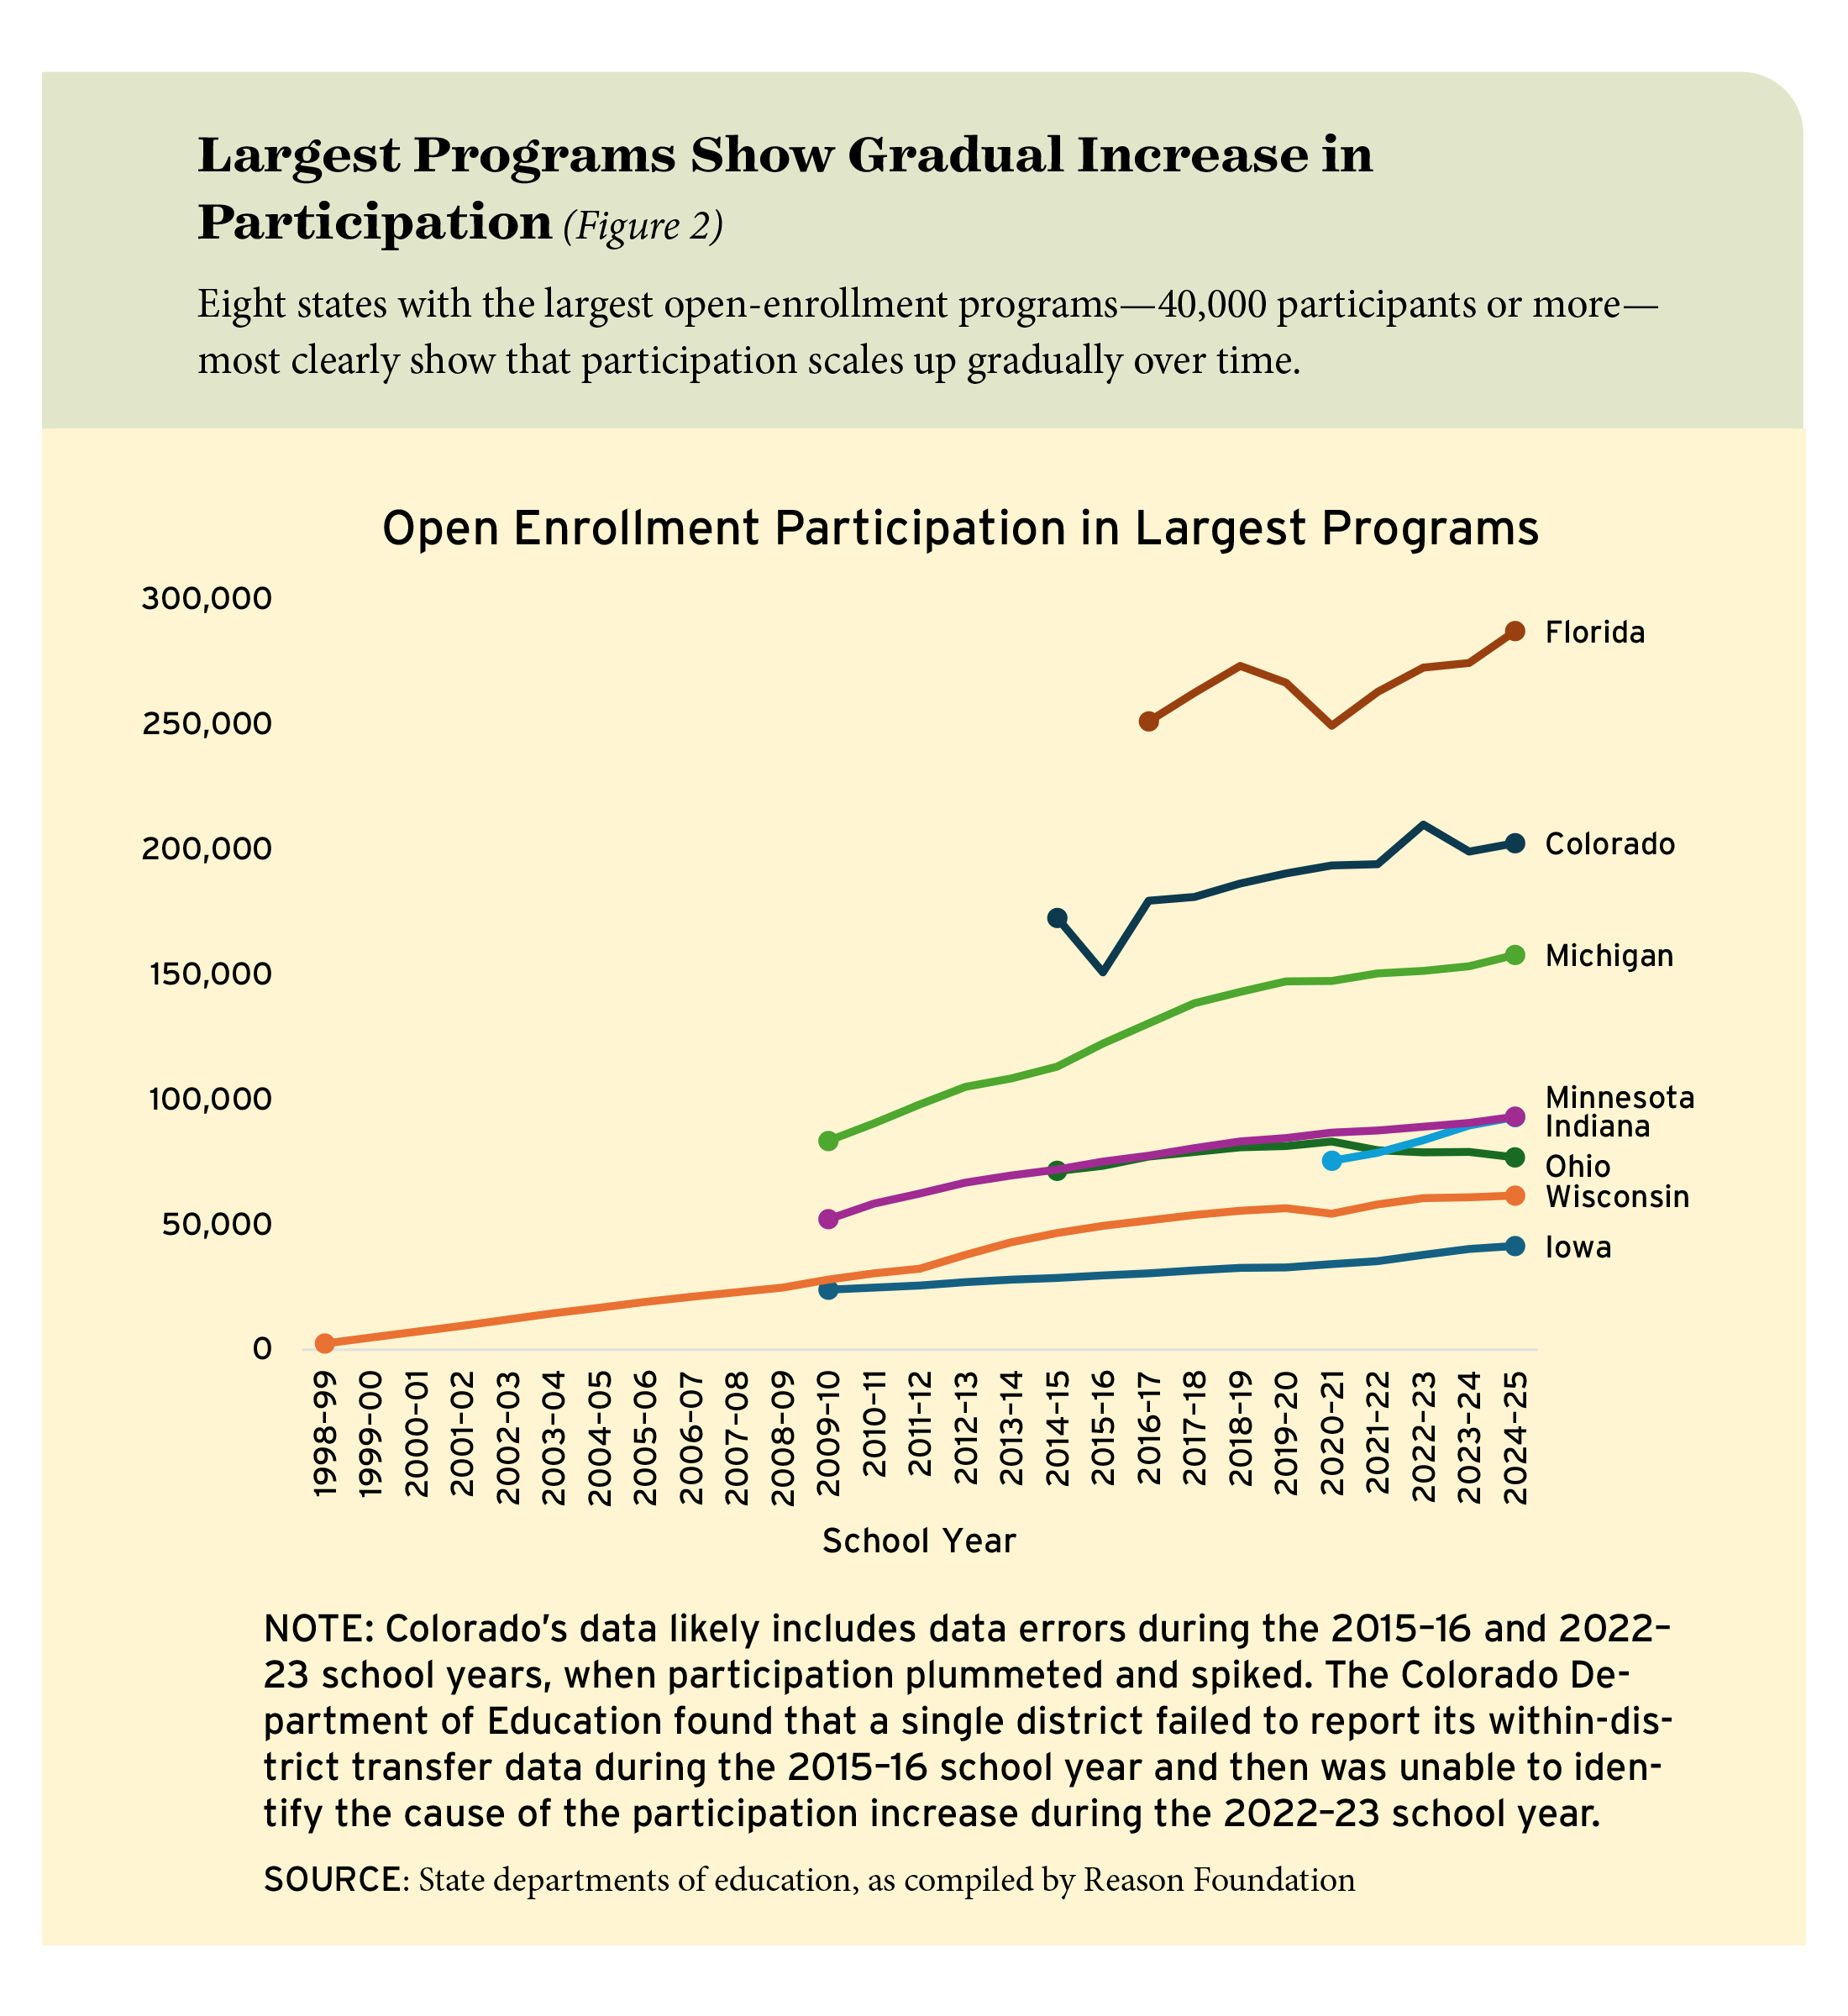
For the present analysis, Reason Foundation obtained at least five consecutive years of data from 14 of the 27 states, 10 of which showed that participation increased gradually. This was clearest in the largest programs, which hosted 40,000 or more participants (see Figure 2).
Wisconsin had the most complete data available, tracking the number of participants from when its open enrollment program launched during the 1998–99 school year until the 2024–25 school year. In that span of years, participation increased by about 13 percent annually, growing from about 2,500 participants to nearly 62,000.
Some states with smaller open enrollment programs (fewer than 40,000 participants) saw more modest increases in participation. For instance, programs in Massachusetts and New Mexico each increased by about 4 percent annually, while South Dakota’s program increased by about 2 percent annually. However, data from Connecticut and North Dakota showed participation rates stayed relatively flat, while in Hawaii, transfers actually declined by about 4 percent between the 2018–19 and 2022–23 school years.
Counts of Students Attending Schools of Choice Should Include Open Enrollment
While most students still attend their assigned public schools, others are increasingly choosing alternative education options. According to data published by EdChoice and the National Alliance for Public Charter Schools, more than 666,000 students used education savings accounts or vouchers and nearly 4 million students attended charter schools as of 2024. These statistics are often used to track the progress of school choice nationwide but obscure the sizable role played by open enrollment.
Figure 3 shows the shares of students using open enrollment, charter schools, or private-school scholarships. Altogether, 5.2 million students, or nearly 16 percent, used public funds to attend a school other than their assigned one in 27 states and Washington, D.C. In 16 states, more than 10 percent of publicly funded students attended schools other than their assigned ones.
Of publicly funded students, more than 5 percent used open enrollment in aggregate, or 7 percent of students on average across all 28 jurisdictions. It was the most common form of non-assigned school choice in 12 states. Moreover, open enrollment participants accounted for about 34 percent of the approximate 5.2 million students using public funds for school choice in these states. These data show that open enrollment is an important component of states’ education marketplaces.
Discussion
It is clear that a substantial portion of K–12 students use open enrollment to attend public schools other than their residentially assigned ones. While Florida, Texas, and Colorado have the most open enrollment participants, Colorado, Delaware, and Arizona have the highest transfer rates. On average, 9 percent of public school students used open enrollment in the 27 states and Washington, D.C., for which data were available.
Despite widespread declines in public school enrollment generally, open enrollment participation generally increased in states that had five or more years of data. Moreover, participation is likely to increase, especially in states whose open enrollment programs were recently strengthened, like Arkansas, Kansas, Montana, Oklahoma, and West Virginia. Indeed, participation in Arkansas’s and West Virginia’s universal open enrollment programs increased by 3 percent and 8 percent, respectively, since they were launched during the 2023–24 school year.
EdNext in your inbox
Sign up for the EdNext Weekly newsletter, and stay up to date with the Daily Digest, delivered straight to your inbox.
Overall, these data highlight that states’ education marketplaces are competitive. While most students still attend their assigned public school, the proportion that do not is growing. On average, 15 percent of students chose publicly funded education options other than their assigned public schools in the 27 states for which data were available. Competition for students will only increase as local enrollments trend downwards due to declining birth rates.
To successfully compete in this evolving landscape, districts must proactively convince families why their local public school is the best education option to increase student capture. These aren’t wholly uncharted waters for traditional districts. From California to Minnesota to Texas, districts have shown how to compete in a more robust education marketplace through more and better specialization. Moreover, because open enrollment programs tend to scale up incrementally, sending and receiving school districts will have time to adjust course if they are proactive.
Reports from California’s Legislative Analyst’s Office from 2016 and 2021 showed that districts participating in the state’s District of Choice program that initially lost students to other districts were later able to recover them. A key part of this process was conducting outreach to local families to learn what services could better serve students and encourage their return.
Similarly, St. Paul Public Schools in Minnesota saw its first enrollment increase in a decade after designing a plan that identified schools with extra space and were most likely to attract local families. The district conducted customer service training with school employees “to improve family enrollment experience[,] giving effective school tours tailored to families’ needs, interests, and questions[, and] following up with families in a timely and meaningful way,” according to SchoolMint, a K–12 enrollment software company that partnered with the district to help streamline enrollment and recruitment.
Other districts appear to be taking note, especially in states with large open enrollment programs. With the exception of Florida, public school enrollments declined in each of the states featured in Figure 2 between the 2019–20 and 2023–24 school years, but open enrollment participation has increased in nearly all of them. Michigan can stand as a case in point. Its public schools lost more than 69,000 students—an enrollment decline of 4.6 percent— even while its open enrollment participation increased by 4 percent. The average across all states for which data was available was a 3 percent drop in public school enrollments and 6 percent rise in open enrollment participation. This means that public schools are actively competing for a shrinking student population where students are increasingly mobile.
School districts should embrace these changes. Not only is this a chance to strengthen public schools and improve student buy-in to school cultures, it also helps students attend schools that are the right fit. This could boost student retention and even attract students from charter or private schools.
Altogether, public schools still have much work to do. The overall loss of enrollment in district schools coupled with the increase in participation in open enrollment indicates that families are growing more dissatisfied with their local public schools. According to 2025 Gallup polling, almost one in four parents is dissatisfied with their eldest child’s school. The enactment of state policies that have made it easier for families to choose public schools that are a better fit for their children is a positive development for competition and school choice. But the decline in public school enrollment is indicative of a changing K–12 education landscape. An 18-year baby bust combined with more access to private and charter schools means traditional public schools must navigate an increasingly competitive education marketplace where there are fewer students. This is an opportunity for school districts to increase flexibility within their systems, improve their offerings, try to win back students they’ve lost, and become more attractive to families as a viable education choice. And states that have open enrollment policies already in place will benefit all the more from a healthy education marketplace across all sectors.
Jude Schwalbach is a senior policy analyst at Reason Foundation.