Has U.S. school performance been improving over the past two decades? The results of two international tests—the Program for International Student Assessment (PISA) and the Trends in International Mathematics and Science Assessment (TIMSS)—shed some light on this question. Both were administered in 2015, an event that only occurs every 12 years. Inside the 2017 Brown Center Report on American Education, report author Tom Loveless takes advantage of this rare opportunity to illuminate trends in American students’ aptitude compared to previous years and to their international counterparts.
What are the PISA and TIMSS tests?
PISA, which was first administered in 2000, covers 15-year-old students’ literacy levels in three disciplines: reading, mathematics (first tested in 2003), and science (first tested in 2006). The test, given every three years, attempts to measure how well students can take concepts taught in the classroom and apply them to find solutions to real-world problems. TIMSS, which dates back to 1995, tests fourth and eighth graders every four years on how well they have learned math and science curricula. Both tests are scored on a scale of 0-1,000, with a mean of 500 and a standard deviation of 100; however, the true range of values lies between the 300s and the 600s.
Although the two tests are different in what they test, they are highly correlated. Any PISA section score and any TIMSS section score are strongly related, but correlations are not as strong when comparing a country’s gains on each test over time.
How did the U.S. perform on these tests in 2015?
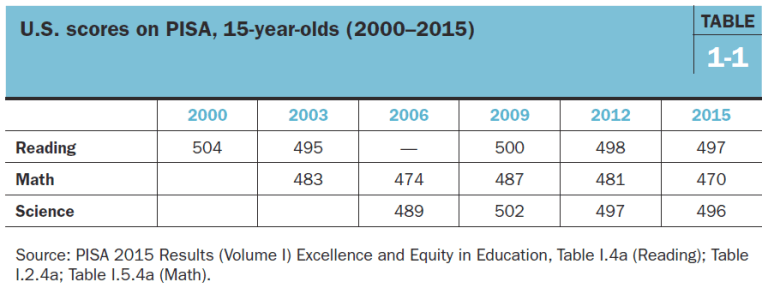
The PISA test scores did not bring great news about the American education system, as the United States continues to hover around the international mean for reading and science literacy. On the mathematics literacy section, the U.S. even notched its lowest score to date at 470; this represents a decline from the previous two tests, but it is not statistically significantly different from its first-ever score in 2003. Overall, American PISA scores on all sections have been relatively flat over the test’s history, with no statistically significant change between the score on each section’s first year and the 2015 scores.
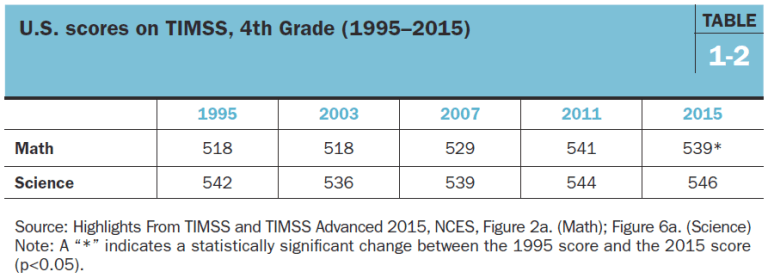
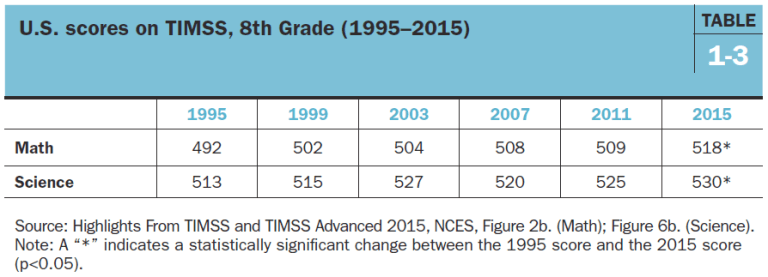
However, the U.S. has consistently performed better on TIMSS. Fourth grade scores have largely stayed above the international mean, with math results improving significantly over time—518 in 1995 grew to 539 in 2015—and science scores remaining steady around 540. Eighth grade TIMSS scores show statistically significant gains in both math and science over the test’s history: Math rose from 492 to 518, while science increased from 513 to 530.
How does the U.S. compare to other countries?
Handwringing about how the U.S. does on international tests contends with baseball as a national pastime. Initially, it appears that there is some justification to it: The U.S. still scores below the top performers on these tests when compared with economically developed countries in Europe and Asia. For example, Singapore, the highest TIMSS scorer for both grades and both sections, scores between 44 and 103 points better than the U.S. on any TIMSS section, the latter number constituting a difference of more than a full standard deviation. However, this does not tell the whole story of American students’ academic aptitude.
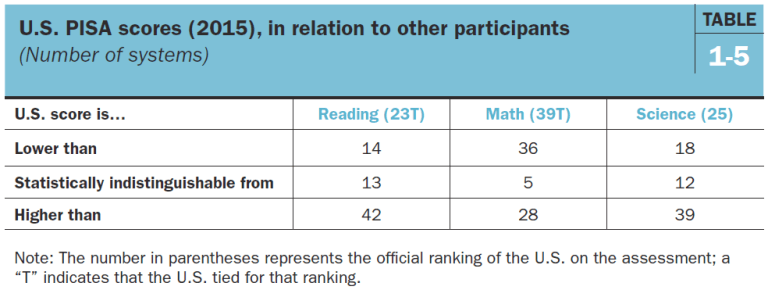
When evaluations of national performance consider statistical significance, the U.S. scores are often not as disappointing as the raw numbers may make them seem. The PISA scores are still somewhat poor—especially math, American students’ lowest score—but the reading results illustrate the nebulousness of rankings. The U.S. score in reading is tied for 23rd place, but its true ranking is more complicated than that: When statistical significance is taken into account, 14 systems scored higher than the U.S., 13 scored about the same, and a considerable 42 scored lower.
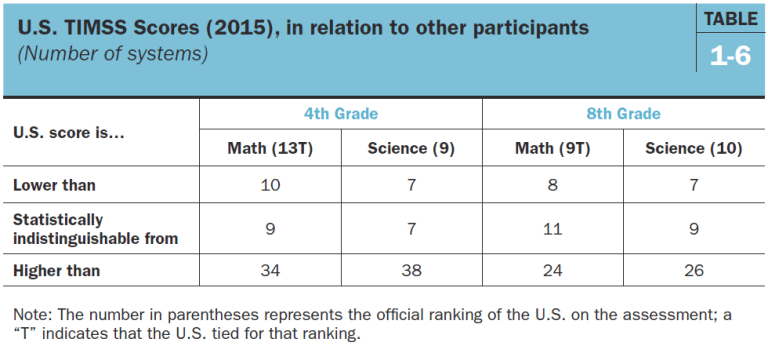
The U.S. also looks better on TIMSS when considered in this context. On fourth grade math, America’s score is reported as tied for 13th place; more precisely, it scores below 10 systems, is statistically indistinguishable from nine systems, and is higher than the scores of 34 systems. In eighth grade math, the contrast with PISA’s math scores is provocative: Only eight systems outscore the U.S. on TIMSS, compared to 36 countries outscoring the U.S. on PISA. And on each of the TIMSS fourth and eighth grade science assessments, only 7 countries scored significantly higher than American students. This paints a somewhat rosier picture of U.S. students.
Why do these scores matter?
Rankings based on international assessments are simple to understand—but they can also mislead. While researchers often shy away from using rankings in serious statistical analyses of test scores, they can have a substantial impact on political rhetoric, and consequently, education policy. Media outlets often take these lists and use them in headlines or sound bites, providing little context and furthering educational policy discussion that can often be misleading. To get the most value from U.S. participation in PISA and TIMSS, policymakers—and the public—should closely analyze the trends on both tests with caution and context.
—Louis Serino
Louis Serino is the Managing Editor of the Brookings Institution’s Brown Center Chalkboard.
Reed Timoner contributed to this post.
This post originally appeared on the Brown Center Chalkboard.