 Florida’s gains in reading and math achievement, as measured by the National Assessment of Educational Progress
Checked by Marcus A. Winters
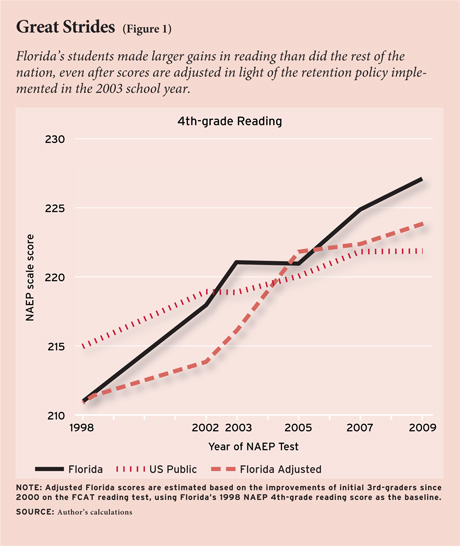
Among the 50 states, Florida’s gains on the National Assessment of Educational Progress (NAEP) between 1992 and 2011 ranked second only to Maryland’s (see “Is the U.S. Catching Up?” features, Fall 2012). Florida’s progress has been particularly impressive in the early grades. In 1998, Florida scored about one grade level below the national average on the 4th-grade NAEP reading test, but it was scoring above that average by 2003, and made further gains in subsequent years (see Figure 1). Scores on Florida’s own state examinations revealed an equally dramatic upward trend.
Many have cited the series of accountability and choice reforms that Florida adopted between 1998 and 2006, under the leadership of Governor Jeb Bush, as the driving force behind the large and rapid improvement in student achievement (see “Advice for Education Reformers: Be Bold!” features, Fall 2012). Others have insisted that Florida’s NAEP scores do not represent true improvements in student reading achievement. Boston College professor Walter Haney, for example, argues that the scores are “dubious” and “highly misleading.” He contends that it is “abundantly clear” that Florida’s aggregate test-score improvements are a mirage caused by changes in the students enrolled in the 4th grade after the state began holding back a large number of 3rd-grade students in 2004 (all school years are reported by the year in which they ended). His argument has been touted by other researchers, most notably by some at the National Education Policy Center, and it has been cited in testimony presented before state legislatures considering the adoption of Florida-style reforms.
It is certainly true, as Haney has said, that one of the Florida reforms was to curtail social promotion of underachieving students from 3rd to 4th grade. In most school districts, students who do not warrant promotion on academic grounds move on to the next grade regardless, because many educators believe that keeping students with their peer group is desirable. But in Florida, those students who completed 3rd grade in the spring of 2003 and since have had to meet a minimum threshold on the Florida Comprehensive Assessment Test (FCAT) reading examination in order to be promoted to the 4th grade, unless they receive a special waiver. As a result, the percentage of students retained in 3rd grade increased substantially. In the two years prior to the policy change, only 2.9 percent of 3rd-grade students were retained, while in the two years following the policy’s implementation, 11.7 percent of Florida’s 3rd-grade students were told they had to remain in the same grade for the coming year.
Haney and others have concluded that this policy change artificially drove up 4th-grade test scores, because it removed from the cohort of students tested those who were retained in 3rd grade, the very students most likely to score the lowest on standardized tests. Although the point would seem to be well worth considering, it has not been subjected to serious empirical analysis. Does the holding back of the lowest-performing students in 3rd grade explain all the 4th-grade gains in Florida, as Haney contends? Does it explain some of the gains? Or none at all? The best way to answer the question is to look at changes in student test-score performance among those in 3rd grade for the first time, as their test scores are unaffected by the retention policy. If the gains observed for 4th graders were a function of differences in the type of students entering that grade due to the retention policy, then the performance of those entering 3rd grade should look essentially the same after 2002 as it did before the retention policy was put into place.
Drawing on information on student performance available from the Florida Department of Education, I was able to analyze test-score trends of students enrolled in the 3rd grade for the first time. I find that the gains among initial 3rd graders were not as dramatic as those shown on the 4th-grade NAEP, thereby suggesting that the 4th-grade scores did create the appearance of steeper achievement growth than actually took place. Nonetheless, the gains among initial 3rd graders were very substantial, about 0.36 standard deviations between 1998 and 2009, and more than enough to justify Florida’s claims that its gains have outpaced those in most other states.
Reading Test Scores for 3rd Graders
 I first analyze changes over time in the FCAT test scores of students in their initial 3rd-grade year in order to discern the extent to which Florida’s elementary-school students made true achievement gains during the period in question. Because the state has not yet identified students for retention, the test scores of students the first time they are in the 3rd grade are not affected by any change in the student cohort resulting from the retention policy.
The administrative data set for the State of Florida contains individual test scores and demographic information for the universe of test-taking students in grades 3 through 10 in Florida from 2001 through 2009. The data set includes a unique student identifier, which allows me to follow the progress of each student over time and to determine which students have been retained.
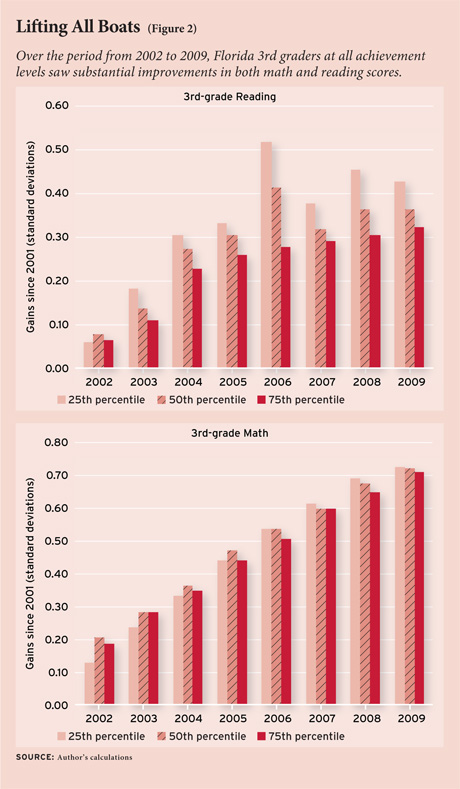
Figure 2 shows the changes since 2001 in the performance of students at the 25th, 50th, and 75th percentiles in their initial 3rd-grade year. The figure documents clear positive movement across the test-score distribution for the first cohort of students that needed to reach a minimal score on the FCAT exam in order to be promoted from the 3rd to the 4th grade (2003). The achievement distribution makes another leap forward the following year (2004), which was the first year that began with a sizable number of retained students due to implementation of the policy. Student achievement continued to grow in subsequent years.
The test-score improvements shown on the figure are substantial. By 2009, the median reading test score of students in their initial 3rd-grade year had improved by more than one-third of a standard deviation since 2001, as had nearly all points on the distribution. A gain of this magnitude amounts to roughly a full year of academic progress for students in the early elementary grades. The test-score gains among the state’s lowest-performing students were even more impressive; for instance, students at the 10th percentile improved by more than half a standard deviation. The gains made by initial 3rd-grade students on the math exam are even larger than the gains in reading at all points on the distribution.
The results do suggest, however, that the aggregate test scores on the 4th-grade NAEP could well be inflated by the retention policy. The improvement in the median reading score for those students entering 3rd grade is smaller than the NAEP increase for 4th graders over the same time period. Even so, the 3rd-grade gains remain noteworthy enough to substantiate the basic claims of those who praise the Florida track record.
Rescaling NAEP Reading Scores
 To assess how well Florida performed relative to the rest of the nation, one can use the results for initial 3rd-grade students on the FCAT to rescale the state’s 4th-grade scores on the NAEP reading exam. The rescaling assumes that test-score improvements on the FCAT for cohorts in their initial year as 3rd graders are a good proxy for gains in reading achievement made by Florida’s students in the next elementary grade. Though imperfect, this assumption is justified to the extent that most consider 4th-grade NAEP scores to be an assessment of overall elementary-school performance.
Because Florida did not participate in the NAEP in 2000, I use as the state’s baseline score its median score on the 4th-grade NAEP reading exam in 1998. Thus, I also assume that the state made no meaningful gains in 4th-grade reading between 1998 and 2000 that would have shown up on NAEP, which squares with the scores on the state’s own reading assessment. I then use the improvements of the median reading test score for initial 3rd-grade students on the FCAT since 2001 in order to rescale the state’s mean NAEP test score in the spring of the same year.
In addition to providing the originally reported NAEP score trend in median scores between 1998 and 2009 for Florida and the United States as a whole, Figure 1 shows the rescaled trend in Florida after making the adjustment described above. The first class affected by the retention policy entered the 4th grade during the 2004 school year, and thus the first NAEP score that could have been influenced by the exclusion of low-performing students from the 4th-grade NAEP sample was the spring 2005 administration.
The figure shows that Florida’s reading gains prior to the introduction of the policy were actually larger on the NAEP than on the FCAT. Such a difference cannot be explained by the retention policy, because students had not yet been retained. After introduction of the policy, Florida’s achievement on the state exam after accounting for sample selection increased between 2003 and 2005 in a way that did not show up on the NAEP scores. But the state’s NAEP scores quickly caught up to the FCAT performance. Adjusting the state’s NAEP scores for sample selection in 2007 and 2009 leads to a decrease in the state’s performance of about 0.07 and 0.08 standard deviations, respectively. However, Florida’s adjusted median score remains above the median score for all U.S. public-school students, and it continues to show substantial improvements relative to the prior decade.
Even after the adjustment, Florida’s students still made larger gains in reading than did the rest of the nation. The national gain, at 7 points (or about 0.19 standard deviations), was only slightly larger than half Florida’s rate. Prior to the adjustment, only Washington, D.C., made larger gains on the 4th-grade NAEP reading exam during this period. After the adjustment, only D.C. and Delaware made a larger test-score improvement.
What Reforms Might Have Produced the Reading Gains?
Putting a finger on exactly which policy changes produced the test-score improvements is remarkably difficult, because the state adopted a wide array of policies that may have had a beneficial effect. It is possible, however, to rule out some potential candidates.
For example, some have noted the state’s participation in the federal Reading First program, in which public schools received grant money to implement instructional and assessment tools. Florida also supplemented the Reading First grants with its own financing of reading coaches for schools across the state. The data clearly show, however, that any additional test-score gains made by schools that participated in Reading First or had reading coaches were far too small to explain the substantial improvements observed on both the NAEP and the FCAT.
Others have found it tempting to argue that the state’s constitutional amendments to reduce class size and provide universal pre-kindergarten services—both of which could have a sustained positive effect on young kids—are the most likely driver of the gains. Perhaps those reforms will prove effective. The 3rd-grade class of 2003, for which the large gains begin, however, was subject to neither policy.
Current research findings for the accountability and choice reforms adopted by Florida during this time period also appear insufficient to explain such large test-score improvements. Florida assigned letter grades—A, B, C, D, and F—to schools based on their performance on the FCAT. It put into place a school voucher program for students who were attending schools that received the grade of F twice in a row. A tax credit provided scholarships for low-income students. Studies of all these programs have shown that each had a positive effect. And studies have also shown that the retention policy has a positive impact on the performance of students who were retained. Though each of these policies has been tied to student test-score improvements, either the effect size was too small or the policy affected too few students to alone account for the substantial test-score improvements seen on the NAEP and FCAT.
Conclusion
The evidence presented here shows that Florida’s elementary-school students did in fact make large improvements in reading proficiency in the 2000s. As critics contend, the state’s aggregate test-score improvements on the 4th-grade FCAT reading exam—and likely on the NAEP exam as well—are inflated by the change in the number of students who were retained in 3rd grade in accordance with the state’s new test-based promotion policy. Large test-score improvements are also observed, however, among students whose scores were not influenced by changes in the sample selected.
Though somewhat smaller than what is apparent on the NAEP test, the portion of Florida’s reading test-score improvements during this time period that cannot be attributed to changes in the sample of students tested due to the retention policy is nonetheless substantial. Identifying the causes of these improvements remains an important task for future research.
Marcus A. Winters is senior fellow at the Manhattan Institute’s Center for State and Local Leadership and assistant professor at the University of Colorado–Colorado Springs.
This article appeared in the Fall 2012 issue of Education Next. Suggested citation format:
Winters, M.A. (2012). Florida Defeats the Skeptics: Test scores show genuine progress in the Sunshine State. Education Next, 12(4), 64-67.