
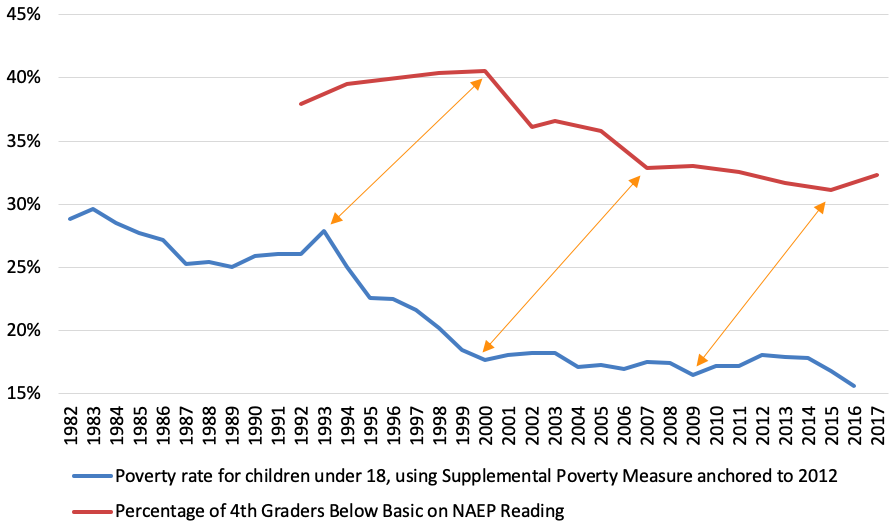
Earlier this summer, I presented a hypothesis: that the rapidly improving economic conditions for the country’s poorest families during the 1990s may have been responsible for much of the progress in student achievement we saw in the 2000s. As you can glimpse in the figure below, it appears that significant economic downturns, and upticks, were followed by similar movements on the National Assessment of Educational Progress—about seven years later for fourth grade scores and thirteen years later for eighth grade.
Figure 1. The “below basic in fourth grade reading rate” versus the supplemental child poverty rate
I find that national picture provocative and compelling. Still, I wondered if we’d see a similar pattern at the state level. Were the states where child poverty declined the most the same states where the “below basic” rate dropped the most?
In a word, no.
Figure 2: Percentage change in the supplemental poverty rate (1991–2000) vs. percentage change in the below basic rate in fourth grade reading (1998–2007)
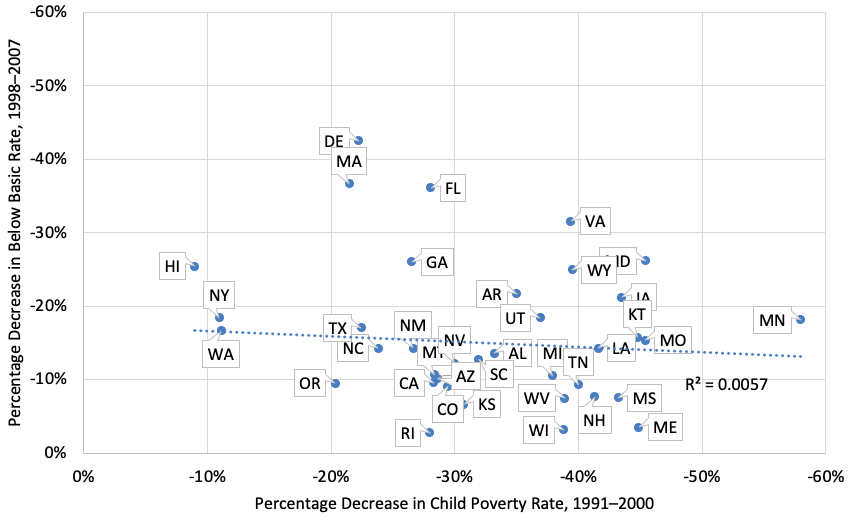
As is evident, there’s no clear relationship between the change in poverty rates and the change in below-basic rates. One explanation is that my hypothesis doesn’t hold water. Another is that other factors were at work that led to very different results for various states—that the declining poverty rate pushed down the below-basic rate everywhere, but some states went farther faster than we’d predict based on their poverty rates alone.
Let’s see which states went farther and try to understand what else might explain their impressive results.
We’ll start by looking at the change in supplemental child poverty rates in the 1990s versus the change in below-basic NAEP rates in the late 90s into the early 2000s. Think of this as the core of the No Child Left Behind era. Here are the states that did the best.
Table 1. Top ten states for percentage change over time in the child poverty/below basic ratio, fourth grade reading, 1998–2007[1]
| State | Children in Poverty, 1991 (%) | Children in Poverty, 2000 (%) | Below Basic, 1998 (%) | Below Basic, 2007 (%) | Change in child poverty/below basic ratio (%) |
| DE | 18.9 | 14.7 | 47 | 27 | 35.4 |
| MA | 24.7 | 19.4 | 30 | 19 | 24.0 |
| HI | 25.6 | 23.3 | 55 | 41 | 22.1 |
| FL | 30.3 | 21.8 | 47 | 30 | 12.7 |
| NY | 30.1 | 26.8 | 38 | 31 | 9.1 |
| WA | 16.2 | 14.4 | 36 | 30 | 6.7 |
| GA | 27.5 | 20.2 | 46 | 34 | -0.6 |
| TX | 28.5 | 22.1 | 41 | 34 | -6.5 |
| NC | 23.5 | 17.9 | 42 | 36 | -11.1 |
| VA | 19.3 | 11.7 | 38 | 26 | -11.4 |
The names on this list should look familiar, given that most of them were the poster children of the early education reform movement. Delaware would later win one of the first Race to the Top grants; Massachusetts is famously the highest achieving state in the nation thanks to the “Massachusetts Miracle” reforms of the 1990s and 2000s; Jeb Bush’s Florida policies have become a model for states nationwide; North Carolina and Texas in many ways inspired the early standards-based reform era. Several of these states also led on scientifically-based reading instruction—notable given these results are for fourth grade reading.
Now let’s see how it looks for other grades and subjects.
Table 2. Fourth grade math, 2000–2007
| State | Children in Poverty, 1993 (%) | Children in Poverty, 2000 (%) | Below Basic, 2000 (%) | Below Basic, 2007 (%) | Change in child poverty/below basic ratio (%) |
| MA | 24.3 | 19.4 | 23 | 7 | 162.3 |
| ND | 15.2 | 12.0 | 27 | 9 | 136.8 |
| MT | 20.7 | 17.7 | 28 | 12 | 99.5 |
| BY | 31.5 | 26.8 | 34 | 15 | 92.8 |
| HI | 24.2 | 23.3 | 45 | 23 | 88.4 |
| AR | 25.2 | 19.5 | 45 | 19 | 83.3 |
| GA | 24.5 | 20.2 | 43 | 21 | 68.8 |
| ID | 21.8 | 17.2 | 32 | 15 | 68.3 |
| KA | 18.2 | 13.3 | 24 | 11 | 59.4 |
| WY | 15.7 | 10.1 | 29 | 12 | 55.5 |
Table 3. Eighth grade reading, 2003–2011
| State | Children in Poverty, 1991 (%) | Children in Poverty, 1999 (%) | Below Basic, 2003 (%) | Below Basic, 2011 (%) | Change in child poverty/below basic ratio (%) |
| HI | 25.6 | 39 | 23 | 32 | 22.4 |
| CT | 15.6 | 23 | 27 | 17 | 19.7 |
| NJ | 20.7 | 21 | 28 | 16 | 11.6 |
| MA | 24.7 | 19 | 34 | 16 | 0.0 |
| WA | 16.2 | 24 | 45 | 23 | -2.7 |
| RI | 21.1 | 29 | 45 | 24 | -3.8 |
| NY | 30.1 | 25 | 43 | 24 | -3.8 |
| MT | 24.7 | 18 | 32 | 14 | -6.3 |
| GA | 27.5 | 31 | 24 | 26 | -6.3 |
| NM | 31.9 | 38 | 29 | 32 | -8.4 |
Table 4. Eighth grade math, 2003–2011
| State | Children in Poverty, 1991 (%) | Children in Poverty, 1999 (%) | Below Basic, 2003 (%) | Below Basic, 2011 (%) | Change in child poverty/below basic ratio (%) |
| MA | 24.7 | 20.8 | 24 | 14 | 44.4 |
| HI | 25.6 | 25.7 | 44 | 32 | 38.0 |
| NJ | 20.7 | 17.6 | 28 | 18 | 32.3 |
| TX | 28.5 | 22.7 | 31 | 19 | 30.0 |
| WA | 16.2 | 15.1 | 28 | 23 | 13.5 |
| RI | 21.1 | 16.8 | 37 | 27 | 9.1 |
| NM | 31.9 | 24.6 | 48 | 36 | 2.8 |
| GA | 27.5 | 21.6 | 41 | 32 | 0.6 |
| DE | 18.9 | 15.1 | 32 | 26 | -1.7 |
| CT | 15.6 | 13.8 | 27 | 25 | -4.5 |
Some states did well across the board or close to it—namely Delaware, Massachusetts, New York, Texas, Georgia, Hawaii, and Washington. Several of these states displayed impressive reform credentials during that time period. A few of the other states that did well too leave me scratching my head, given that they aren’t known for reform-minded policies, or really much of anything: Montana, North Dakota, and New Mexico (in the pre-Hanna Skandera era) to be exact.
That all feels a bit like ancient history, however. Now let’s look at the more recent results—during a time period when the Great Recession created challenging economic conditions and most states struggled to keep their teachers paid and their achievement scores from declining.
Table 5. Fourth grade reading, 2009–2017
| State | Children in Poverty, 2000 (%) | Children in Poverty, 2007 (%) | Below Basic, 2009 (%) | Below Basic, 2017 (%) | Change in child poverty/below basic ratio (%) |
| IN | 10.4 | 15.6 | 30 | 27 | 66.7 |
| MN | 9.0 | 10.5 | 30 | 29 | 20.7 |
| CA | 25.1 | 25.5 | 46 | 39 | 19.8 |
| MD | 11.3 | 13.7 | 30 | 31 | 17.3 |
| MS | 19.3 | 20.1 | 45 | 40 | 17.2 |
| VA | 11.7 | 13.6 | 26 | 26 | 16.2 |
| RI | 15.2 | 16.6 | 31 | 31 | 9.2 |
| UT | 11.8 | 10.8 | 33 | 28 | 7.9 |
| SD | 9.6 | 10.7 | 30 | 31 | 7.9 |
| AZ | 21.7 | 20.7 | 44 | 39 | 7.6 |
Table 6. Fourth grade math, 2009–2017
| State | Children in Poverty, 2000 (%) | Children in Poverty, 2007 (%) | Below Basic, 2009 (%) | Below Basic, 2017 (%) | Change over time, child poverty/below basic ratio (%) |
| MS | 19.3 | 20.1 | 31 | 23 | 40.4 |
| IN | 10.4 | 15.6 | 13 | 14 | 39.3 |
| VA | 11.7 | 13.6 | 15 | 13 | 34.1 |
| AZ | 21.7 | 20.7 | 29 | 27 | 2.5 |
| AL | 18.1 | 16.6 | 30 | 27 | 1.9 |
| TN | 16.8 | 14.8 | 26 | 23 | -0.4 |
| RI | 15.2 | 16.6 | 19 | 21 | -1.2 |
| NE | 11.6 | 9.5 | 18 | 15 | -1.7 |
| CA | 25.1 | 25.5 | 28 | 29 | -1.9 |
| FL | 21.8 | 18.3 | 14 | 12 | -2.1 |
Table 7. Eighth grade reading, 2009–2017
| State | Children in Poverty, 2000 (%) | Children in Poverty, 2007 (%) | Below Basic, 2009 (%) | Below Basic, 2017 (%) | Change over time, child poverty/below basic ratio (%) |
| IN | 10.4 | 15.6 | 21 | 18 | 75.0 |
| CA | 25.1 | 25.5 | 36 | 28 | 30.6 |
| RI | 15.2 | 16.6 | 28 | 25 | 22.3 |
| AZ | 21.7 | 20.7 | 32 | 25 | 22.1 |
| MI | 14.9 | 15.0 | 28 | 24 | 17.4 |
| MS | 19.3 | 20.1 | 38 | 34 | 16.4 |
| NV | 16.1 | 15.4 | 35 | 29 | 15.4 |
| VA | 11.7 | 13.6 | 22 | 23 | 11.2 |
| MD | 11.3 | 13.7 | 23 | 26 | 7.2 |
| GA | 20.2 | 18.0 | 28 | 24 | 4.0 |
Table 8. Eighth grade math, 2009–2017
| State | Children in Poverty, 2000 (%) | Children in Poverty, 2007 (%) | Below Basic, 2009 (%) | Below Basic, 2017 (%) | Change over time, child poverty/below basic ratio (%) |
| IN | 10.4 | 15.6 | 22 | 25 | 32.0 |
| VA | 11.7 | 13.6 | 24 | 23 | 21.3 |
| MS | 19.3 | 20.1 | 46 | 41 | 16.8 |
| CA | 25.1 | 25.5 | 41 | 38 | 9.6 |
| AZ | 21.7 | 20.7 | 33 | 29 | 8.5 |
| RI | 15.2 | 16.6 | 32 | 34 | 2.8 |
| MN | 9.0 | 10.5 | 17 | 20 | -0.8 |
| MI | 14.9 | 15.0 | 32 | 33 | -2.4 |
| TN | 16.8 | 14.8 | 35 | 32 | -3.6 |
| NV | 16.1 | 15.4 | 37 | 38 | -6.9 |
Now we have a new set of states in the winner’s circle. Knocking it out of the park is Indiana, winner of our Ed Reform Idol contest, which faced brutal economic conditions after the Great Recession but made progress in some grade levels nonetheless. California also placed on all four lists—intriguing evidence that the Jerry Brown/Mike Kirst effort to boost funding while driving decisions to the local level may be paying off. Rhode Island hit a grand slam, too—way to go, Deb Gist. Arizona crushed it as well—someone tell Matt Ladner—perhaps because of its combination of widespread choice and thoughtful standards-based reform. Race to the Top favorite Tennessee scored in two categories. Florida is back on the list, this time for math instead of reading. And don’t overlook Mississippi, which has been making sure and steady progress even as its neighbor to the west, Louisiana, gets all of the national attention.
Several of these states are the same ones that look impressive according to “America’s Gradebook,” an analysis from Matt Chingos and his team at the Urban Institute—even though theirs is a snapshot in time, and mine examines progress over almost a decade.
To be sure, some states present a puzzle—they haven’t been particularly bold on reform, or generous on spending, yet got impressive results over the past decade. Virginia is at the top of that list. Michigan (yes, Michigan!), too.
Still, during both the NCLB era and more recent years, the lists have a clear reformy slant.
* * *
As I’ve written before in this series, I understand that the simple analyses I’ve presented here don’t count as rigorous evidence. I would love to see proper methodologists dig into these questions, too, and try to “decompose” the national and state-level NAEP results to determine what might explain them, and how much credit (or blame) goes to socioeconomic conditions, reform efforts, additional spending, or other factors.
From what I’ve seen, though, I’m ready to offer this tentative conclusion: Big national trends, such as we see on the National Assessment of Educational Progress, or high school graduation or college completion rates, are driven mostly, though not entirely, by big national socioeconomic trends. The booming 1990s had a bigger impact on NCLB-era gains than we understood at the time, and the Great Recession created a fiercer headwind than we understood, as well. Given that we’re now experiencing another historic boom—one that is finally lifting the wages of the lowest-income workers—we should expect child poverty rates to continue to fall and student achievement—after some delay—to start to rise. That is, if past is prologue.
Yet demography is not destiny. As we know for individual children, as well as individual schools, great effort can allow people or institutions to beat the odds. So it is with states. All jurisdictions should benefit from today’s economic conditions, but some will see their students go further faster depending on the policies their leaders put in place.
Which states are ready to lead during the next phase of education reform?
Editor’s note: This is the sixth in a series of posts looking at whether the nation’s schools have improved over the past quarter-century or so. The first two demonstrated that student outcomes rose significantly for the lowest-performing students and children of color from the late-1990s until the Great Recession—especially in reading and math, but in other academic subjects, too. The third post argued that this educational progress coincided with dramatically improving conditions for our poorest families. In particular, the “supplemental poverty rate” plummeted for children of color in the 1990s and into the 2000s. The fourth post looked at the potential relationship between poverty rates and academic achievement trends. Finally, the fifth installment argued that standards-based reform and a surge in school spending also deserve credit for rising achievement in the late 1990s into the 2000s.
Mike Petrilli is president of the Thomas B. Fordham Institute, research fellow at Stanford University’s Hoover Institution, and executive editor of Education Next.
This post originally appeared in Flypaper.
Note:
1. We found the ratio between the supplemental child poverty rate at the time of a cohort’s birth and the NAEP below-basic rate when the cohort was assessed—the poverty/below basic ratio—for the 1991 and 1998 birth cohorts. We then found the percentage change in the poverty/below basic ratio between the 1991 cohort and 1998 cohorts, as displayed in the last column in the table. States with larger percentage changes were able to narrow the gap between the child poverty rate and the NAEP below-basic rate over time. States with positive percentage changes saw improvements in student test scores at a rate that outpaced the state’s decrease in childhood poverty.