
As I indicated last week, I plan to spend the summer writing about whether our schools have improved over the past quarter-century or so—essentially the “reform era.”
There’s little doubt, I argued, that outcomes improved dramatically for the lowest-performing students and for children of color from the mid-1990s until the onset of the Great Recession, at least in the key subjects of reading and math. That was especially the case in elementary and middle schools, though high school graduation and college-completion rates were up sharply as well, even if some of that progress might be due to slipping standards.
A fair question, though, is whether this progress was limited to these two basic subjects, especially since they were the focus of state and federal accountability systems over this period. So let’s take a look at results from the National Assessment of Educational Progress for most of the other academic subjects, too. As has been my practice in the past, we’ll examine trends over time for the national sample, broken down by the major racial groups, as well as by percentiles. This will give us much better information than looking at averages alone.
You can peruse the NAEP charts* below and come to your own conclusions, but here’s what I see:
• Compared to the other subjects, the progress in math started earlier and was more widespread. In most subjects, we didn’t see gains until the late 1990s into the early 2000s. But math improvement started as soon as the “main NAEP” commenced in 1990, and continued all the way until 2013. And it didn’t just focus on the lowest-performing students, but was apparent in the middle and at the top of the performance spectrum, too. Perhaps most notably, even twelfth graders demonstrated progress in math—something we don’t see for most other subjects.
• After calamitous years in the mid-1990s, the reading achievement of our lowest-performing students and students of color boomed in the late 1990s into the early 2000s. This happened first for fourth graders and then for eighth graders. White students and students in the middle and at the top of the performance spectrum made some gains, too, but they were more modest. Most of the positive trends flipped around 2013. And over the whole period, the twelfth grade trends are flat or down slightly.
• The writing trends for fourth and eighth graders look similar to those for reading. We see big jumps in achievement for fourth grade students of color between 1998 and 2002—which unfortunately were the only years the NAEP gave that test. Eighth grade black and Hispanic students also demonstrated solid growth through 2007. And twelfth grade? Flat or down from 1998 through 2011.
• The trends for science look like a blend of those for reading and math. Like math, the progress for fourth and eighth graders was widespread—across all racial groups and percentile levels. But they were relatively modest, except for the lowest performers—akin to reading. And (repeat after me): For twelfth grade, the trends were mostly flat or down slightly.
• The U.S. history trends look much like those for reading. There was solid progress for fourth and eighth graders, especially for kids of color and those at the low end and the middle of the performance spectrum. And there’s finally some good news on the twelfth grade front: Achievement was up ever so slightly from 1994 to 2010 across the three major racial groups.
• The trends for civics mirror those for reading and writing. The also resemble those in U.S. history, except civics achievement is flat or down slightly at the twelfth-grade level. But there were solid gains in fourth and eighth grades, especially for low-performing kids and students of color.
This is dense stuff. What does it all mean?
First, at the fourth and eighth grade levels, progress in student achievement went well beyond reading and math, especially for low-performing students and students of color, at least until 2007 or so. For example, the writing achievement of Hispanic eighth graders rose by 11 points between 1998 and 2007. The science achievement of black fourth graders rose 13 points from 1996 to 2015. Black eighth graders boosted their U.S. history achievement by 13 points from 1994 to 2014. Hispanic fourth graders gained 17 points on the civics test from 1998 to 2010. This progress is not as dramatic as what we see for reading and especially math, but it’s not nothing, signifying gains of about a grade level or so in each case.
Second, there’s no escaping the conclusion that there’s been little to no improvement at the twelfth grade level. This disappointment is something of a mystery, one I’ll return to later this summer. But needless to say, it’s not good.
Third, it’s hard to imagine that these various trends aren’t linked. It would stand to reason that as reading skills improve, students’ ability to understand other subjects like history and civics will improve as well. (It could also be, as E.D. Hirsch, Jr., has long argued, that students’ reading skills improve as they gain content knowledge.) Of course, it’s possible that our schools got better at teaching these other subjects, as well—a counterintuitive finding, if true, given all the talk about No Child Left Behind et al. “narrowing the curriculum.”
—
Fourth and eighth graders made progress across the entirety of the academic curriculum from the late 1990s until the Great Recession—especially our lowest performing students and students of color. Next week we’ll start to examine whether schools—and school reform—deserve credit for this encouraging progress, as well as the disappointing results over the last decade.
Figure 1. NAEP average scale scores by race/ethnicity, subject, and year
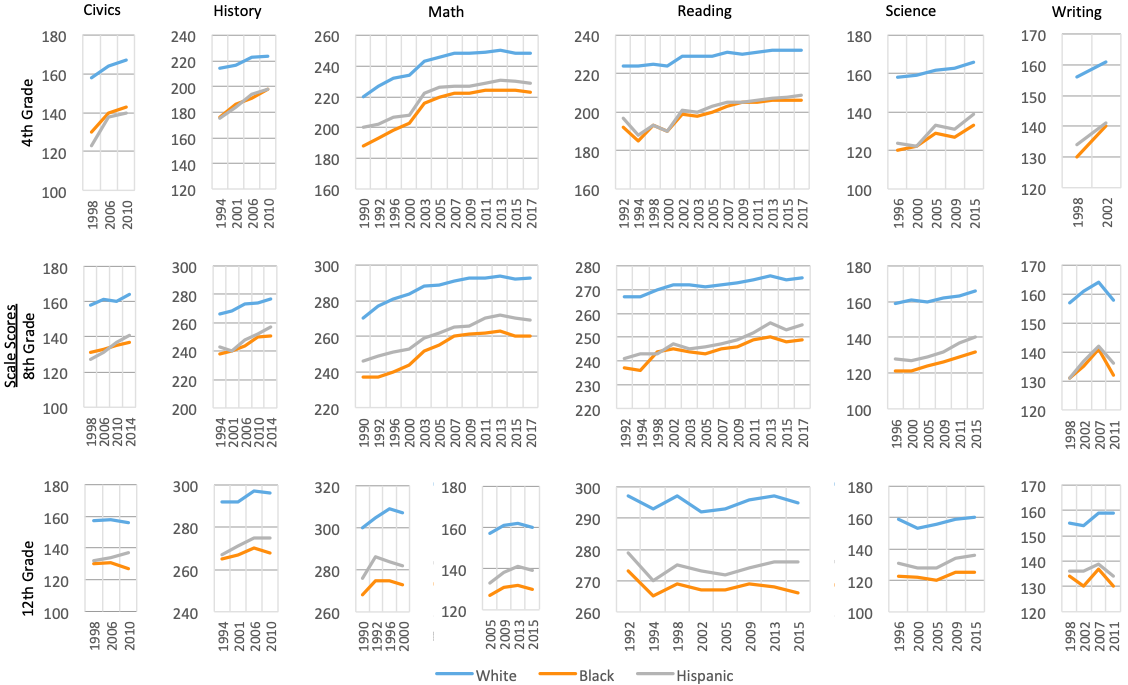
Figure 2. NAEP average scale scores by percentile, subject, and year
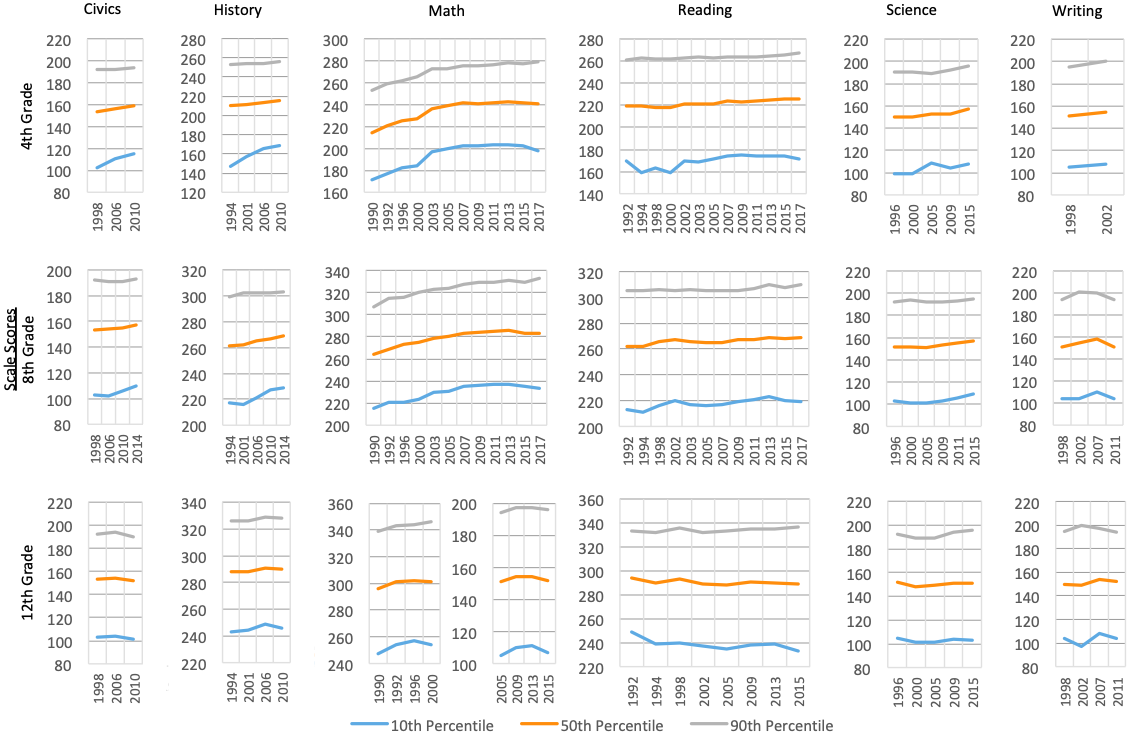
*Note that changes in testing frameworks occurred in several subjects. The framework for science changed in 2009, and the framework for writing changed in 2011. Direct comparisons between results from before and after these framework changes cannot be made. The framework for math changed in 2005. Changes in the math framework for grades four and eight were minimal, so a continuous comparison can be made over time. Changes in the twelfth grade math framework were more extensive and included changes to scoring, so comparison of results from before and after the 2005 framework change cannot be made.
Special thanks to Kara Long, Fordham Institute research intern, for her assistance with the data.
Mike Petrilli is president of the Thomas B. Fordham Institute, research fellow at Stanford University’s Hoover Institution, and executive editor of Education Next.
This post originally appeared in Flypaper.