Huge flows of data have transformed a wide array of businesses, and the next wave is flowing from technology-enhanced learning environments. If we are to use these data to make sound decisions for learners, we have to take a “learning engineering” approach: understand and invest in “good” data, and let it guide both our imaginations and our practical decisions.
Whether you look at retail, gaming, finance, marketing, or health care, the inventive use of data is redefining the landscape of choices. Amazon’s finely developed suggestion engine and Pandora’s choices about what to play next work because companies can make increasingly accurate predictions of what you will “need” next by analyzing large amounts of information.
“Big data” has now arrived for learning.
Historically, learning experiences generated little empirical data; with online learning, possibilities for the humble transcript are changing dramatically. In K–12 education, a traditional transcript might hold 120 bits of information. Let’s compare that to a primitive online system that stores the grades for every lesson every day. Say 10 items per lesson are graded, and each needs 8 bits for the grade; that’s 80 bits per lesson per day. If we assume 5 lessons per day, 180 academic days in a year, we’ve now collected 72,000 bits per year, compared with 120 bits in the “old school” method—that’s 600 times the data!
Modern learning systems can track “clickstreams,” following a student’s mouse as it clicks on various links. If we assume that a student spends three hours using the screen each day, the system might store about 3,000 bits of data per day and 540,000 bits of data each year. If even half of the roughly 50 million U.S. K–12 students were working on such a system, in theory, we could be capturing a seemingly astounding 25 terabytes of data each year. Combining things like Common Core formative assessment results with clickstream data, we could amass enormous data sets to explore.
This data flood isn’t just theory. It’s lapping at our shores, waiting for us to wade in. Education providers are generating more data than ever before and using it in new and highly productive ways. Students view Khan Academy’s online videos and do its online exercises and assessments millions of times each month, and Khan is building algorithms that run tests with the resulting data to improve its offerings. New high-volume online higher-education providers like edX, Coursera, and Udacity are talking about ways to mine the data from their interactions to improve learning.
Simply collecting data can give useful insights. For example, Kaplan (where I am chief learning officer) possesses a huge amount of data—billions of records—from people taking practice tests over many years as they prepare for exams like the MCAT. Analyzing these data, we recently found that while students believe that organic chemistry is the hardest topic and most important to study for the MCAT, physics is actually harder for most students, and more important for the exam. That knowledge has changed how we guide students as they prepare for the exam, and as they take the exam, we can watch to see whether the changes we made have an impact on their results.
Once we have fast access to “big data,” we can move beyond passive data analysis. People at Facebook, Zynga, Google, and Amazon run many empirical tests every week to determine whether ideas translate to measurable changes in performance.
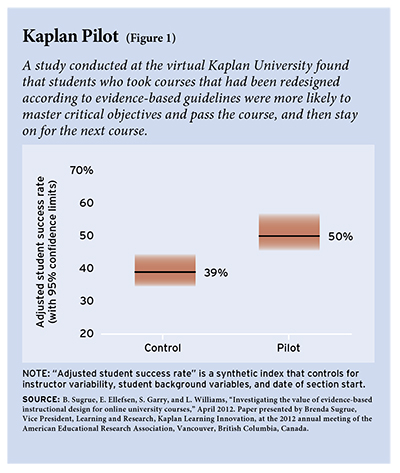 This approach works for learning, too. We recently completed a set of studies within our virtual Kaplan University (KU), which has more than 50,000 students working online, with technology-delivered materials and with faculty. We tested the impact on learners of applying evidence-based learning science—from such sources as Ruth C. Clark and Richard E. Mayer’s e-Learning and the Science of Instruction: Proven Guidelines for Consumers and Designers of Multimedia Learning—to courses: we altered the instructional design, how we collected and used evidence about the motivation of learners to guide faculty intervention, how we trained the faculty and what role they had, how we guided the grading, and more. A controlled trial of approximately 1,000 students across three courses over a six-month period confirmed that these changes led to statistically significant differences in student success: whether students mastered critical objectives and passed the course and stayed on for their next course (see Figure 1). (Brenda Sugrue presented the results at the April 2012 American Educational Research Association [AERA] conference in Vancouver.)
Within and across education organizations, the opportunity to build “pipelines” of controlled trials to compare different instructional approaches is vast. With enough students and data about their characteristics—before and during the current learning experience—analysts can identify the interventions that work best for particular student subgroups. This means providers can approach such groups of students with confidence that there is a route that can get them to their goals.
So floods of data can be of great benefit. Floods can also be overwhelming. As Education Next editor Frederick Hess and I explain in a forthcoming book about learning science, technology, and education leadership, to make the best use of data we need to take a “learning engineering” approach. This means being deeply engaged by data and evidence, from both our own research and research elsewhere, without losing track of the task: building affordable, usable, effective, scalable, efficient solutions for the range of learning challenges.
Students, families, and policymakers experience a raft of data-driven products and services every day. Companies know what we like, what we buy, what we look at online—and they use these data to connect us with more things we will like and hopefully buy. Similar data streams can reveal what we know and how we learn. Thoughtfully generated and creatively employed, these data can make the learning experience more effective, more efficient, and potentially much more enjoyable.
As chief learning officer at Kaplan, Inc., Bror Saxberg works to help systematically improve learning by applying what’s known about learning and evidence from Kaplan’s own learners.
This article appeared in the Winter 2013 issue of Education Next. Suggested citation format:
Saxburg, B. (2013). A River of Data: Making the learning experience more effective. Education Next, 13(1), 86-87.