
Executive Summary
School choice is at the center of the Trump administration’s education policy efforts, with initial proposals calling for additional funding for charters and other forms of public school choice, as well as the creation of a new federal private school choice program. Some advocates have raised concerns about whether expanding school choice will help disadvantaged families, especially in rural areas and other places where there may not be many schools from which to choose.
Concerns about potential inequities in the availability of different schools to different families, based in large part on geography, are plausible but have not been subject to systematic empirical analysis. In this report, we begin to fill this gap by using nationwide data on the locations of public and private elementary schools to calculate the percent of American families that could potentially gain access to new school options under different national school choice policies. This baseline analysis of school locations does not consider important issues such as school capacity, existing choice programs, or possible changes in the supply of different kinds of schools that might result from choice policies.
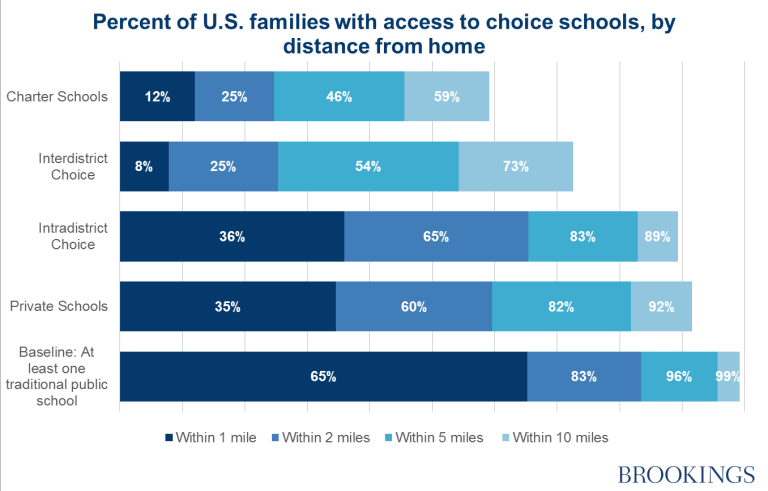
We estimate that private school choice and intradistrict choice (allowing families to choose any traditional public school in their district) have the largest potential to expand the sets of schools to which families have access, with more than 80 percent of families having at least one of these “choice” schools within five miles of home. Charters and interdistrict choice (allowing families to choose a traditional public school outside their district) still would provide potential new options within five miles for roughly half of families.
Families with household incomes below the poverty line are more likely to have an intradistrict choice school or charter school nearby than families above the poverty line. We find few differences in proximity to private schools based on poverty. However, interdistrict choice appears likely to provide more new choices to families not in poverty. We find the largest differences in proximity to schools of choice between families in rural and urban areas. At least 60 percent of rural families are within ten miles of intradistrict choice, interdistrict choice, and private schools, but urban families are more likely to have these choices close by.
The distance families are able and willing to travel may be more important for expanding school choice than the type of school the policy provides access to. For example, by increasing “as the crow flies” travel distance from one mile to five miles, we more than double the number of families who could potentially take advantage of a private school or an intradistrict choice policy. We also find that the potential availability of choice varies widely across states. For example, 95 percent of California and Massachusetts families live within five miles of a private school, compared to less than 60 percent of Montana and West Virginia families.
We conclude that federal policymakers seeking to expand school choice should focus on policies that can function well in different contexts across the U.S.. For example, some states may want to focus on securing additional funding to improve equity of access to high-quality schools by providing better transportation options. Others may want to focus on expanding their charter or private school sectors, or on fostering more choice within the traditional public sector. A natural federal role is to provide resources to support such varied efforts through formula funding or competitive grant programs.
Introduction
School choice is the main, if not the singular, education policy focus of the Trump administration so far. Education Secretary Betsy DeVos was a leading member of the school choice advocacy community, and Donald Trump has called for a congressional bill that would fund school choice for disadvantaged youth, stating that “families should be free to choose the public, private, charter, magnet, religious or home school that is right for them.”[1]
The administration has yet to release a proposal for how the federal government might foster more school choice in states and localities around the country, although its initial budget proposal included additional funding for charters and other forms of public school choice, as well as funding for a new private school choice program.[2] Left-leaning policymakers and commentators have raised concerns about whether such policies will help disadvantaged children. Senator Patty Murray has argued that, for students in rural areas, “their public school is the only real option and claims to the contrary only amount to ‘false choice.’”[3] Likewise, the Center for American Progress released a report entitled “Vouchers Are Not a Viable Solution for Vast Swaths of America.”[4]
It is certainly true that a policy focused on increasing education choices can, at least initially, only be effective for students with such choices nearby. But there is little systematic, high-quality evidence on the proximity of different kinds of schools to families with school-aged children, especially those with low incomes and those who live in rural areas. As a result, it is unclear how different kinds of choice policies might expand the educational choices of children nationwide and in each state.
In this report, we use nationwide data on the locations of public and private elementary schools to calculate the percent of American families that could potentially gain access to new school options under different national school choice policies.
Methodology
The goal of our analysis is to provide baseline information on the locations of existing schools of different types relative to where students live. For the purpose of our calculations, we begin with the assumption that all families only have access to a single traditional public elementary school within their school attendance zone. This is true for approximately three-quarters of families for which school attendance boundary information is available.[5] We ignore existing choices, such as charter schools, private school vouchers, and interdistrict choice plans, because we do not have systematic data on all of these policies.
We also set aside important issues of school capacity and potential responses to a new school choice policy (such as the opening of new schools or closing of existing ones). Just because a student lives near a school does not mean that she can access it. The school may be too difficult to travel to on a regular basis, may not have space, or may have admissions requirements. As a result, our results should be interpreted as the overall availability of different kinds of school options and not necessarily the marginal increase in access that would result from a new policy change (federal or otherwise).
We use Census and school location data to estimate the percentage of families with school-age children that have different kinds of elementary schools within one, two, five, or ten miles (as the crow flies) from the center of their Census block group (which we loosely refer to as their “home” in the remainder of this report). We focus on the share of families that might access a “choice” school under four different policies (within each of the four distances):
1. Intradistrict choice: Allow families access to any public traditional elementary school within their school district (i.e., not just within their attendance zones).
2. Interdistrict choice: Allow families access to any public traditional elementary school outside of their school district.
3. Charter school choice: Allow families access to any charter elementary school in their state, whether inside or outside of their school district.
4. Private school choice: Allow families access to any private elementary school in their state.
The details of the methodology and data we use are described in the appendix. Our analysis focuses on new school options—traditional public, charter, and private—that families might gain access to under different kinds of choice policies. We also examine results separately for families with incomes below the poverty line (i.e., the poorest 19 percent of families), as compared to those at or above the poverty line, and families who live in rural areas (17 percent of all families), as compared to those in more urban areas.
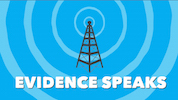
As a baseline, we note that 96 percent of all families with school-age children have at least one traditional public school within five miles of home (appendix figure 1). This baseline statistic is similar for families below the poverty line (96 percent), but lower for rural families (78 percent, compared to 99 percent for urban families). Expanding the distance considered to ten miles increases the share of families with access to at least one traditional public school to 99 percent (including 97 percent of rural families).
Potential access to different kinds of choice schools
Intradistrict choice
Under an intradistrict choice policy, a family is able to choose any traditional public school within their school district, even if it falls outside of their local school attendance zone. Intradistrict choice is necessarily dependent on district size. If a school district has only one elementary school, as is the case in some small New England districts, intradistrict choice will not have an impact.
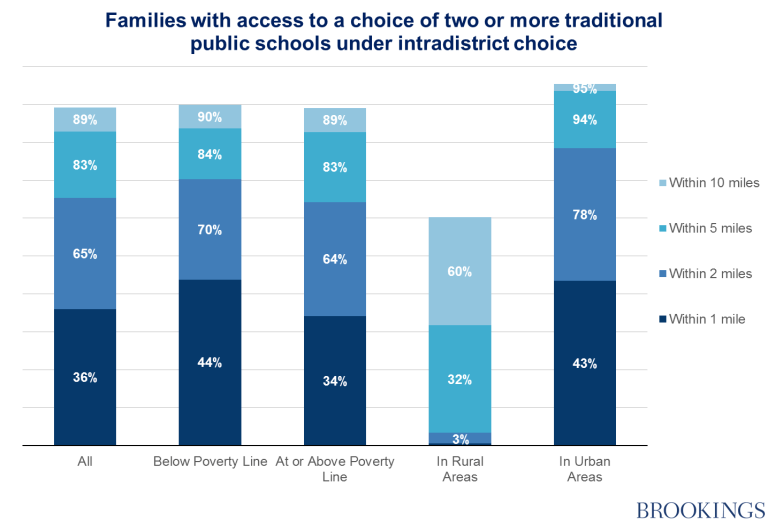
We estimate that 83 percent of families would have access to a choice of at least two public elementary schools within five miles within their school district. However, just 60 percent of rural families would have access to such a choice, even within a ten-mile radius (figure 1). Families in poverty are more likely to have within-district traditional public schools within one or two miles, but these differences narrow at longer distances.
Figure 1. Intradistrict choice
Interdistrict choice
Under an interdistrict choice policy, a family is able to choose any traditional public school outside their school district. Interdistrict choice policies typically require consent of the receiving district, dependent on seat availability and other factors. For our analysis, we assume that all districts within a family’s state are able to receive students. As with intradistrict choice, the impact of interdistrict choice is dependent on district size. Families living in an area with several small school districts may have more choice, while those who live in the center of large school districts may not have any additional choices from this policy.
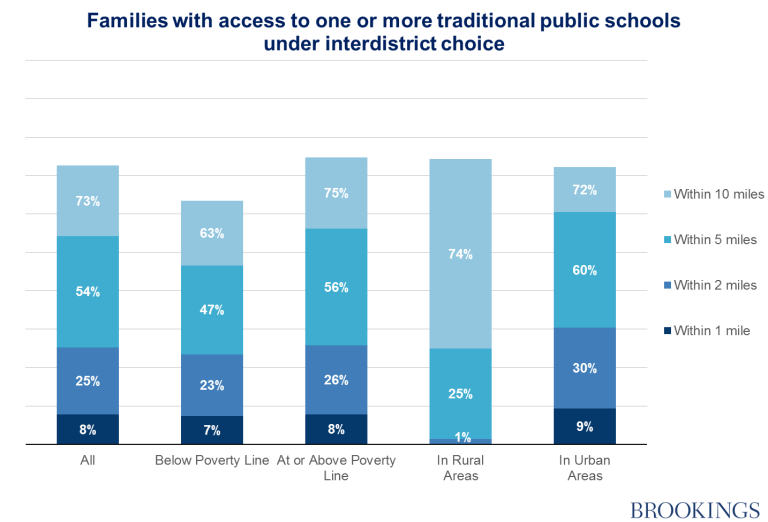
We estimate that, under an interdistrict choice policy, 54 percent of all families would have access to at least one out-of-district choice school within five miles. Unlike intradistrict choice, we find that an interdistrict choice policy would reach slightly more families who live in rural areas (74 percent) than those who live in urban areas (72 percent) at a radius of ten miles from home. However, families in rural areas are much more likely to have to travel 5 to 10 miles to reach the choice school.
Interdistrict choice would provide new potential options to a smaller share of families in poverty, compared to those at or above the poverty line, especially when the options are farther from home. For example, interdistrict choice would provide new options to 47 percent of families in poverty within five miles, compared to 56 percent of other families.
Figure 2. Interdistrict choice
Charter schools
In the preceding analyses, we excluded charter schools so we could focus on choice policies within the traditional public school system. To estimate the impact of existing charter schools on choice, we relax this assumption and examine the relative locations of families and charter schools in their state. Access to charter schools depends heavily on state and local policy. In our data from the 2014-2015 school year, eight states had no operating charter schools.
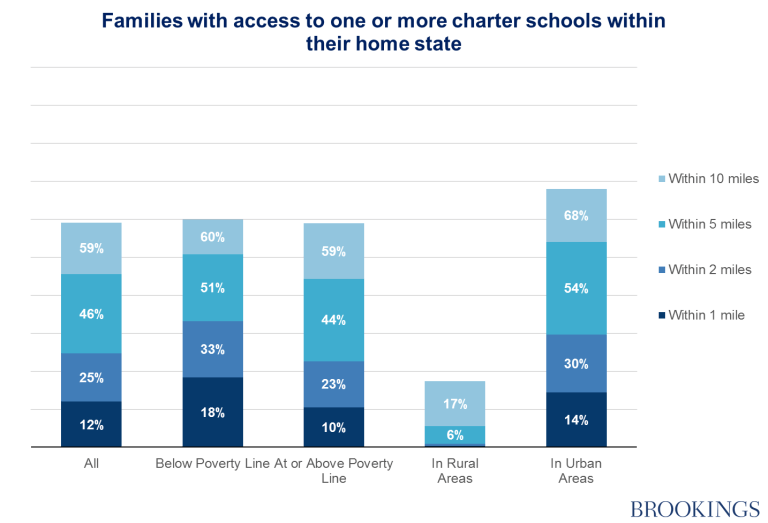
We estimate that 46 percent of all families have access to at least one charter school within five miles (figure 3). Many charter schools focus on serving low-income students, and we observe that families below the poverty line are more likely to have a charter school nearby (51 percent have access within five miles, vs. 44 percent for families at or above the poverty line). However, access is highly concentrated among families in urban areas (68 percent have access within ten miles, vs. 17 percent in rural areas).
Figure 3. Charter schools
Private schools
Finally, we estimate the impact of allowing access to any private school in the family’s state of residence. In essence, we estimate the impact of a universal voucher program, with no limitations on family eligibility and in which all private elementary schools participate. This could be considered the “upper bound” on the impact of a national voucher program using currently-operating schools. Many current voucher or tax-credit scholarship programs implement school requirements, such as background checks, nondiscrimination requirements, or testing requirements, that could limit private school participation.
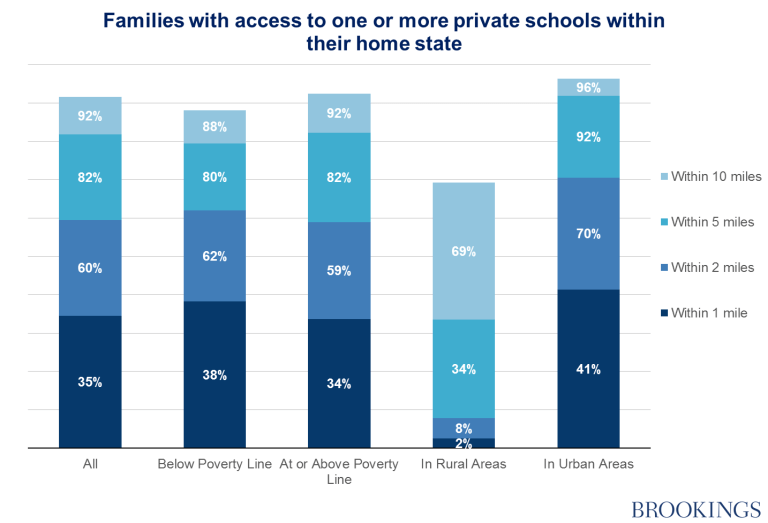
We estimate that 82 percent of families have access to a private elementary school within a five-mile radius of their home (figure 4). Similar to our analysis of charter schools, access to private schools is much higher for families from urban areas relative to families from rural areas (although the difference is not as large). Families below the poverty line are slightly more likely to have a private school within one and two miles of home, though this difference is not as large as for charter schools, and families above poverty line have slightly more access at the five and ten mile mark.
Figure 4. Private schools
Assessing the relative impact of school choice proposals
We can use these estimates to compare the overall potential impact of implementing different kinds of choice policies nationwide. We estimate that intradistrict and private school choice most expand the sets of schools to which families have access, affecting up to about 80 percent of families willing and able to travel up to five miles. Charters and interdistrict choice would still provide potential new options within five miles for roughly half of families.
Perhaps the most important implication of figure 5 is that the distance families are able and willing to travel may be more important for expanding school choice than the type of school the policy provides access to. For example, expanding distance from one mile to five more than doubles the number of families who could gain access to a choice of at least two public schools under an intradistrict choice policy. The same is true for private school choice.
This is easier said than done, as travel time is costly. We estimate that the average difference between a school within two miles and a school within two to five miles is roughly six additional driving minutes for families in both rural and urban areas. Because many school districts provide transportation to a student’s neighborhood school, but not to a district choice school or to a private school, this transportation hurdle could be even higher.[6] Research based on data from Washington, DC, which does not provide yellow bus transportation to most students, indicates that parents are willing to choose an elementary school that has proficiency rates that are 11 percentage lower if the school is one mile closer to them.[7]
Figure 5. Comparing potential effects of different choice policies
An obvious implication of this analysis is that federal policymakers seeking to expand families’ access to a larger number of schools (and school types) might seek to accomplish this goal in part by helping families access schools which they are eligible to attend under existing choice policies. For example, Congress could authorize a program that provides grants to states or districts to help cover the costs of transporting students to schools of choice. Such a policy would help support state and local choice programs without inserting the federal government into decisions about the design and operation of such programs.
More generally, federal policymakers seeking to expand school choice need to bear in mind the widely varying contexts across jurisdictions. Appendix table 1 reports our main estimates of potential school access within five miles for each state. These measures vary widely among states. For example, 95 percent of California and Massachusetts families live within five miles of a private school, compared to less than 60 percent of Montana and West Virginia families. Additionally, interdistrict choice would open up more options for families in states with many smaller districts (e.g., 49 percent of New York families) than in states with fewer large districts (e.g., 15 percent of Florida families).
This variation highlights the challenge of designing federal policies that work well in states that vary in terms of district size, charter enrollment, size of the private sector, and existing choice policies such as interdistrict choice, charters, and vouchers. For example, a state with a relatively new charter sector may want to focus on supporting the creation and growth of high-quality charters, whereas one with a more mature charter sector may want to focus on increasing the involvement of an existing private sector that is significant in size and geographic reach but has not historically served large numbers of disadvantaged students.
Alternatively, a state without strong political support for charters or vouchers may want to focus on providing more equitable access to high-quality schools within the traditional public sector. The most appropriate role for the federal government may be to provide resources to states through categorical formula funding or a competitive grant program that would allow policy design to fit the local context rather than try to act as a national school board from Washington, DC.
— Matthew M. Chingos and Kristin Blagg
Matthew M. Chingos is a Senior Fellow at the Urban Institute. Kristin Blagg is a Research Associate II at the Urban Institute.
This post originally appeared as part of Evidence Speaks, a weekly series of reports and notes by a standing panel of researchers under the editorship of Russ Whitehurst.
The author(s) were not paid by any entity outside of Brookings to write this particular article and did not receive financial support from or serve in a leadership position with any entity whose political or financial interests could be affected by this article.
Appendix: Details of Methodology
For this analysis, we use the most recent available data on the locations of public and private elementary schools. We define elementary schools as any school that offered a low grade of prekindergarten, kindergarten, first, second, or third grade, and a high grade of at least second grade.
Data on private elementary schools come from the 2011-2012 NCES Private School Universe Survey (PSS).[8] Included in the PSS sample is any school that was classified as a regular school, Montessori school, or special program emphasis school (e.g. science or math school or performing arts school). Data on public elementary schools come from the 2014-2015 NCES Common Core of Data (CCD) School Universe Survey. Included in the CCD sample is any non-virtual regular school which had a starting year school status of “added”, “changed agency”, “new”, “open”, or “reopened.”
We use Census block groups, and mean centers of population for these block groups, as defined by the 2010 U.S. Census. The block groups are also classified as rural or urban based on 2010 Census designations. We classify as urban any Census block group which is more than 50 percent urban (including both urbanized areas and urban clusters). We classify as rural any Census block group which is more than 50 percent rural. A very small number of Census block groups (comprising less than 0.1 percent of families in our sample) are not defined as either rural or urban.
Approximately 17 percent of families in our sample live in rural Census block groups. More information on the rural designation, including interactive maps, can be found on the Rural America website from the U.S. Census Bureau.[9]
We use the 2015 5-year estimates from the American Community Survey to estimate the number of families with school-aged children (age 5 to 17 years), both overall and broken down by whether the family income is below or above the poverty level.[10] The poverty level is estimated as the U.S. poverty threshold for a given family size and composition. Approximately 19 percent of families in our sample are classified as below the poverty level.
To obtain estimates of proximity to schools, we measure great-circle, or “as the crow flies,” distance from each block group’s mean center of population to the coordinates of the nearest 100 elementary schools. Using data from a random sample of 500 rural Census blocks and the nearest school, we confirm that great-circle distance is highly correlated (r=0.81) with the driving time between the two points as estimated by Google Maps. For our sample of rural Census blocks, a great-circle mile is, on average, equivalent to a 4-minute drive to the nearest school. For a random sample of 500 urban Census blocks and the nearest school, great-circle distance is also highly correlated (r=0.86) with the Google-estimated drive time between the two points. For our urban sample, a great-circle mile is, on average, equivalent to a 10-minute drive.
For our analysis, we categorize schools as within a radius of one, two, five, or ten miles of the mean centers of population for the block groups. We also categorize schools as being within, or outside, the elementary or unified school district boundaries (as defined in 2014-2015) for each mean center of population for Census block groups.
Appendix figure 1: Access to at least one public school within district
Appendix table 1: Access by state

Notes:
1. https://www.whitehouse.gov/the-press-office/2017/02/28/remarks-president-trump-joint-address-congress
2. http://www.politico.com/tipsheets/morning-education/2017/03/trumps-skinny-budget-to-boost-school-choice-219264
3. https://www.help.senate.gov/imo/media/doc/Murray_Privatization%20Caucus%20Memo.pdf
4. https://www.americanprogress.org/issues/education/news/2017/03/03/414853/vouchers-are-not-a-viable-solution-for-vast-swaths-of-america/ The CAP report attempted to quantify the sparsity of school districts, which it measured as the share of districts with four or fewer schools. An important limitation of this measure is that it does not take into account the wide variation in the geographic size of districts (e.g., a small district could be classified as sparse even if it has many schools per square mile and a large district could be classified as dense even if it has very few schools per square miles). As a result, analyses based on this measure may be misleading.
5. We analyze data from the School Attendance Boundaries Survey (SABS) from the National Center on Educational Statistics (NCES) and estimate that about 70 percent of U.S. families live within a school attendance boundary documented by the SABS. Of those families, 78 percent have a single public school within their attendance zone.
7. http://www.urban.org/research/publication/student-transportation-and-educational-access
8. https://www.mathematica-mpr.com/our-publications-and-findings/publications/market-signals-how-do-dc-parents-rank-schools-and-what-does-it-mean-for-policy
9. https://nces.ed.gov/surveys/pss/pssdata.asp
10. https://storymaps.geo.census.gov/arcgis/apps/MapSeries/index.html?appid=9e459da9327b4c7e9a1248cb65ad942a Minnesota Population Center. National Historical Geographic Information System: Version 11.0 [Database]. Minneapolis: University of Minnesota. 2016. http://doi.org/10.18128/D050.V11.0.