For the past fifteen years, a set of large urban districts have agreed to participate in what’s still called the “Trial Urban District Assessment,” or TUDA, as part of the National Assessment of Educational Progress. New TUDA scores will come out next month, just as they will for the nation and the states.
To help us prepare, Fordham’s research interns and I dug into NAEP data to see which district-level trends are worth watching. As I’ve argued before, we don’t want to over-interpret short-term changes, so it’s better to look at trends that span four years or more, i.e., trends that are based on at least three test iterations. Here’s a look, then, at statistically significant changes from 2011–15 for every participating district.
Cells that are empty indicate that there were no statistically significant changes, and the numbers represent statistically significant scale score changes from 2011 to 2015. Since districts, rather than cities, volunteer to participate in TUDA, most data only include students enrolled in traditional public schools. However, results for Atlanta, Baltimore, and Chicago include charter students in both years, and Los Angeles and Miami-Dade include charter students in 2015.
Table 1: Statistically significant changes on NAEP, 2011–15
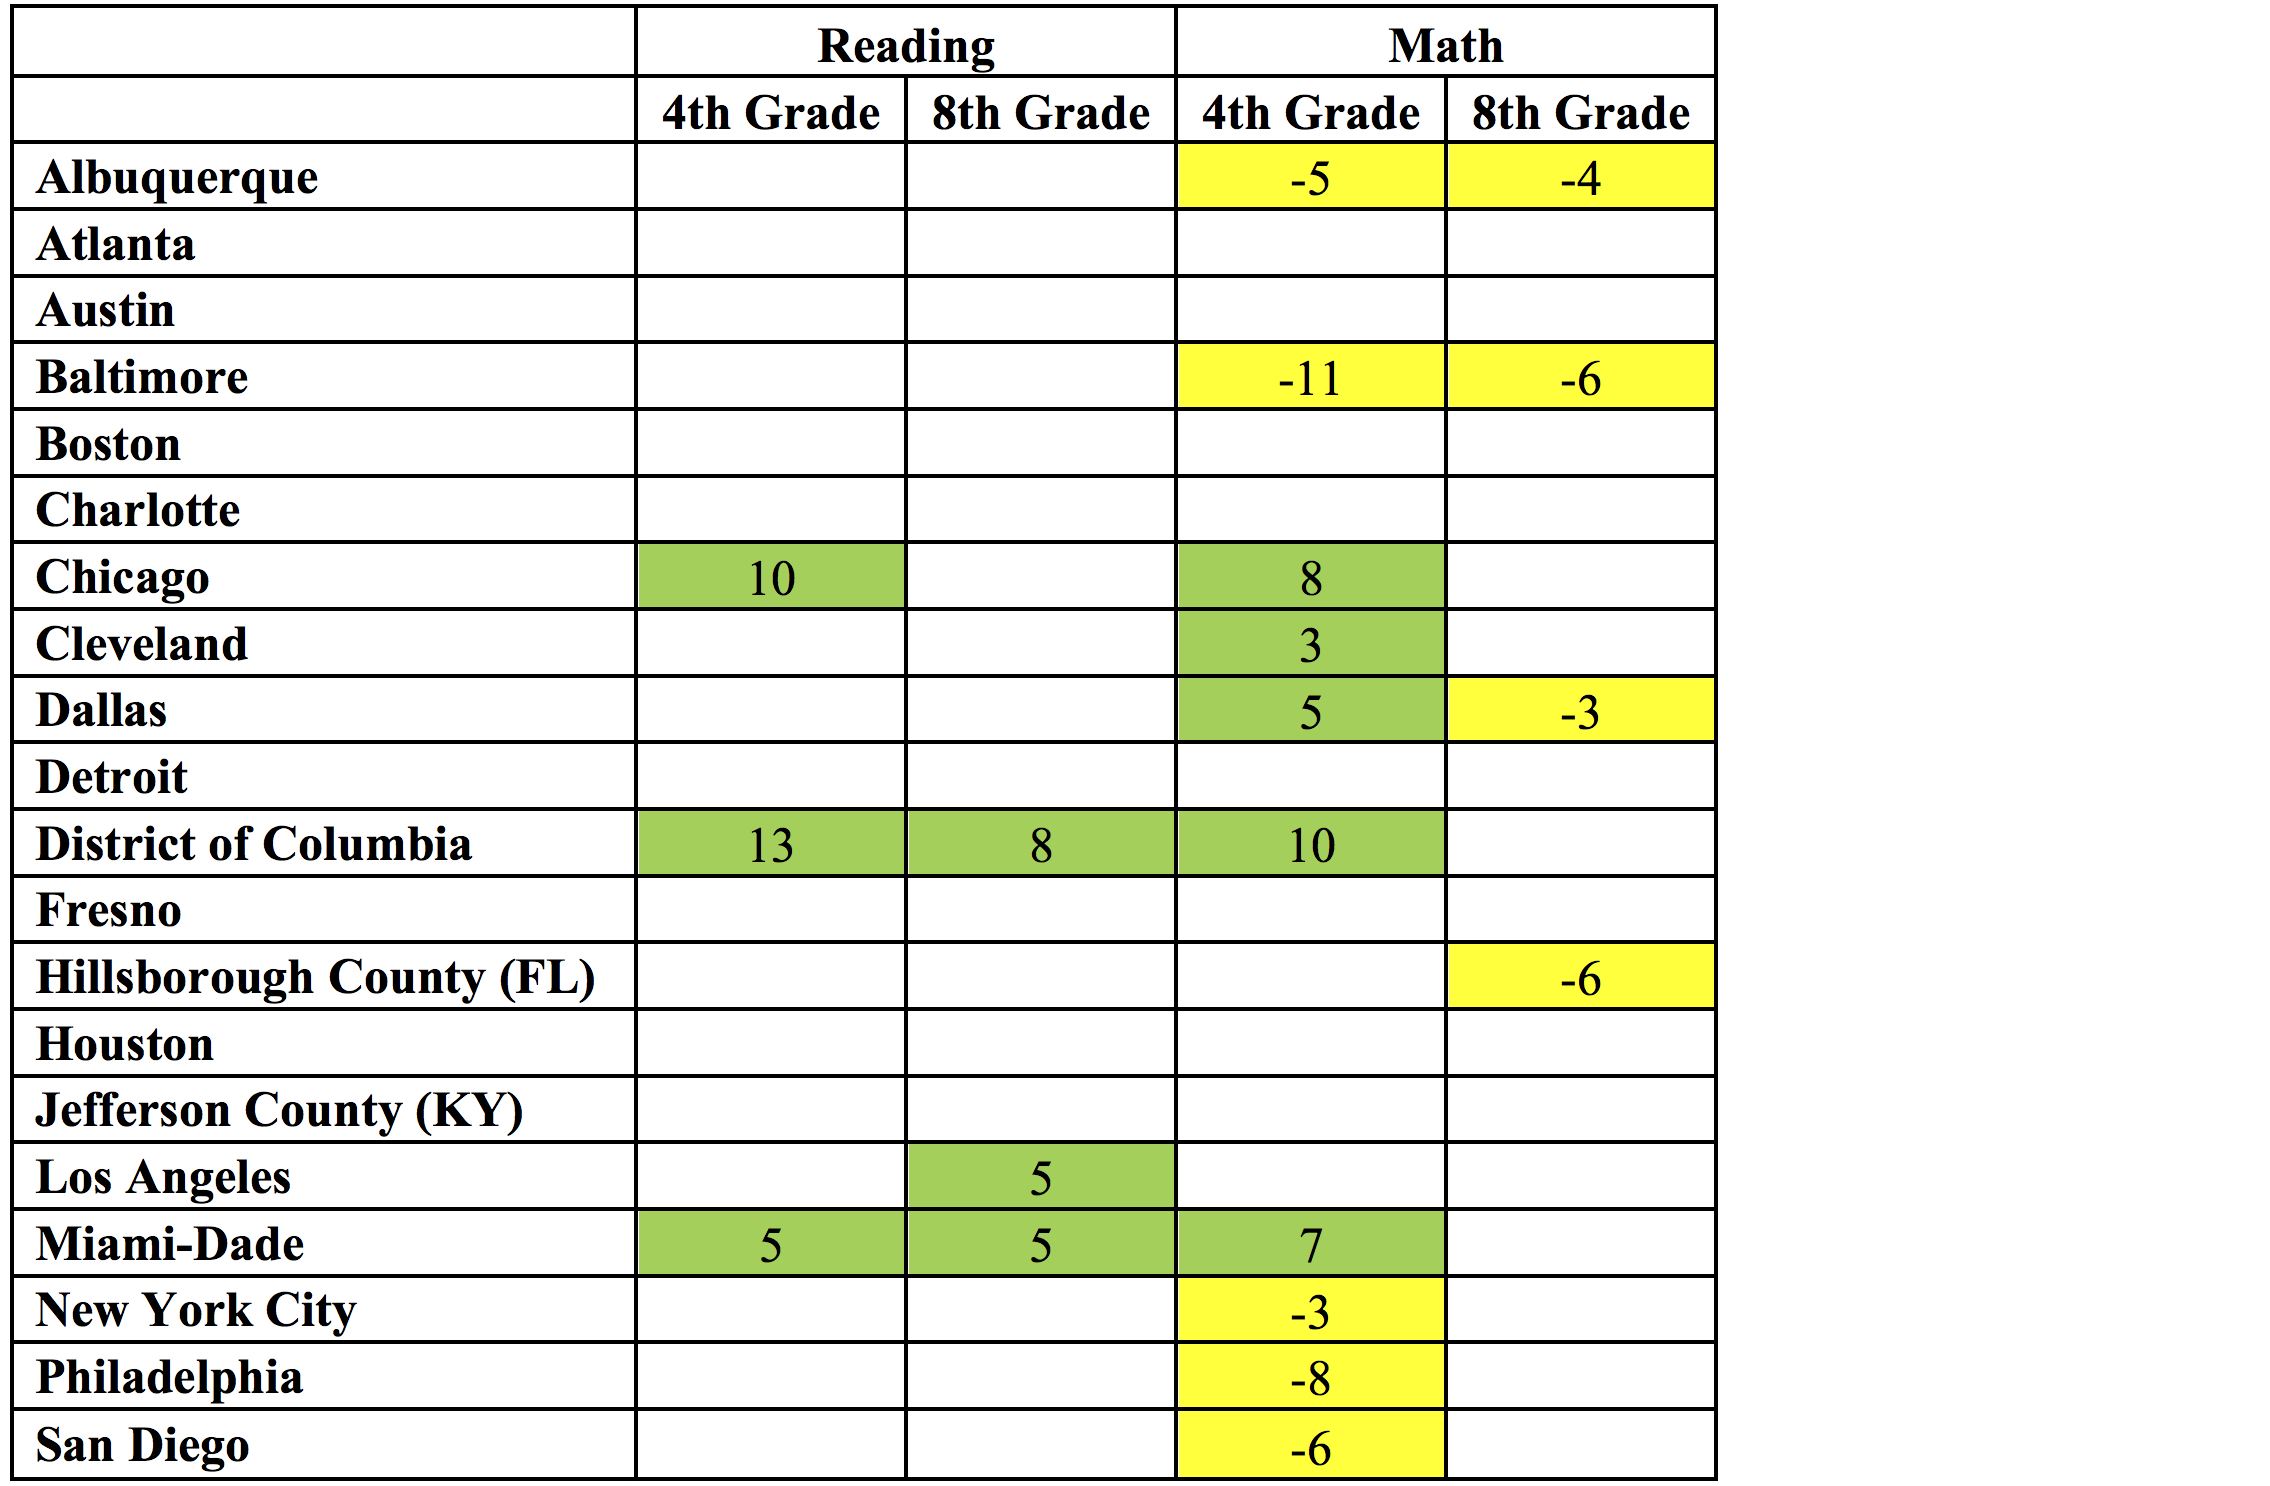
As was the case with the state-by-state trends, the urban trends in reading generally look more positive than those in math. Four cities saw statistically significant improvements in reading in at least one grade level (D.C. and Miami saw them in both; Chicago and Los Angeles in one grade each), and no city went backwards. In math the picture is more mixed, with four cities showing progress in one grade (Chicago, Cleveland, D.C., and Miami), but six cities seeing declines (Albuquerque and Baltimore saw them in both grade levels; Hillsborough County, New York, Philadelphia, and San Diego in one grade each); in one city, Dallas, it was mixed.
It’s clear why Miami’s Alberto Carvalho is a hot property, with his gains in three of the four categories. Chicago’s fourth graders saw a big jump. And as we’ve discussed before, the District of Columbia continues to make remarkable progress.
As for the laggards, Baltimore’s scores are probably down because Maryland is no longer excluding so many students with disabilities from NAEP. But I can’t begin to explain Albuquerque. Maybe Hanna Skandera can.
As with national and state data, we should be mindful that demographic changes can affect achievement trends. So if we want to understand which policies and practices might be helping or hurting, we need to find a way to deal with these demographic trends. Our approach is to analyze results for each of three major racial groups, in addition to the overall student population. So let’s take a look at that, first for reading and then for math.
Table 2: Statistically significant changes in reading scale scores, 2011–15
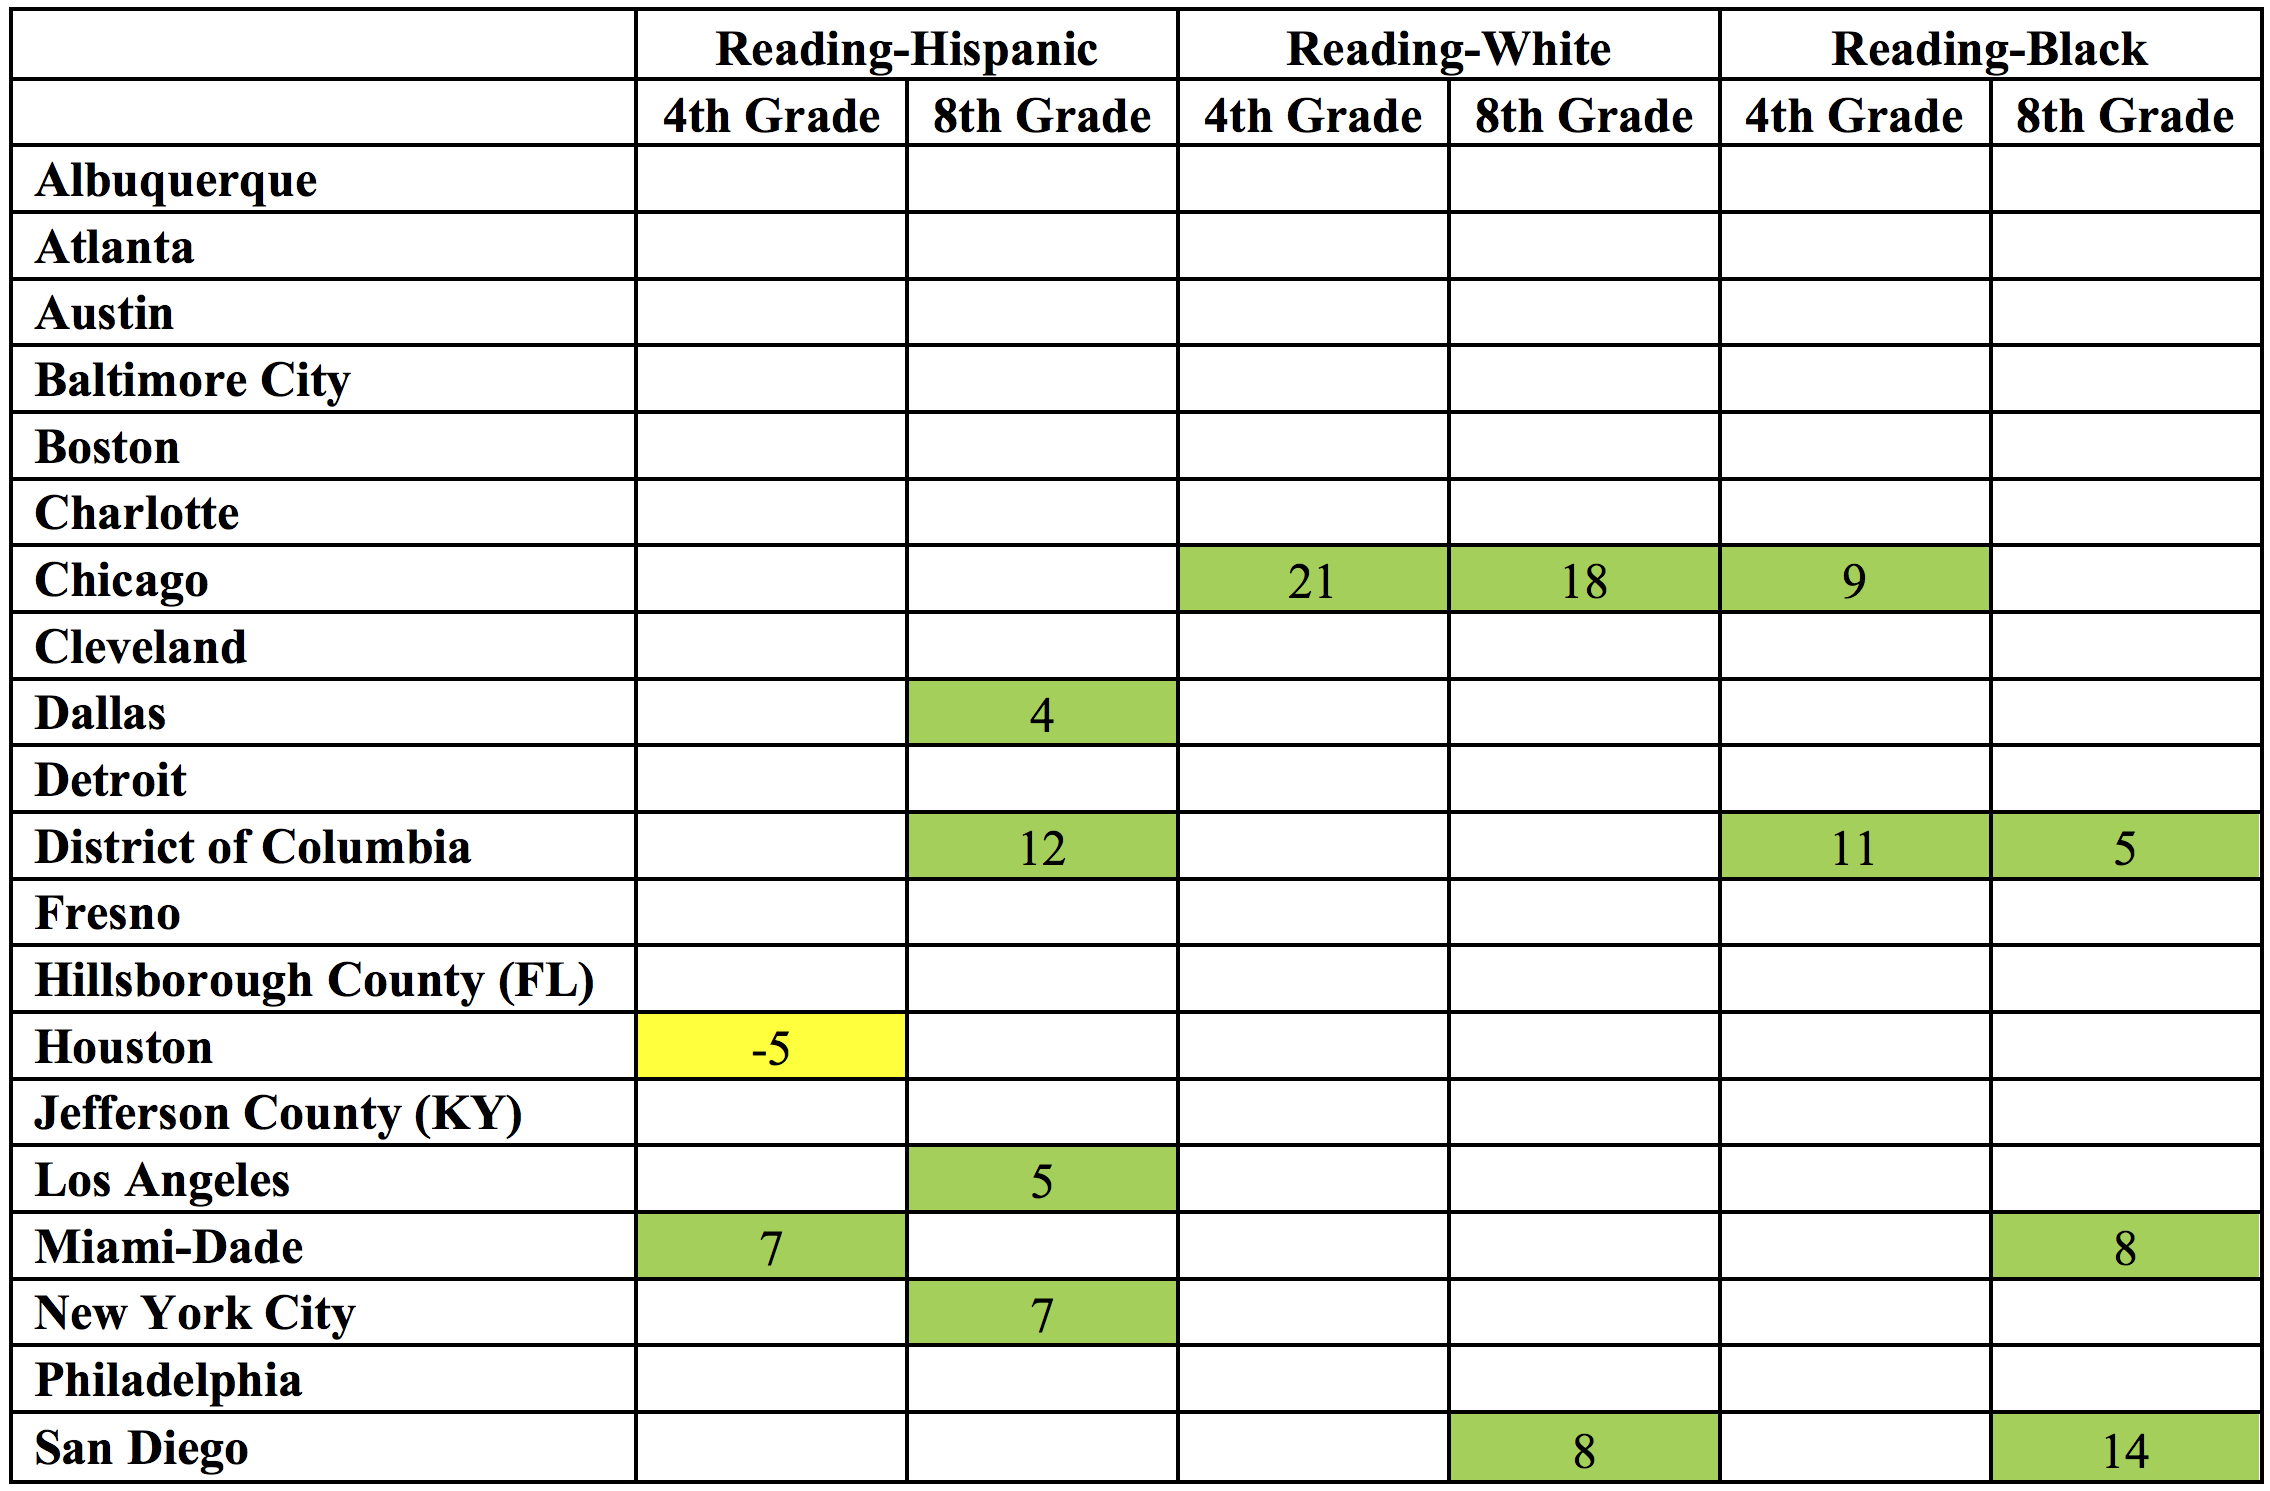
This approach allows a few more districts to enter the winner’s circle, namely Dallas, New York City, and San Diego. The first two saw improvements for their Hispanic students; the latter made gains for its white and black students. We can also see which racial groups were driving improvements overall. In Chicago, it was white and black students (but not Hispanics). In D.C. and Miami it was Hispanic and black students (but not whites). And in L.A. it was just Hispanic students.
Houston saw the only decline—in fourth grade reading for its Hispanic students.
Now let’s look at math.
Table 3: Statistically significant changes in math scale scores, 2011–15
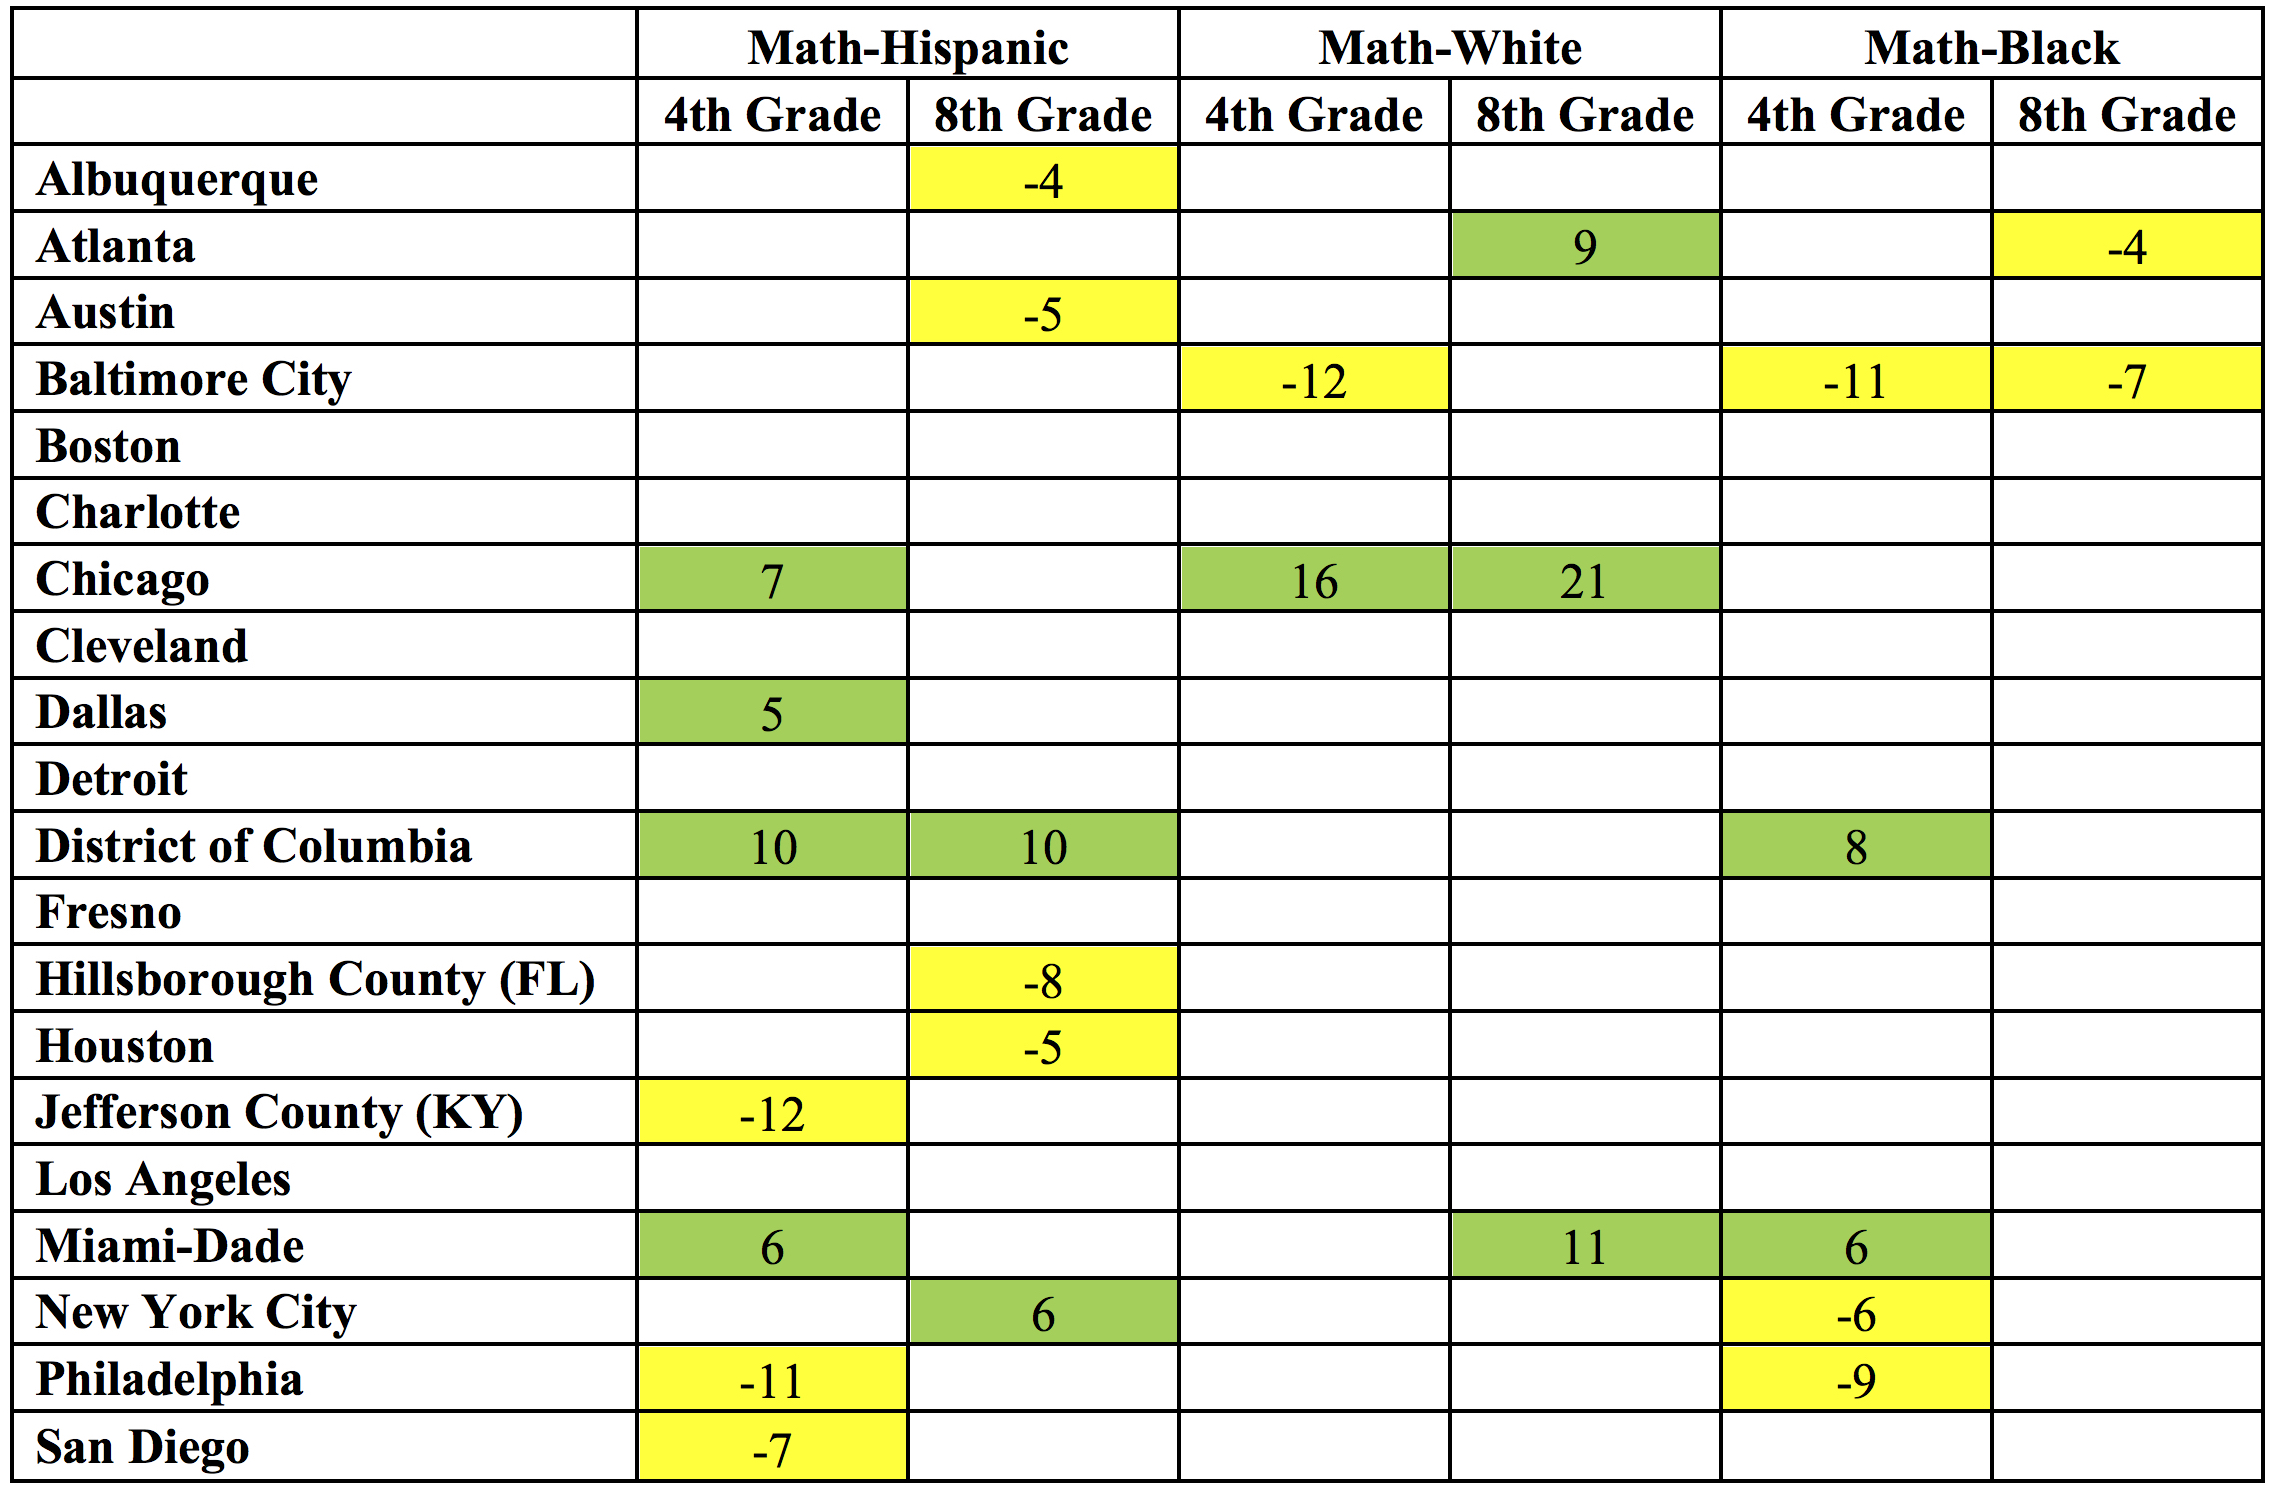
In this case, disaggregating by race allows us to identify some additional laggards: Austin, Houston, and Jefferson County, all of which saw statistically significant declines for their Hispanic students. On the flip side, Atlanta and New York City each posted gains for at least one subgroup—white students in the case of the Atlanta and Hispanic students in the case of New York.
There are a few other interesting findings to note. First let’s examine Chicago. Its white students made significant gains in both fourth and eighth grades; perhaps gentrification is a possible explanation. On the other hand, the District of Columbia, often seen as the capital of gentrification, didn’t post any statistically significant progress for its white students. (Of course, D.C. has so few white students that they would have to make enormous gains in order for it to register statistically.) Then there’s Miami-Dade, which pulled off the hat trick of posting improvements across all three major racial groups. Impressive!
One more wonky comment: Chicago has received a ton of attention for significantly outpacing other urban districts, as reported by the New York Times. That was based on an analysis of its NAEP results by Sean Reardon, who subtracted its 2013 eighth grade scores from its 2009 fourth grade scores—thus tracking the same cohort of students over time. But note what happened in 2015: Its fourth grade scores went way up. That’s going to make it a lot harder for its “cohort gains” to look as impressive going forward.
* * *
Just as Indiana and Tennessee are the states with momentum going into the 2017 NAEP release, Chicago, D.C., and Miami are the districts to watch and learn from. Anyone up for a “research trip” to South Beach? We’d better go soon, in case April 10 brings disappointing news.
— Mike Petrilli
Mike Petrilli is president of the Thomas B. Fordham Institute, research fellow at Stanford University’s Hoover Institution, and executive editor of Education Next.
This post is the fourth in a series of commentaries leading up to the release of new NAEP results on April 10. The first post discussed the value of the NAEP; the second looked at recent national trends; and the third examined state-by-state trends.
This post originally appeared in Flypaper.