In an effort to make public organizations more efficient, governments round the world make use of hard performance targets, such as student test scores for public schools and patient waiting times for health-care systems. Accountability based on objective performance measures has the benefit of being transparent. One potential drawback is that such schemes may lead to gaming behavior in a setting where the available performance measures focus on just one dimension of a multifaceted outcome.
 Subjective performance evaluation holds the promise of measuring what matters. When evaluators are allowed to exercise their own judgment, rather than following a formal decision rule, however, the subjective measure may be corrupted by such behaviors as favoritism. One type of subjective evaluation, onsite inspection, is nonetheless used in many school systems around the world. In-class evaluations by external assessors have been proposed recently in the United States for the K–12 sector, as well as for the Head Start preschool program. Yet there is very little evidence to date on the validity of inspection ratings and the effectiveness of inspection-based accountability systems in improving school quality.
This study evaluates a subjective performance-evaluation regime in place in the English public school system since the early 1990s. Under this regime, independent inspectors visit schools, assess schools’ performance, and disclose their findings on the Internet. Inspectors combine hard metrics, such as test scores, with softer ones, such as observations of classroom teaching, in order to arrive at an overall judgment of school quality. Schools that receive a fail rating may be subject to sanctions, such as more frequent and intensive inspections.
I provide evidence on the effectiveness of several aspects of the inspections system. First, I demonstrate that inspection ratings can aid in distinguishing between more- and less-effective schools, even after controlling for test scores and various other school characteristics. Second, exploiting a natural experiment, I show that a fail inspection rating leads to test-score gains for primary school students that remain evident even after the students move into secondary schools. I find no evidence that schools that receive a fail rating are able to inflate test-score performance by gaming the system, suggesting that oversight by inspectors may mitigate such strategic behavior.
The English School Inspection System
The English public schooling system combines centralized testing with school inspections. Over the period relevant to this study, tests took place when students were age 7, 11, 14, and 16; these are known as the Key Stage l to Key Stage 4 tests, respectively. Successive governments have used the results of Key Stage tests, especially Key Stages 2 and 4, as performance measures when holding schools to account.

Since the early 1990s, a government agency called the Office for Standards in Education, or Ofsted, has inspected all English public schools. Ofsted has three primary functions: 1) to offer feedback to the school principal and teachers; 2) to provide information to parents to aid their decisionmaking process; and 3) to identify schools that suffer from “serious weakness.” Although Ofsted employs its own in-house team of inspectors, the agency contracts out the majority of inspections to a handful of private-sector and nonprofit organizations via a competitive bidding process. Ofsted retains responsibility for setting overall strategic goals and objectives, putting in place a framework to guide the inspection process, and monitoring the quality of inspections.
Over the time period covered by this study, schools were generally inspected once during each three- to six-year inspection cycle. An inspection involves an assessment of a school’s performance on academic and other measured outcomes, followed by an onsite visit to the school, typically lasting one or two days for primary schools. Inspectors arrive at the school on very short notice (maximum of two to three days), which should limit schools’ ability to make last-minute preparations for the visit. Inspections take place throughout the academic year, September to July.
During the onsite visit, inspectors collect qualitative evidence on performance and practices at the school. A key element of this is classroom observation. In addition, inspectors hold in-depth interviews with the school leadership, examine students’ work, and engage in discussions with students and parents. The evidence gathered by the inspectors during their visit, as well as test-performance data, form the evidence base for each school’s inspection report. The school receives an explicit headline grade, ranging between l (“Outstanding”) and 4 (“Unsatisfactory,” also known as a fail rating). The full inspection report is made available to students and parents and is posted on the Internet.
There are two categories of fail, a moderate fail (known as “Notice to Improve”) and a more severe fail (“Special Measures”), which carry different sanctions. Schools that receive a moderate fail rating are subject to additional inspections, with an implicit threat of a downgrade to the severe fail category if inspectors judge improvements to be inadequate. Schools that receive the severe fail rating may experience more dramatic consequences: these can include changes in the school leadership team and the school’s governing board, increased resources, as well as increased oversight from the inspectors.
Over the period, September 2006 to July 2009, 13 percent of schools received the best rating, “Outstanding”; 48 percent received a “Good” rating; 33 percent received a “Satisfactory” rating; and 6 percent received a “Fail” rating. The fail group included 4.5 percent of schools receiving the moderate fail rating and 1.5 percent of schools receiving the severe fail rating.
Official policy statements indicate that inspectors place substantial weight on test scores, which is borne out by analysis of the data. A decline of 10 national percentile points on a school’s test performance in the year before inspection is associated with a 3 percentage point rise in the likelihood of being rated fail, taking into account the proportion of students eligible for free lunch, as well as the local authority in which the school is located. Nevertheless, test scores are not the only measure inspectors use to rate schools. Around 25 percent of schools that had scored in the bottom quarter nationally on the test were rated Outstanding or Good during the 2006 to 2009 period.
Validating Inspection Ratings
I first investigate whether inspection ratings convey any information on school quality beyond what is captured by test-score rankings. The critical question is whether inspectors visiting the school are able to gather and summarize information about school quality that is not already publicly available. If inspectors rely mostly or exclusively on test scores to arrive at the overall rating, then these ratings will not provide new information to educators, parents, and policymakers.
I test the validity of the inspection ratings by examining to what extent these ratings can forecast measures of school quality not observed by the inspectors, after taking into account the measures they do observe. I construct two measures of school quality—student perceptions of teacher practices and parent satisfaction—using data from the Longitudinal Study of Young People in England (LSYPE), a major survey supported by the Department for Education. Students age 14 are asked how likely teachers are to: take action when a student breaks rules, make students work to their full capacity, keep order in class, assign homework, check that any homework that is assigned is done, and grade students’ work. Parents are asked about their satisfaction with the interest teachers show in the child, school discipline, child’s school progress, and feedback from teachers.
I combine the student questions into a single measure of student perceptions of teacher practices and the parent questions into a single measure of parent satisfaction. I then examine whether these survey measures, which are not observed by the inspectors, are higher in schools that received better inspection ratings, controlling for various characteristics of the schools and survey respondents. For this analysis, school characteristics taken into account include national percentile test rank, the proportion of students eligible for a free lunch, whether the school is secular or religious, and the local education authority in which it is located. Student factors include prior test score, gender, ethnic background, parents’ education, income and economic activity, and whether the family receives government benefits.
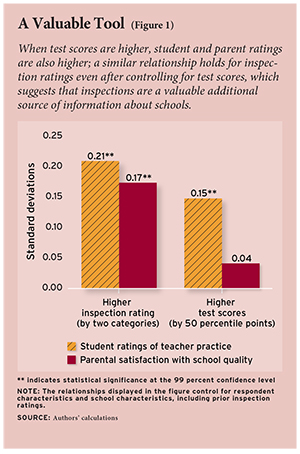
My results confirm that lower inspection ratings are associated with sharply declining school quality as measured by student perceptions of teacher practices. The strength of this relationship may be gauged by comparing the change in quality associated with changes in the school’s position in the national test-score ranking: the results show that an increase of 50 percentile points is associated with an increase of 0.15 standard deviations in student perceptions of teacher practices (see Figure 1). A two-unit improvement in the inspection rating, such as from Satisfactory to Outstanding, is associated with an even larger increase of 0.21 standard deviations.
Results for the parent satisfaction measure are very similar to those reported for the teacher practices measure. A two-unit increase in the inspection rating is associated with an increase of 0.17 standard deviations in the parent satisfaction measure. The relationship between test scores and parental satisfaction, however, is statistically insignificant after controlling for inspection ratings. In short, this analysis confirms that inspection ratings can help detect differences in teacher practice and parental satisfaction among schools with similar test-score rankings and socioeconomic composition.
The Effect of a Fail Inspection on Test Scores
What is the effect of a fail inspection on students’ subsequent test scores? The challenge to answering this question is that receiving a fail rating is based at least partly on past test performance. Schools that have a bad year on the standardized test are more likely to receive a fail rating when they are next inspected. If the low score is due in part to bad luck, the score is likely to increase the next year, toward the school’s typical performance. Thus, schools that receive fail ratings may appear to improve in the following year for reasons other than the fail rating.
I address this concern by comparing schools inspected early in the year to those inspected late in the year. This analysis exploits a specific feature of the English testing system, namely, that the age-11 tests take place each year over five days in the second week of May. The results are released in mid-July. Schools that are inspected and receive a fail rating early in the academic year can respond to that rating and potentially improve their scores by the time of the May test. But schools that are failed later in the year—in particular, those that are failed after mid-May—cannot. I therefore estimate the effect of receiving a fail rating by comparing the May test results for schools inspected very early in the same academic year, the treatment group, with a comparison group of schools inspected after the test is taken in early May but before the results are released in July. The key idea is that inspectors have the same information on past test scores for both groups of schools.
I conduct this analysis using mathematics and English test scores for schools failed in one of the four academic years, 2005–06 to 2008–09. The key comparison is between students enrolled in schools that received a fail rating in the early part of the academic year, September to November (the treatment group) with those attending schools that received a fail rating late in the academic year, mid-May to mid-July (the control group). It is important to bear in mind that this methodology does not compare the effect of attending a school that received a fail rating with the effect of attending a school that received a higher rating.
The validity of this approach is supported by the fact that the treatment and comparison groups in general have very similar student and school characteristics. The proportion of students receiving a free school lunch, the proportion of students who are white British, student performance on the age-11 test in the prior year, and the school’s inspection rating from the previous inspection round are all similar, on average, in the treatment and control schools.
The results indicate that the effect of receiving a fail rating is to raise standardized test scores in a school by 0.12 standard deviations in math and by 0.07 to 0.09 standard deviations in English. These gains, which roughly equate to between one-third and one-half a year of typical instruction, are especially noteworthy given that they can only reflect the efforts of schools made between an inspection in the period from September to November and the tests administered in May, a maximum of eight months.
Testing for Strategic Behavior
An outstanding question is whether these improvements reflect strategic behavior by schools that face strong incentives to improve their test scores. These strategies could include the removal of low-performing students from the testing pool, teaching to the test, and targeting students close to the mandated proficiency threshold. I conduct three tests for the presence of these types of strategic responses.
First, I examine to what extent gains in test scores following the fail rating are accounted for by selectively removing low-performing students. Specifically, I examine whether the results change when I adjust my results to account for differences in student characteristics, including prior (age 7) test scores; gender; eligibility for free lunch; special education needs; month of birth; whether first language is English; ethnic background; and census information on the home neighborhood deprivation index. I find that controlling for these factors in the analysis has little impact on the estimated effect of receiving a fail rating. In other words, it doesn’t appear that schools try to game the system by systematically discouraging certain groups of students from taking the exam.
Second, I investigate whether there is any evidence that teachers target students on the margin of attaining “Level 4” proficiency; the percentage of students attaining that proficiency level is the key government target for age-11 students. Following a fail rating, the incentives to maximize students passing over the threshold are more intense than prior to the fail rating. Schools may therefore try to target resources toward students on the margin of attaining this threshold, to the detriment of students far below and far above.
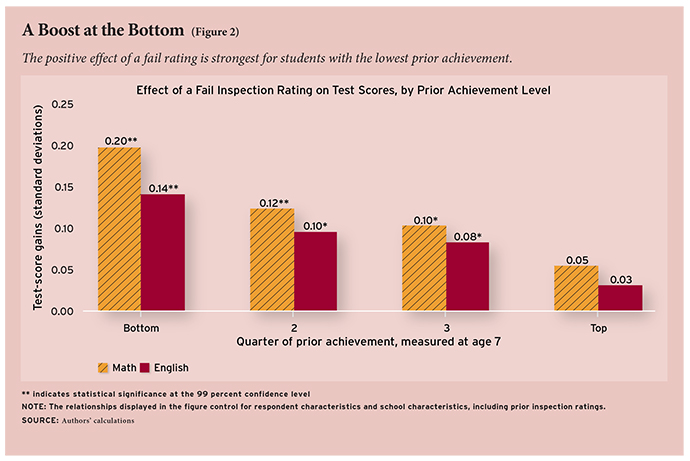
I address this issue by examining whether the fail rating effect varies by students’ prior ability and find a strong inverse relationship between prior ability and the effects of attending a school that received a fail rating. The fail rating effect for students with test scores in the bottom quarter prior to the treatment year is 0.20 and 0.14 standard deviations in mathematics and English, respectively (see Figure 2). Students in the middle of the prior test-score distribution also experience substantial gains of roughly 0.10 to 0.12 standard deviations in math and 0.08 to 0.10 standard deviations in English. The gains for students with prior scores in the top quarter are the smallest, at 0.05 and 0.03 standard deviations in mathematics and English, respectively.
Why are the effects of a fail rating largest for students with low prior test scores? One potential explanation relates to differences within the schools in the degree to which parents are able to hold teachers accountable. Parents of children scoring low on the age-7 test are poorer than average and may be less able to assess their child’s progress and the quality of instruction provided by the school. Teachers may exert lower levels of effort for students whose parents are less vocal about quality of instruction. My results suggest that, following a fail rating and the subsequent increased oversight of schools, teachers increase their effort. This rise in effort may be greatest where previously there was the greatest slack.
Finally, I examine whether any gains in test scores in the year of the fail rating are sustained in the years following the inspection. This provides an indirect test of the extent of teaching to the test, as gains due to crude test-prep strategies are less likely to persist over time than gains produced by improved instruction. Specifically, I examine whether the effects on age-11 test scores can be detected when the students are tested again at age 14, three years after the students have left the primary school. This is a fairly stringent test of gaming behavior, because prior research has found evidence of “fade-out” of test-score gains even when there are no strong incentives to boost test scores artificially.
The results show that a fail rating raises average math and English test scores by 0.05 standard deviations three years after leaving the primary school. These medium-term gains are largest for lower-performing students, in line with earlier results showing large gains for these groups in the year of inspection.
Conclusion
How best to design incentives for public organizations such as schools is a fundamental public policy challenge. One solution, performance evaluation on the basis of test scores, is prevalent in many countries. This paper evaluates an alternative approach, school inspections, which may better capture the multifaceted nature of education production. A key concern under such a regime is that it is open to manipulation.
My first set of results demonstrates that inspector ratings are correlated with student- and parent-reported measures of school quality, even after controlling for test-score results and other school characteristics. In other words, inspectors are able to discriminate between more- and less-effective schools, and, significantly, report their findings even when the stakes are high. Simply disseminating inspection ratings and reports may therefore better inform consumers and other decisionmakers in the education sector.
My main finding is that receiving a fail inspection rating leads to test-score improvements of around 0.1 standard deviations. There is little evidence to suggest that schools are able to inflate test performance artificially by gaming the system. If inspectors are able to evaluate actual practices and instructional quality at the school, both before and after an inspection, then inspections may well have a mitigating effect on such unintended responses.
Finally, the data reveal that the fail rating effects are especially large for students with low prior test scores. The gains are large when compared to other possible policy interventions, such as the effects of attending a school with higher average achievement levels or enrolling in a charter school. These results are consistent with the view that children of low-income parents, arguably the least vocal in holding teachers accountable, benefit the most from inspections. Consequently, the findings of this study may be especially relevant in the current policy environment where, first, there is heightened concern about raising standards for this group of children and, second, these students are hard to reach using other policy levers.
Iftikhar Hussain is a lecturer in the Department of Economics at the University of Sussex.
This article appeared in the Summer 2013 issue of Education Next. Suggested citation format:
Hussain, I. (2013). The School Inspector Calls: Low ratings drive improvements for schools in England. Education Next, 13(3), 66-72.