
The National Assessment of Educational Progress recently released national science results for 2019, and the news disappointed again. The science results reinforced a previous trend in the data—lackluster overall results driven by a disturbing decline in the results for students with disabilities. All six of NAEP’s 4th and 8th grade exams show at least modestly positive trends for students without disabilities between 2009 and 2019. Recent trends among students with disabilities are not nearly so positive (see Figure 1).
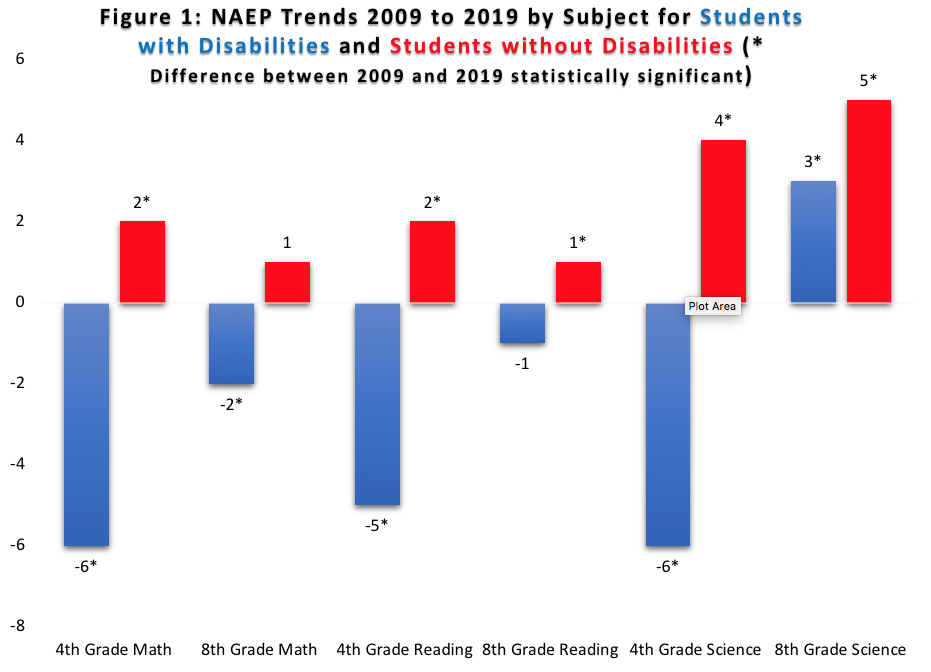
Notice the consistent pattern of modestly or significantly positive trends for students without disabilities. In three of the six exams (4th grade math, 4th grade reading, and 4th grade science), however, students with disabilities saw statistically significant declines, while their peers without disabilities saw significant improvement. Only 8th grade science defied the trend with increases for both groups between 2009 and 2019.
The scores reported for students with disabilities can be influenced by changes in the share of students who are excluded from NAEP testing altogether, as well as by any changes in the share of students with disabilities provided with testing accommodations. On the science exam, the level of special-needs exclusions remained flat between 2009 and 2019, while accommodation rates increased. If anything, these differences favor 2019 over 2009. The math and reading exams saw fewer exclusions and higher accommodation rates over this period, with an ambiguous net impact worthy of deeper investigation.
There is nothing inevitable about a decline in scores for students with disabilities. Contrary to commonly held stereotypes, a very large majority of students with disabilities do not have a condition that precludes academic progress. In providing additional federal and state funding for students with disabilities, we hope to equalize opportunity and overcome challenges.
We have clear historical examples of large surges in academic achievement for students with disabilities at the state level documented in the NAEP, with Florida serving as a prominent example. It is also worth bearing in mind that the Obama administration’s stimulus package passed early in 2009 (also the first year of the current NAEP science exams and thus the start of the period analyzed here) included a substantial increase in federal special education funding. As we will see below, there are examples of both high-spending states with large declines in achievement for students with disabilities, and relatively modestly spending states with large improvements.
Unlike the 2019 science tests, the NAEP math and reading tests produce state-level results. Figure 2 presents the trends for students with disabilities in 4th grade math and reading between 2009 and 2019 by state. On the math and reading exams, 10 points approximately equals an average grade level’s worth of progress, such that we would expect a group of 5th graders to score approximately 10 points higher than 4th graders. Smaller state samples mean that subgroup estimates have a larger margin of error than at the national level; the tables below indicate whether changes presented in the figure are statistically significant. Changes in exclusion and accommodation rates could also influence the results seen in specific states. Most of the observed effects are not small, however. Nor are they positive.
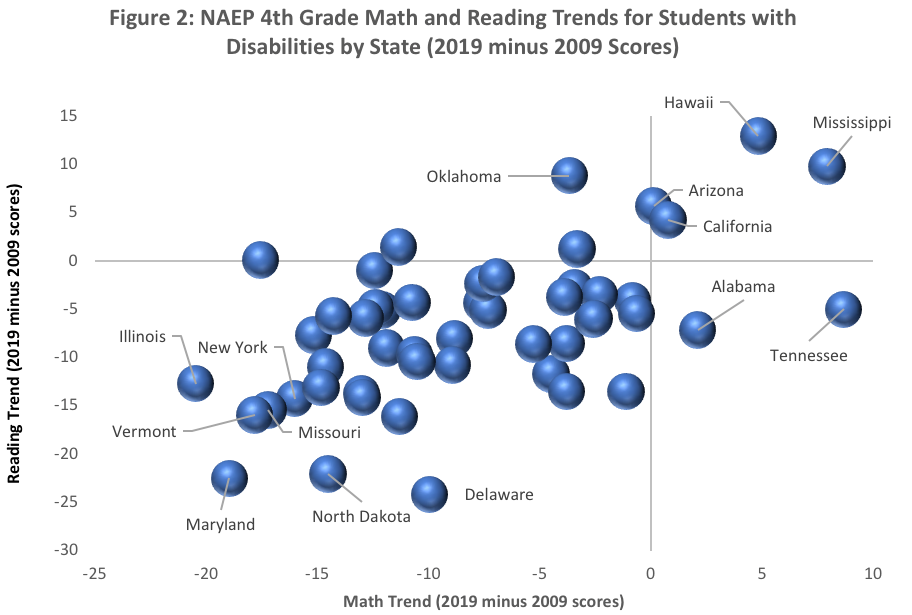
The 4th grade reading results for students with disabilities declined in many states. The five states with the highest levels of per-pupil spending (New York, Connecticut, New Jersey, Vermont, and Alaska) all saw large declines. No states registered statistically significant gains in 4th grade math or reading between 2009 and 2019 apart from Mississippi (increased in both subjects) and Hawaii (reading only) and Oklahoma (reading only). Table 1 lists the trends for 4th grade math and reading by state for students with disabilities.
| Table 1: NAEP 4th Grade Trends for Students with Disabilities by State (2019 minus 2009 Scores, *Statistically significant difference) |
||
| State | Math | Reading |
| Alabama | 2 | -7 |
| Alaska | -11* | -16* |
| Arizona | 0 | 6 |
| Arkansas | -12* | -1 |
| California | 1 | 4 |
| Colorado | -9* | -8 |
| Connecticut | -5 | -12* |
| Delaware | -10* | -24* |
| Florida | -1 | -4 |
| Georgia | -1 | -5 |
| Hawaii | 5 | 13* |
| Idaho | -8* | -4 |
| Illinois | -20* | -13* |
| Indiana | -4 | -14* |
| Iowa | -18* | 0 |
| Kansas | -16* | -14* |
| Kentucky | -13* | -14* |
| Louisiana | -3 | -3 |
| Maine | -12* | -9* |
| Maryland | -19* | -22* |
| Massachusetts | -15* | -8* |
| Michigan | -12* | -5 |
| Minnesota | -12* | -5 |
| Mississippi | 8* | 10* |
| Missouri | -17* | -15* |
| Montana | -11* | -10* |
| Nebraska | -4 | -9* |
| Nevada | -11 | 1 |
| New Hampshire | -15* | -11* |
| New Jersey | -9* | -11* |
| New Mexico | -11* | -4 |
| New York | -15* | -13* |
| North Carolina | -13* | -6 |
| North Dakota | -15* | -22* |
| Ohio | -7* | -5 |
| Oklahoma | -4 | 9* |
| Oregon | -8* | -2 |
| Pennsylvania | -3 | -6 |
| Rhode Island | -5 | -9* |
| South Carolina | -1 | -14* |
| South Dakota | -11* | -10* |
| Tennessee | 9* | -5 |
| Texas | -2 | -3 |
| Utah | -3 | 1 |
| Vermont | -18* | -16* |
| Virginia | -3 | -6 |
| Washington | -4 | -4 |
| West Virginia | -13* | -14* |
| Wisconsin | -14* | -6 |
| Wyoming | -7* | -2 |
State-level trends in math and reading for 8th graders during the same period also sound alarms (see Figure 3). The 8th grade results are perhaps more telling than the 4th grade results since students have had greater opportunity to receive special education services. Several of the worst performers on the 4th grade exams (Delaware, Maryland, North Dakota) also performed poorly on the 8th grade tests. Several states with private-school choice programs for students with disabilities (Arizona, Florida, Georgia, Louisiana, Mississippi, Oklahoma, and Utah) resisted the undertow of declining performance in the 8th grade scores.
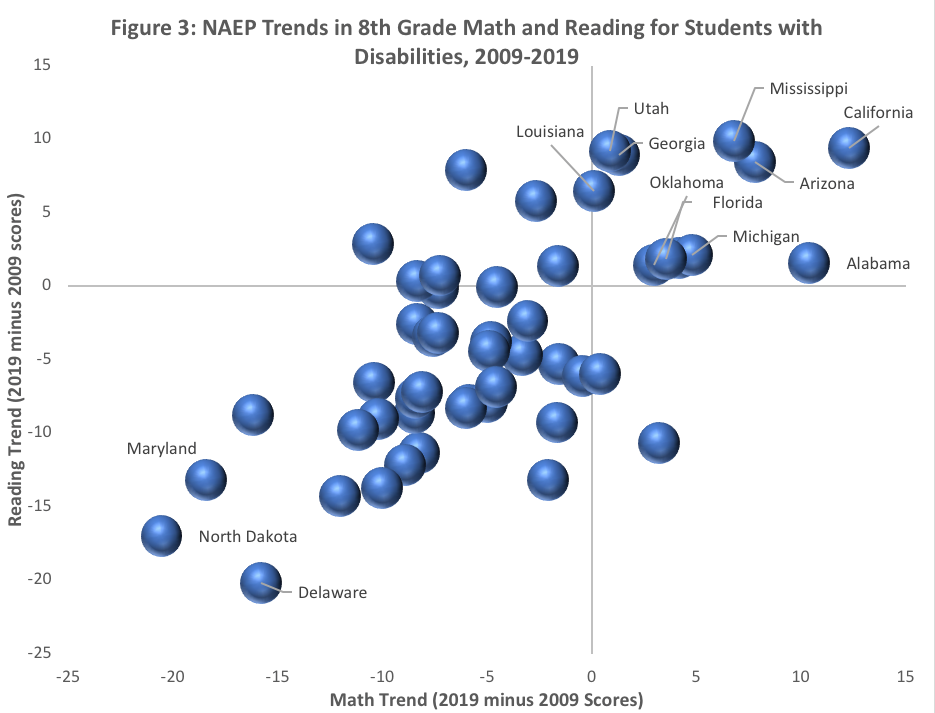
Table 2 presents the 8th grade math and reading trends by state.
| Table 2: NAEP 8th Grade Trends for Students with Disabilities by State (2019 minus 2009 Scores, *Statistically significant difference) |
||
| State | Math | Reading |
| Alabama | 10* | 2 |
| Alaska | -10* | -7 |
| Arizona | 8 | 8* |
| Arkansas | -3 | 6 |
| California | 12* | 9* |
| Colorado | -7 | 0 |
| Connecticut | -5 | 0 |
| Delaware | -16* | -20* |
| Florida | 4 | 2 |
| Georgia | 1 | 9* |
| Hawaii | -2 | -5 |
| Idaho | -6 | -8* |
| Illinois | -8* | -3 |
| Indiana | -3 | -5 |
| Iowa | 0 | -6 |
| Kansas | -12* | -14* |
| Kentucky | -8* | -11* |
| Louisiana | 0 | 6 |
| Maine | -8* | -9* |
| Maryland | -18* | -13* |
| Massachusetts | -10* | -9* |
| Michigan | 5 | 2 |
| Minnesota | -8* | -8 |
| Mississippi | 7 | 10* |
| Missouri | -11* | -10* |
| Montana | -2 | -9* |
| Nebraska | -3 | -2 |
| Nevada | -8* | 0 |
| New Hampshire | -8* | -7* |
| New Jersey | -2 | -13* |
| New Mexico | 0 | -6 |
| New York | -10* | 3 |
| North Carolina | -6 | 8 |
| North Dakota | -21* | -17* |
| Ohio | -5 | -4 |
| Oklahoma | 3 | 1 |
| Oregon | -5 | -8* |
| Pennsylvania | -6 | -8* |
| Rhode Island | -7* | 1 |
| South Carolina | -16* | -9** |
| South Dakota | -9* | -12 |
| Tennessee | 4 | 2 |
| Texas | -2 | 1 |
| Utah | 1 | 9* |
| Vermont | -10* | -14* |
| Virginia | 3 | -11* |
| Washington | -8* | -3 |
| West Virginia | -5 | -4 |
| Wisconsin | -7* | -3 |
| Wyoming | -5 | -7* |
States with multiple large declines in scores for children with disabilities should perform an investigation into the trends exploring both NAEP and other sources of data. Such an analysis might find evidence to suggest which testing factors (identification rates, inclusion rates, accommodation rates) and policies may have played a role. Pending such investigation, the country must confront the fact that many states had full-blown academic disasters unfolding for students with disabilities before the Covid-19 crisis. A year of shutdowns and impromptu distance learning seems likely to have made matters still worse. Covid-19 accelerated many trends such as online retail, streaming services, and interstate migration. Brace yourself, because it very well may have accelerated this horrible trend as well.
Matthew Ladner is the Executive Editor of RedefinED.