The Florida A-Plus program is a school accountability system with teeth. Each public school is assigned a grade based on the performance of its students on the Florida Comprehensive Assessment Test (FCAT) in reading, math, and writing. Reading and writing FCATs are administered in the 4th, 8th, and 10th grades; students take the math FCAT in the 5th, 8th, and 10th grades. The scale-score results from these tests are divided into five categories. The letter grade that each school receives is determined by the percentage of its students scoring above the thresholds established by these five categories or levels. If a school receives two F grades in a four-year period, its students are offered vouchers that they can use to attend a private school. They are also offered the opportunity to attend a better-performing public school.
The FCAT was first administered in the spring of 1998. So far, only two schools in the state, both located in Escambia County, have received two failing grades, the second coming during the 1999 round of testing in both cases. Students in both schools were offered vouchers, and nearly 50 students and their families chose to attend one of a handful of nearby private schools, most of which were religiously affiliated. No additional schools were subject to the voucher provision after the 2000 administration of the FCAT because none failed for a second time.
The theory undergirding this system is that schools in danger of failing will improve their academic performance to avoid the political embarrassment and potential loss in revenues from having their students depart with tuition vouchers. Whether the theory accords with the evidence is the issue addressed here. Perhaps the threat of vouchers being offered to students will provide the impetus for reform. But it is also plausible that schools will develop strategies for improving the grade they receive from the state without actually improving the academic performance of students. Perhaps schools will not have the resources or flexibility to adopt necessary reforms even if they have the incentives to do so. Perhaps the incentives of the accountability system interact with the incentives of school politics to produce unintended outcomes.
The evidence suggests that the theory holds true: that the A-Plus program has been successful at motivating failing schools to improve their academic performance. The gains, moreover, seem to reflect real improvement rather than a mere manipulation of the state’s testing and grading system.
The Literature
The question of whether testing and accountability systems are an effective reform tool has seldom been the subject of rigorous research. Most research attention has been devoted to evaluations of the accountability system in Texas. The Texas Assessment of Academic Skills (TAAS) has been in existence for a decade and is the most comprehensive of all state testing systems. Students in Texas are tested in 3rd through 8th grades in math and reading. In addition, students must pass an exit exam first offered in 10th grade in order to graduate. The state is also phasing in requirements that students pass exams in order to be promoted to the next grade.
The comprehensive nature of Texas’s accountability system and the fact that its governor was a candidate for the presidency attracted considerable attention to the TAAS. The most systematic research on TAAS appeared in two somewhat contradictory reports issued by the RAND Corporation (for a critique of both reports, see Eric Hanushek’s “Deconstructing RAND” in the Spring 2001 issue, available on-line at www.educationnext.org). In the first report, released in July of 2000, David Grissmer and his colleagues analyzed scores from the National Assessment of Educational Progress (NAEP), a test administered by the U.S. Department of Education, in order to identify state policies that may contribute to higher academic performance. They found that states like Texas and North Carolina, with extensive accountability systems, were among the highest-scoring and fastest-improving states after demographic factors were controlled for. The report featured a lengthy comparison of student performance in California, which has an underdeveloped accountability system and weak academic performance, and Texas to highlight the importance of TAAS in improving academic achievement, as measured by NAEP.
The second report, released in October of 2000 by Stephen Klein and his colleagues, cast doubt on the validity of TAAS scores by suggesting that the results do not correlate with the test results of other standardized tests. Because the other standardized tests are “low-stakes tests,” without any reward or punishment attached to student or school performance, the authors reason that there are few incentives to manipulate the results or cheat, making the low-stakes test results a reliable measure of student performance (although it is also possible that schools and students won’t prepare enough for a low-stakes test to demonstrate their true abilities). By contrast, schools and students might have incentives and opportunities to manipulate the results of high-stakes tests, like TAAS. The dissonance between the different tests, the authors argue, should at least raise a red flag regarding the gains observed on TAAS. Klein and his colleagues also analyzed NAEP results in Texas, and, contrary to the findings of Grissmer and his colleagues, concluded that Texas’s performance on NAEP was not exceptionally strong.
Klein and his colleagues, however, cannot rule out alternative explanations for the weak correlation between TAAS results and the results of low-stakes standardized tests. It is possible that TAAS, which is based on the mandated Texas curriculum, tests different skills than those tested by the national standardized tests. Both could produce valid results and still be weakly correlated with one another if they are testing different things. It is also possible that the pool of standardized tests that were available to the RAND researchers were not representative of Texas as a whole. The standardized test results that were compared with TAAS results were only from 2,000 non-randomly selected 5th-grade students from one part of Texas. If this limited group of students were not representative of all Texas students, it would be inaccurate to draw any conclusions about TAAS as a whole.
Another examination of NAEP scores in Texas, which I conducted, showed that NAEP improvements were exceptionally strong in Texas while the TAAS accountability system was in place. The disparate findings regarding the relationship between Texas’s scores on TAAS and NAEP can be partially explained by differences in the time periods and grade levels examined, and by the presence or absence of controls for student demographics. For now it is enough to say that there is some ambiguity regarding any conclusions that can be drawn from a comparison of NAEP and TAAS results. This ambiguity is in part a result of the fact that NAEP is administered infrequently and only in certain grade levels.
A more recent collection of studies edited by Martin Carnoy of Stanford University and issued by the Economic Policy Institute finds that the accountability systems in Texas, North Carolina, and Florida (before the adoption of A-Plus) all motivated failing schools to produce significant gains. Unfortunately, none of the studies released by the Economic Policy Institute confirm the validity of the state testing results by comparing them to the results on national exams. It is possible that the critics of testing are right, that some or even all of the gains measured only by state tests are the product of teaching to the test, cheating, or other manipulations of the testing system. In addition, the pre-A-Plus Florida analysis reported by the Economic Policy Institute is plagued by several research design flaws. For example, the study compares results from schools that took several different standardized tests without making any effort to ensure that the results are comparable. And because only pass rates were available, the scale scores analyzed were estimated based on a series of assumptions.
The research presently available on the potential of vouchers to improve achievement in public schools is also less than conclusive. Recent studies by economist Caroline Minter Hoxby, as discussed in this issue, have attempted to address this question by examining the consequences of variation in the extent of choice currently available in the United States. They suggest that areas with more choice and competition experience better academic outcomes than areas with less choice and competition. While these results support the contention that vouchers would improve the quality of education for the entire education system, it remains to be seen whether even the prospect of competition can provoke a public school response.
Studying the A-Plus accountability and choice system in Florida therefore offers the possibility of some important contributions to the existing research literature. An evaluation of A-Plus can reveal whether the prospect of competition, in the form of vouchers offered to students at chronically failing schools, represents an effective incentive for improvement. Unlike other studies of accountability systems, the ability to validate the scores used in the A-Plus system by comparing them with performance on nationally normed exams offers the possibility of dispelling concerns about whether the observed gains are real or the products of teaching to the test, cheating, or manipulation of the testing system.
Validating the FCAT Results
The first section of the analysis addresses the question of whether Florida’s test is a valid test of students’ academic abilities. Given the concerns raised by the Klein study regarding the validity of the TAAS exams in Texas, I decided to use the same analytical technique as Klein: comparing results on the FCAT with results on low-stakes standardized tests given at around the same time and in the same grade.
During the spring of 2000, Florida schools administered both the FCAT and a version of the Stanford 9, which is a widely used and respected nationally normed standardized test. Performance on the FCAT determined a school’s grade from the state and therefore determined whether students would receive vouchers. Performance on the Stanford 9 carried no similar consequences, so schools and students had little reason to manipulate, cheat, or teach to the Stanford 9. If the results of the Stanford 9 are similar to the results of the FCAT, the FCAT is likely to be a valid measure of academic achievement. If the results are not similar, it is possible that the FCAT results are not a valid measure of student performance.
The results of this analysis suggest that the FCAT results are valid measures of student achievement. Schools with the highest scores on the FCAT also had the highest scores on the Stanford 9 tests that were administered around the same time in the spring of 2000. Likewise, schools with the lowest FCAT scores tended to have the lowest Stanford 9 scores. If the correlation were 1.00, the results from the FCAT and Stanford 9 test would be identical. As it turns out, the correlation coefficient was 0.86 between the 4th grade FCAT and Stanford 9 reading test results. In 8th grade the correlation between the high-stakes FCAT and low-stakes standardized reading test was 0.95. In 5th-grade math, the correlation coefficient was 0.90; in 8th-grade math, the correlation was 0.95; and in 10th-grade math, the correlation was 0.91. In other words, the results of the two tests are quite similar. (It was not possible to verify the validity of the FCAT writing test with this technique because no Stanford 9 writing test was administered.)
In the second RAND study of TAAS in Texas, Klein and his colleagues never found a correlation of more than 0.21 between the school-level results from TAAS and the school-level results from low-stakes standardized tests. In this analysis there was never a correlation between FCAT and the Stanford 9 below 0.86.
To exclude the possibility that teaching to the test, cheating, or manipulation occurred only among schools that were previously failing, I also examined the correlations between the FCAT and Stanford 9 results among this subset of schools. This revealed that even among previously failing schools the correlations between the two test results remain very high, ranging from 0.77 to 0.99. It appears as if the pressures placed on previously failing schools did not lead them to distort their test results.
The Prospect of Vouchers
Now that the validity of the FCAT as a measure of student performance has been established, the question of whether vouchers inspired improvement among Florida’s failing schools can be studied. The greatest improvements should be seen among schools that had already received one F grade from the state, since their students would become eligible for vouchers if they received a second F. To test this hypothesis, average FCAT scale-score improvements for schools were broken out by the grade they received the year before.
In fact, the incentives appear to operate as expected. Schools that had received F grades in 1999 experienced the largest gains on the FCAT between 1999 and 2000. The year-to-year changes in school-level FCAT results did not differ systematically according to whether the school had received a grade of A, B, or C from the state. Schools that had received D grades and were close to the failing grade that could precipitate vouchers’ being offered to their students, by contrast, appear to have achieved somewhat greater improvements than those achieved by the schools with higher state grades. Schools that received F grades in 1999 experienced increases in test scores that were more than twice as large as those experienced by schools with higher state-assigned grades.
On the FCAT reading test, which uses a scale with results between 100 and 500, schools that had received an A grade from the state in 1999 improved by an average of 2 points between 1999 and 2000 (see Figure 1). Schools that had received a B grade improved by 5 points. Those earning a C in 1999 increased by 5 points. By contrast, schools with a D grade in 1999 improved by 10 points. Schools with F grades in 1999 showed an average gain of 18 points, equal to 0.8 standard deviations. In other words, the lower the grade in 1999, the greater the improvement in 2000.
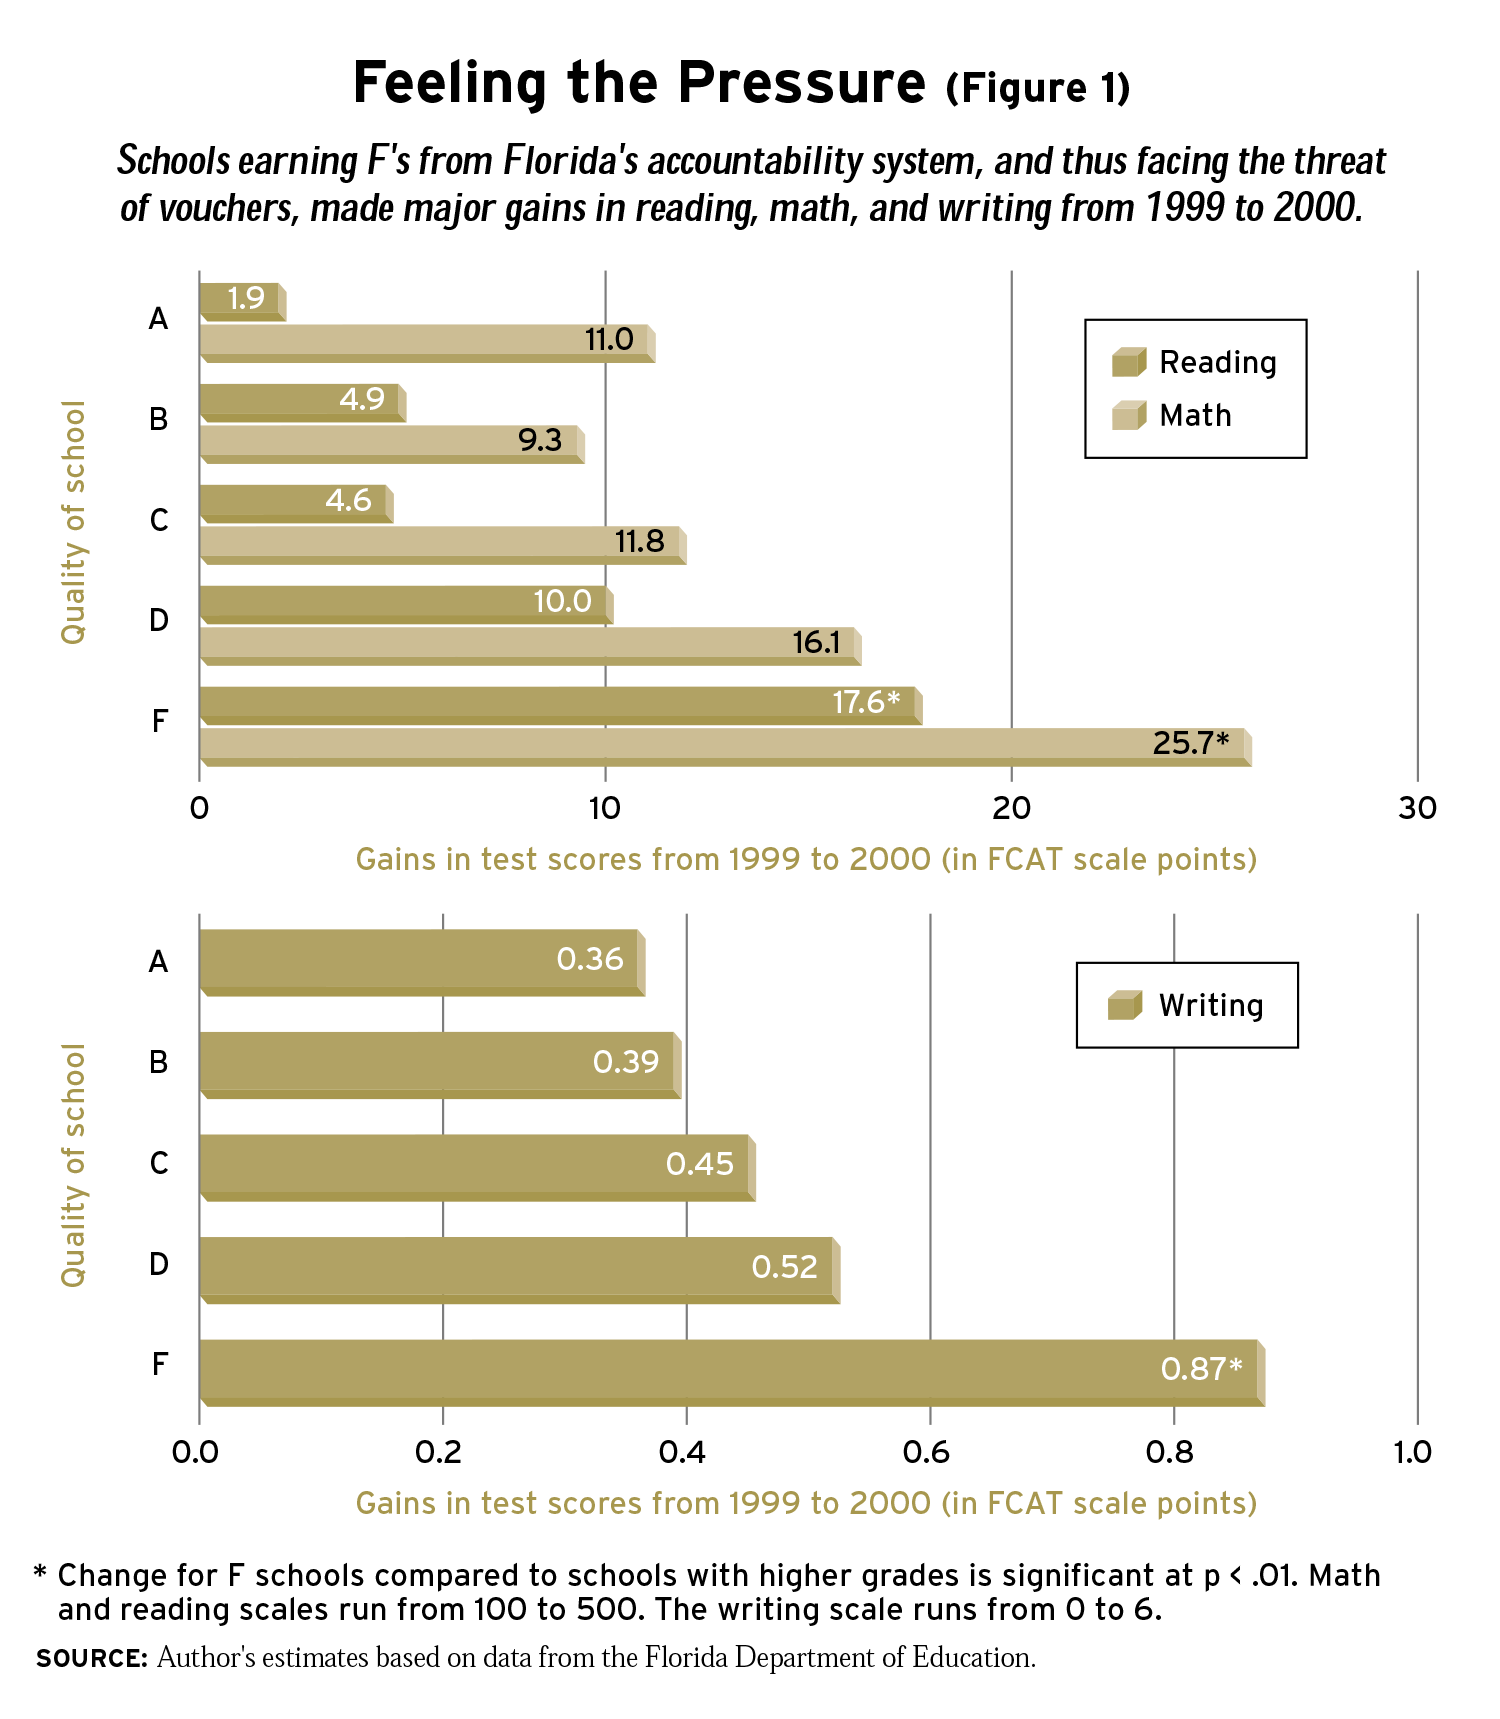
A similar pattern emerged in the FCAT math results. Schools earning an A grade experienced an average 11-point gain. Schools with a B gained 9 points. Schools with C grades in 1999 showed gains of 12 points, on average, between 1999 and 2000. Schools earning D grades improved by 16 points, while schools that received F grades in 1999 made gains of 26 points, equal to 1.25 standard deviations.
The FCAT writing exam, whose scores range from 0 to 6, also shows larger gains for schools earning an F grade in 1999. Schools with an A grade in 1999 improved by 0.4 points on the writing test; B schools had an average gain of 0.4 points; and C schools gained 0.5 points. D schools improved 0.5 points, while F schools demonstrated an average gain of .9 points, equal to an astounding 2.2 standard deviations.
Alternative Explanations?
The fact that gains among schools facing the prospect of vouchers were nearly twice as large as the gains achieved by other schools might be at least partially attributable to other factors. One possible factor is regression to the mean, the statistical tendency for very low or very high scores to move closer to the group average when retested. This common dynamic could account for at least some of the extraordinary gains realized by previously failing schools. It is also plausible that the extraordinary gains of failing schools were the result of their being provided with additional resources not available to other schools. And some observers have speculated that the exceptional gains observed in Florida could be explained by a change in rules regarding the test scores of high-mobility students who move in and out of schools and districts often.
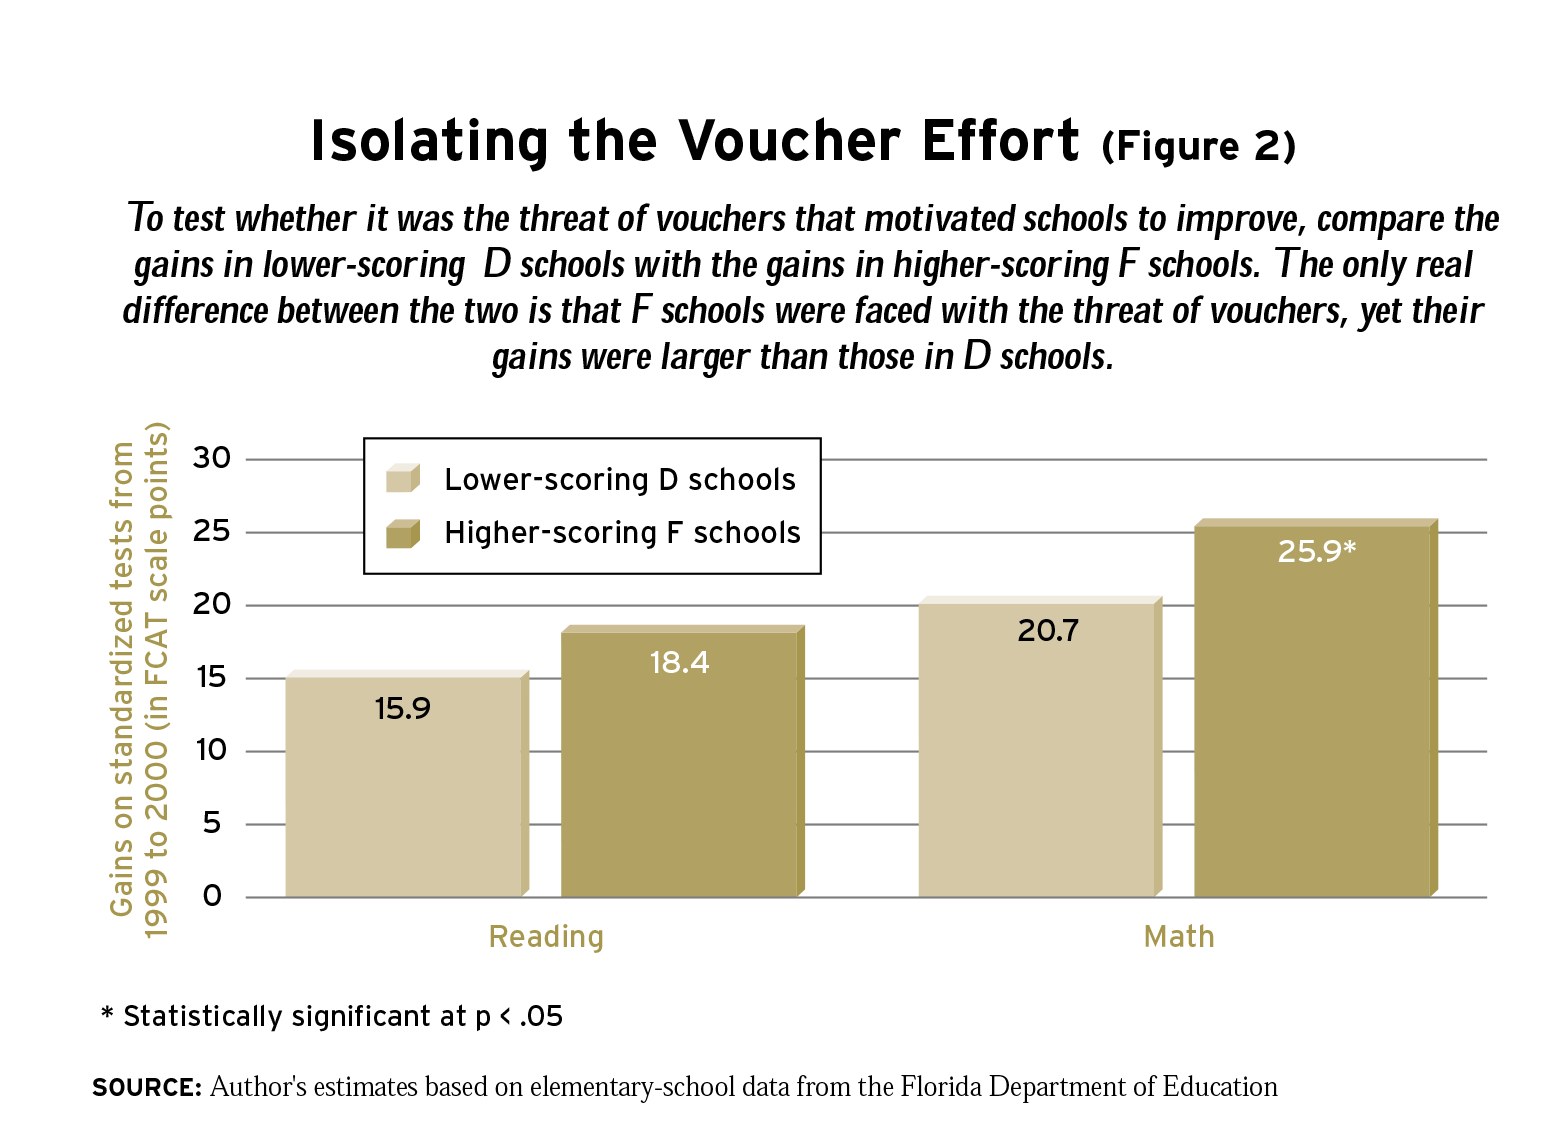
To test these alternative explanations I compared the improvements recorded by F-level schools that had above-average initial scores for their category with D-level schools that had below-average initial scores for their category. The intuition here is that high-scoring F schools and low-scoring D schools are very much alike initially, yet one group is subject to the accountability system’s punishments (the F label and the prospect of vouchers), while the other group of schools is not. In many ways this comparison approximates a randomized experiment. Because the two groups were so close to the threshold dividing D and F schools, chance may explain to a fair degree why these schools received one grade or the other. This is not to say that grading systems are inherently arbitrary; it is only recognizing the reality that luck is an important factor at the margins.
The initial similarity between the two groups of schools allows us to be confident that any difference in the gains realized by high-scoring F schools and low-scoring D schools is the result of the accountability system and not other factors. Regression to the mean cannot explain the gains of high-scoring F schools relative to low-scoring D-schools because both groups begin with similarly low scores. In fact, because the letter grade is based on the percentage of students scoring above certain thresholds and not on the average score in each school, the high-scoring F schools actually have slightly higher initial reading and math scores than do the low-scoring D schools. In addition, statistical techniques can control for the influence of differences in the background of students in each group or in the additional resources provided to each group.
Comparing the demographic characteristics of high-scoring F schools and low-scoring D schools confirms that the two groups are quite similar. They also do not differ significantly in their initial per-pupil spending, average class size, percentage of students receiving subsidized school lunches, percentage of students with limited English proficiency or disabilities, and the mobility of their student populations.
Note that the comparison between high-scoring F schools and low-scoring D schools is likely to underreport the true effect of labeling schools as failing and forcing them to face the prospect of vouchers. The comparison only measures the amount by which certain F schools outperform certain D schools, ignoring the possibility that D schools are also inspired to improve for fear of failing for the first time. Indeed, simply assigning grades to schools may inspire them to improve in order to get better grades. All schools face this incentive to some degree.
Nevertheless, high-scoring F schools did experience gains larger than their low-scoring D counterparts. After controlling for average class size, per-pupil spending in 1998-99, the percentage of students with disabilities, the percentage of students receiving a free or reduced- price school lunch, the percentage of students with limited English proficiency, and student mobility rates, high-scoring F schools achieved gains that were 2.5 points greater than their below-average D counterparts in reading (see Figure 2). The math results show that the prospect of vouchers inspired additional gains of 5.2 points. On the writing test, which has a scale of 1 to 6, the effect was 0.2 points, although, since the validity of the FCAT writing test cannot be confirmed, this finding is less definitive. Therefore, schools that received an F grade-and faced the prospect of vouchers should they receive another F-experienced gains superior to those made by schools at a similar level of performance but that did not face the threat of vouchers.
The larger gains made by schools facing the threat of vouchers cannot be explained by spending increases. While F schools did receive additional resources-about $600 per pupil in additional funding, compared with about $200 per pupil in D schools-taking this additional spending into account does not alter the extra gains achieved by schools that faced the prospect of vouchers. This is an especially important finding because the additional resources obtained by F schools may have been at least partially the result of the threat of vouchers. That is, school districts may have allocated more money to failing schools or failing schools may have been more aggressive in their grant writing precisely because they were taking action to avoid receiving a second F. The fact that including additional resources in the analysis does not diminish the magnitude of the motivational effect of vouchers suggests that the results are quite robust. Furthermore, the fact that controlling for the rate of student mobility does not have any effect on the results suggests that the exceptional gains achieved by F schools were not caused by a change in the rules concerning the treatment of high-mobility students.
Conclusion
To put the magnitude of the voucher effect into perspective, the same models can be used to calculate how much additional spending it would take to produce gains as large as those produced by labeling schools and threatening them with vouchers. According to the models comparing high-scoring F schools with low-scoring D schools, to achieve the same 5-point gain in math that the threat of vouchers accomplished, Florida schools would need to increase per-pupil spending by $3,484 at previously failing schools. This would be an increase of more than 60 percent in education spending. To realize the same gain as the A-Plus program accomplished in reading, Florida schools would need to spend $888 more per pupil, more than a 15 percent increase in per-pupil spending. To produce the same gain in writing scores, per-pupil spending would have to be increased by $2,805, more than a 50 percent increase.
For many years policymakers have focused on providing schools with enough resources to educate students. The evidence from the A-Plus accountability and choice program suggests that policymakers must also ensure that schools are provided with the appropriate incentives to use their resources effectively. Grading schools and using vouchers as a sanction for repeated failure inspires improvement at schools in a way that simply providing additional resources cannot. The evidence from Florida also suggests that the gains produced by such an accountability system are real indicators of improvement in learning, and not simply teaching to the test, cheating, or other manipulations of the testing system. Whether the same gains could have been produced using alternative sanctions is unknown. But the fact is that vouchers were used, and they were unquestionably effective.
Jay P. Greene is a senior fellow at the Manhattan Institute for Policy Research.