
While the country remains fixated on the tensions between the Trump administration and elite research universities, a more insidious threat to many other institutions of higher education is brewing. Its cause isn’t one single factor but a set of pressures emanating from demographic changes, shifts in the public’s perception of the value of a college education in relation to its costs, increased operating costs, emerging alternatives to traditional colleges, and, of late, possible changes in federal policies and programs. The net effect is that many institutions are much closer to the brink of closure than they have been in the past.
These pressures are why one of us, in a 2013 article in the New York Times with Clayton Christensen, predicted that 25 percent of colleges would consolidate over the next 15 years. They also led Robert Kelchen and colleagues to publish a paper (recently adapted for Education Next) detailing the increase in annual closures that could result from declining enrollments at colleges and universities.
The attention paid to this matter has largely focused on three segments of the industry where most closures and consolidations have occurred: for-profit institutions; tuition-dependent, non-profit schools with fewer than 1,000 students, which represent 35 percent of all colleges (down from 40 percent a decade ago thanks to consolidation); and regional public colleges and universities that are merging.
A study conducted over the past year of 44 private, tuition-dependent New England schools that enroll between 1,000 and 8,000 students, reveals that the threat facing colleges and universities could be much more pervasive.
Assuming business as usual and no decline in enrollment in the coming years, 15 of the 44 schools are already facing serious liquidity challenges at their current levels of enrollment—or will do so shortly, according to their audited 2024 fiscal year results. These schools will only be able to cover their typical operating expenses and other normal uses of cash for a maximum of three years before they must spend beyond 5 percent to 7 percent of their unrestricted quasi-endowments to sustain operations—which risks undermining their long-term sustainability. Six have already stepped into that dangerous territory, as they are, on average, drawing down 12.7 percent of their endowment for operations—well in excess of the industry norm of roughly 5 percent.
This is likely an overly optimistic scenario. As Carleton College professor Nathan Grawe and others have shown, college enrollment in the Northeast is likely to fall in the years ahead. Although there are debates over just how much that could happen, many colleges do not have the option to be business as usual.
If enrollments decline just 2.5 percent per year over four years, quasi-endowments would sustain 22 of the 44 survey schools for just 5.4 years on average—assuming no major cuts, additional philanthropy, new debt, or asset sales. If enrollment declined by just 1.25 percent per year over four years, 15 schools would have just five years before becoming insolvent.
The picture gets darker if enrollments drop 15 or 20 percent over the next four years. Indeed, first-time matriculations at 27 of the 44 schools already dropped 8.8 percent on average between 2023 and 2024, according to IPEDS.
* * *
Private Colleges in New England on the Brink (Figure 1)
The study looked at 44 private, tuition-dependent colleges that enroll between 1,000 and 8,000 students.
| American International | Connecticut | Lesley | Roger Williams |
| Assumption | Curry | Merrimack | Sacred Heart |
| Babson | Emerson | Middlebury | Saint Anselm |
| Bates | Emmanuel | Mount Holyoke | Saint Michaels |
| Bay Path | Endicott | New England College | Salve Regina |
| Bentley | Fairfield | Norwich | Springfield |
| Bryant | Gordon | Our Lady of the Elms | Stonehill |
| Champlain | Holy Cross | Providence | Suffolk |
| Clark | Husson | Quinnipiac | Trinity |
| Colby | Johnson & Wales | RISD | Univ. of New England |
| Colby Sawyer | Lasell | Rivier | Wheaton |
As shown in Figure 1 above, many of the New England schools analyzed in this study have strong, recognizable brands. They collectively serve roughly 140,000 students and employ nearly 13,000 faculty and 19,000 staff members.
In contrast with most college financial-health models that give considerable weight to an institution’s net-asset value on paper, our analysis examines cash flows. It looks only at liquid assets—cash that is available and generated in the normal course of business and other unrestricted investments that can fund operations. The model uses a simple formula with just two parts to examine each school’s potential long-term cash flow based on published year-end financial statements: cash and equivalents on hand and annual primary net cash flow. (The full methodology appears as an appendix at the end of the article, alongside answers to potential objections about the model.)
To illustrate the model’s value, consider Birmingham-Southern, a college in Alabama that closed its doors in 2024. When the school’s 2019 financial statements were fed into the cash-flow model, it showed that the school had less than a year before it would become functionally insolvent—which is what would have happened had the college not received a $3 million Covid grant, secured a $10 million loan from an affiliated religious group, and spent down most of its $50 million donor-restricted endowment in an attempt to stay afloat.
By contrast, the federal government monitors colleges based on a “Financial Responsibility Composite Score,” which is made up of three ratios from an institution’s audited financial statements: its primary reserve ratio, an equity ratio, and a net income ratio. It ranks schools along a scale from negative 1.0 to positive 3.0. According to the Federal Student Aid website, “a score greater than or equal to 1.5 indicates the institution is considered financially responsible. Schools with scores of less than 1.5 but greater than or equal to 1.0 are considered financially responsible, but require additional oversight.” By the federal government’s calculation, Birmingham Southern’s composite score in 2019 was a “financially responsible” 1.9.
As another example, at the end of its 2023 fiscal year, Brandeis University, a school in the Boston area that was not part of our study because of the size of its research portfolio, reported an operating surplus of $1.9 million and said, “The University’s financial profile remained solid in fiscal year 2023.” Just one year later, however, Brandeis’s president resigned after the university cut 60 positions and a faculty vote of no confidence. The university faced what the Boston Globe labeled “financial headwinds.”
How did this happen seemingly out of nowhere?
Cash Flow Projection for Brandeis University (Figure 2)
Using the university’s 2019 financial statements as a starting point, the projection shows a depletion of $20 million from its quasi-endowment by 2024.
Cashflow Projection (in millions of dollars)
| Year | Operating Revenue | Operating Expense | Opening Cash | Plus: Operating | Plus: Depreciation | Less: Debt | Less: Fixed Asset Additions | Net Cash Flow | Ending Cash | Quasi-Endowment |
| 2020 | $310 | $312 | $29 | $(2) | $28 | $12 | $15 | $(1) | $28 | $105 |
| 2021 | 305 | 313 | 28 | (8) | 29 | 12 | 15 | (6) | 22 | 105 |
| 2022 | 300 | 315 | 22 | (15) | 31 | 12 | 15 | (11) | 11 | 105 |
| 2023 | 295 | 316 | 11 | (21) | 32 | 12 | 15 | (16) | (4) | 100 |
| 2024 | 295 | 318 | (4) | (23) | 34 | 12 | 15 | (16) | (20) | 84 |
Note: Projection assumes 10 percent decline in enrollment after 2019; it excludes $41 million in direct research expenses and revenues.
The answer lies in its cash positions. Brandeis’s challenges were the predictable result of the decline in enrollment the university had experienced in recent years. According to the cash-flow model used for this study, Figure 2 is a five-year cash-flow projection for Brandeis based on its 2019 financial statements with $41 million of direct research expenditures and the associated grant revenue offset excluded. The model builds in a 10 percent decline in enrollment, which is what Brandeis experienced over that period of time.
The projection isn’t precise, as it is expressed in 2019 present-dollar terms. And increased non-student revenues from overhead charges on research grants, a higher draw on endowment, and an increase in other investment income buoyed the university’s cash position at year-end over the years. But the model was still able to predict the erosion in cash Brandeis experienced over time and, most importantly, a projected $20 million drawdown on its quasi-endowment in Year 5.
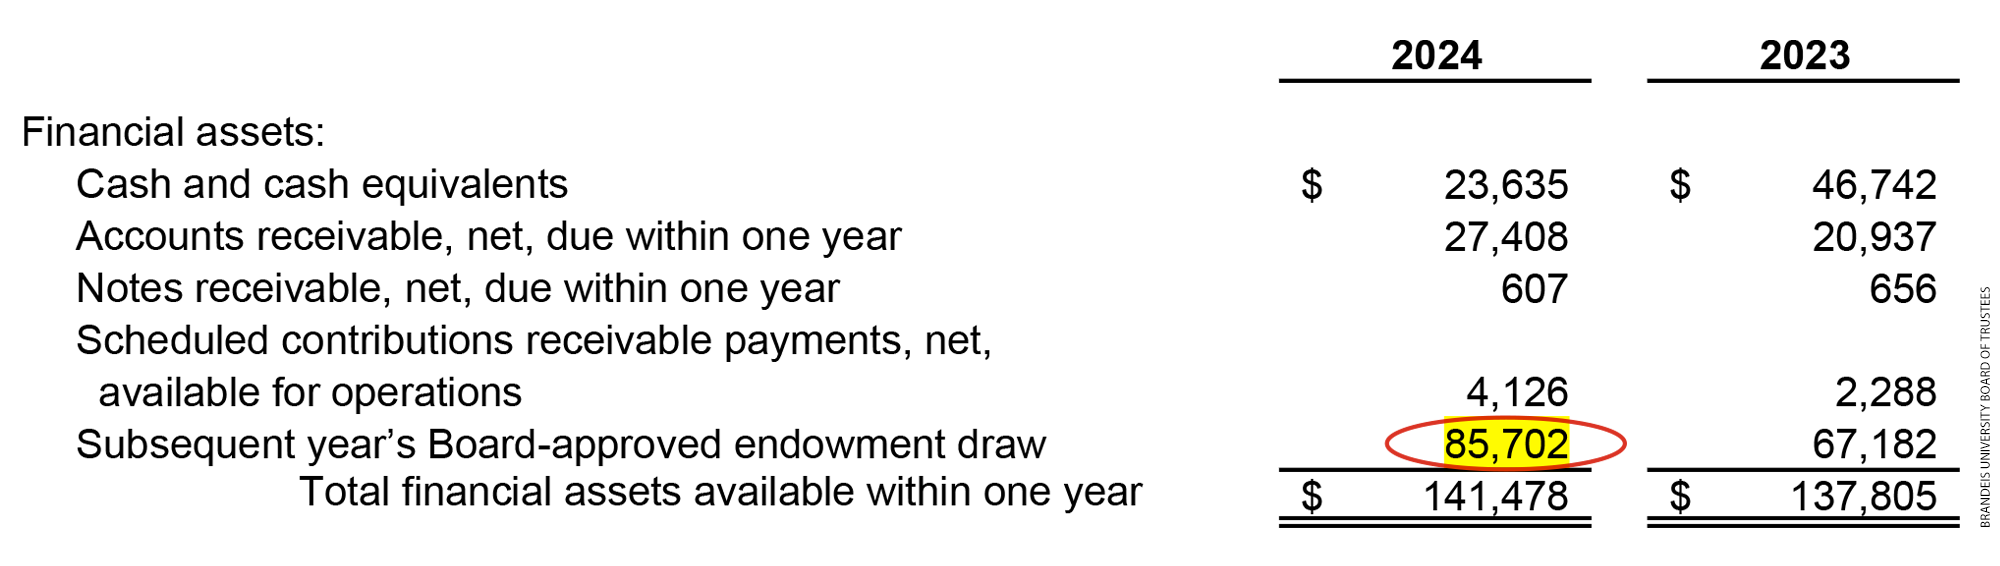
Why is that number important? On page 20 of Brandeis’s 2024 Financial Statements, note #10 indicates that the board approved an increase of $18.5 million in spending from the endowment in 2025—approximately $15 million more than what one would have expected based on its normal spending policy and approved endowment draws in recent years.
* * *
It isn’t uncommon for schools to overstate their financial hardiness, take a “wait-and-see” approach, or seem unaware of the risk they face. One well-known school included in our study recently reassured its stakeholders that the university maintained its robust financial position with sizeable assets and a large, unrestricted endowment that meant they were relatively liquid.
The cash-flow model, however, paints a different picture. If the school were to do nothing and simply liquidate its large quasi-endowment to fund its business as usual, it would have less than 10 years of staying power even before considering the impact of possible declines in enrollment.
Colleges Need Steady Enrollment (Figure 3)
How long a college can remain viable as a degree-conferring institution—its staying power—depends on both its current financial position and its ability to sustain enrollment. Even a modest decline in enrollment increases a school’s risk of closure.
Baseline Staying Power (SP) Metrics
| Enrollment: | ||||||||||
| No Decline | 5% Decline | 10% Decline | 15% Decline | 20% Decline | ||||||
| At risk | # | Years of SP | # | Years of SP | # | Years of SP | # | Years of SP | # | Years of SP |
| No | 29 | 9.0 | 28 | 7.7 | 23 | 6.4 | 19 | 5.1 | 16 | 4.3 |
| Yes | 15 | 1.3 | 16 | 1.2 | 21 | 1.4 | 25 | 1.5 | 28 | 1.5 |
| % at risk | 34% | 36% | 48% | 57% | 64% | |||||
Note: At-risk threshold = 3 years
Figure 3 shows how the baseline staying power shifts at different levels of enrollment decline—from 15 schools at risk of dipping into their quasi-endowment within three years if enrollment is flat, to 28 schools at risk if enrollment declines 20 percent over four years.
Support from Endowments a Band-Aid, not a Cure (Figure 4)
Most schools can stay afloat longer if they tap into their quasi-endowment funds—a measure of their maximum staying power—but even this move presents substantial risk to their solvency and is considered financially unwise.
Maximum Staying Power (SP) Metrics
| Enrollment: | ||||||||||
| No Decline | 5% Decline | 10% Decline | 15% Decline | 20% Decline | ||||||
| At risk | # | Years of SP | # | Years of SP | # | Years of SP | # | Years of SP | # | Years of SP |
| No | 42 | 8.6 | 29 | 10.0 | 22 | 10.0 | 15 | 10.0 | 12 | 10.0 |
| Yes | 2 | 2.5 | 15 | 5.0 | 22 | 5.4 | 29 | 5.5 | 32 | 4.9 |
| % at risk | 5% | 34% | 50% | 66% | 73% | |||||
Note: Includes quasi-endowment backstop. At-risk threshold = 10 years
Figure 4 shows how the maximum staying power—a measure that assigns a timeline to potential insolvency—shifts across the 44 institutions at different levels of enrollment decline assuming business as usual—from two institutions at-risk within 10 years assuming no decline in enrollment to 32 schools if there’s a 20 percent decline over four years.
Although schools can legally draw down the principal of their quasi-endowments and use those funds for any purpose with board approval, it is only prudent to do so to preserve working capital. It may make sense, for example, to fund an essential but costly maintenance project using quasi-endowment funds. But drawing down funds that the board has put aside to support the school for the long term to fund current operations on an ongoing basis is contrary to the principles of sound financial management that have helped these 44 schools exist, on average, for 134 years.
Not Only a New England Problem (Figure 5)
The same analysis applied to 27 colleges on the west coast with similar profiles to the 44 in New England reveal an even more sobering financial risk to their sustainability. This suggests the financial viability of midsize universities is a nationwide problem, even without the expected declines in enrollment.
Baseline Staying Power (SP) Metrics for West Coast Schools
| Enrollment: | ||||||||||
| No Decline | 5% Decline | 10% Decline | 15% Decline | 20% Decline | ||||||
| At risk | # | Years of SP | # | Years of SP | # | Years of SP | # | Years of SP | # | Years of SP |
| No | 14 | 9.2 | 12 | 9.2 | 10 | 8.0 | 6 | 7.5 | 4 | 8.4 |
| Yes | 13 | 1.0 | 15 | 0.9 | 17 | 0.8 | 21 | 0.8 | 23 | 0.8 |
| % at risk | 48% | 56% | 63% | 78% | 85% | |||||
Note: At-risk threshold = 3 years
We’ve replicated this analysis for 27 schools on the west coast that have characteristics similar to the New England schools. The outcome of that research, shown in Figure 5, found that the finances of the west coast schools were even more concerning. Close to half exhibit signs of financial distress even without an enrollment decline. Nearly two-thirds would need to dip into quasi-endowment funds after 3 years if enrollment were to decline just 10 percent.
This analysis suggests that many more of the 500-plus private, midsize, tuition-dependent colleges and universities across the country may be facing risks similar to those demonstrated for the at-risk New England schools.
Cautions and Paths Forward
To be clear, institutions with something less than three years of baseline staying power or 10 years of maximum staying power are not doomed to be part of the coming college consolidation and distress—either closing, merging, or declaring financial exigency. Schools can seek to generate new revenue streams, attract more students, reduce costs, create partnerships, and more. They can fundraise, sell illiquid assets, and sharpen their value propositions.
But as leaders consider innovative ways to maintain or even grow enrollments, they must remember that these strategies take time and money to mature and are not guaranteed to succeed. Furthermore, they should not sidestep an inconvenient truth by focusing on net asset value rather than cash with their boards. Nor should they question whether it is fair to assume that all things will be equal or simply believe they will come out on the “right” side of the coming declines in enrollment.
Yes, it’s possible that if colleges on our list close or merge, some of their enrollment will go to other schools on the list. That’s likely, in fact, since 57 percent of students nationwide enroll in a college within 100 miles of home. Some of the schools could therefore experience rising enrollment at the expense of other institutions.
Many of these schools appear to be adopting such a strategy of hope, which is unwise given the challenges they are already facing. Thirty-eight of the 44 schools list “growth” as a main objective in their published strategic plans, and in most cases emphasize at least maintaining enrollment of traditional-aged students. That suggests they aren’t assigning sufficient weight, if any, to the downside risks to their plans in a sea of zero-sum enrollment challenges for institutions.
As a case in point, at 30 of the 44 schools, cash declined by 30 percent on average over the last two years. Whether that shortfall is because of enrollment declines (although first time matriculations were down 1.9 percent on average for the 44 schools in the last year), because cost increases—particularly for compensation—outpaced increased revenue, or because of tuition discounting doesn’t matter. It happened.
Taking a forward-looking finance mindset to planning as opposed to relying on accounting, which focuses simply on the past, will be key. Even as schools pursue new strategies, downside risks must be considered.
By way of illustration: Personnel costs account for 56 percent of total operating expenditures on average for the 44 schools. It is possible to shore up finances at the same time schools are attempting to shore up enrollments by taking advantage of normal attrition—which the College and University Professional Association for Human Resources (CUPA-HR) estimates to be 13.4 percent annually nationwide—to downsize thoughtfully, gradually, and discretely. Phased downsizing could be a relatively painless way to mitigate financial risk, so long as the school can still deliver on its commitments to students through strategies like using AI for administrative tasks, partnering with other schools for courses, and the like. In contrast, major cuts enacted under the gun are likely to be reported by the media, which could in turn raise student and parent concerns and accelerate declines in enrollment.
The Costs of Not Downsizing (Figure 6)
If a hypothetical at-risk New England college experienced a 10 percent enrollment decline but didn’t reduce costs, it would run out of cash reserves in year 2, need to draw down from its quasi-endowment, and become financially insolvent by year 8.
Cash-Flow Projection (in millions of dollars) for At-Risk Schools Facing 10% Enrollment Decline: No Action
| Year | Operating Revenue | Operating Expense | Opening Cash | Plus: Operating | Plus: Depreciation | Less: Debt | Less: Fixed Asset Additions | Net Cash Flow | Ending Cash | Quasi-Endowment |
| 1 | $117 | $119 | $14 | $(2) | $10 | $4 | $13 | $(10) | $4 | $104 |
| 2 | 115 | 121 | 4 | (6) | 11 | 4 | 13 | (12) | (9) | 95 |
| 3 | 113 | 122 | (9) | (9) | 13 | 4 | 13 | (15) | (23) | 81 |
| 4 | 110 | 123 | (23) | (13) | 14 | 4 | 13 | (17) | (40) | 64 |
| 5 | 110 | 125 | (40) | (14) | 15 | 4 | 13 | (17) | (57) | 47 |
| 6 | 110 | 126 | (57) | (16) | 17 | 4 | 13 | (17) | (73) | 31 |
| 7 | 110 | 127 | (73) | (17) | 18 | 4 | 13 | (17) | (90) | 14 |
| 8 | 110 | 129 | (90) | (18) | 19 | 4 | 13 | (17) | (107) | (3) |
| 9 | 110 | 130 | (107) | (20) | 21 | 4 | 13 | (17) | (124) | (19) |
| 10 | 110 | 131 | (124) | (21) | 22 | 4 | 13 | (17) | (140) | (36) |
Note: Hypothetical college is a composite of the 21 New England schools that become financially at risk by experiencing a 10 percent decline in enrollment (see Figure 3). Projection includes quasi-endowment backstop.
To illustrate the dynamics of phased downsizing, we created a composite profile of the 21 schools that have a baseline staying power of less than three years if they were to experience a 10 percent decline in enrollment over the next 4 years. Figure 6 shows the 10-year projection of this hypothetical composite school. It would exhaust its cash-only reserves by year 2 and become insolvent by year 8, assuming no major changes to operations.
Personnel Cuts Preserve Endowment (Figure 7)
If the hypothetical school reduced its faculty and staff by 13.5 percent (or $10 million) in year 4, it would keep its quasi-endowment viable but still deplete it by almost $70 million.
Cash-Flow Projection for At-Risk Schools Facing 10% Enrollment Decline: Reduction In Force in Year 4
| Year | Operating Revenue | Operating Expense | Opening Cash | Plus: Operating | Plus: Depreciation | Less: Debt | Less: Fixed Asset Additions | Net Cash Flow | Ending Cash | Quasi-Endowment |
| 1 | $117 | $119 | $14 | $(2) | $10 | $4 | $13 | $(10) | $4 | $104 |
| 2 | 115 | 121 | 4 | (6) | 11 | 4 | 13 | (12) | (9) | 95 |
| 3 | 113 | 122 | (9) | (9) | 13 | 4 | 13 | (15) | (23) | 81 |
| 4 | 110 | 113 | (23) | (3) | 14 | 4 | 13 | (6) | (30) | 74 |
| 5 | 110 | 114 | (30) | (4) | 15 | 4 | 13 | (6) | (36) | 68 |
| 6 | 110 | 116 | (36) | (5) | 17 | 4 | 13 | (6) | (43) | 61 |
| 7 | 110 | 117 | (43) | (7) | 18 | 4 | 13 | (6) | (49) | 55 |
| 8 | 110 | 118 | (49) | (8) | 19 | 4 | 13 | (6) | (56) | 48 |
| 9 | 110 | 120 | (56) | (9) | 21 | 4 | 13 | (6) | (62) | 42 |
| 10 | 110 | 121 | (62) | (11) | 22 | 4 | 13 | (6) | (69) | 35 |
Note: Hypothetical college is a composite of the 21 New England schools that become financially at risk by experiencing a 10 percent decline in enrollment (see Figure 3). Projection includes quasi-endowment backstop.
If, in year 4, after three years of drawing down the quasi-endowment, this composite school undertook a $10 million reduction in force, then 87 positions—13.5 percent of its faculty and staff—would be eliminated. Recall that eliminating 60 positions at Brandeis out of a staff of over 1,000 people caused big headlines in the Boston Globe, so imagine the media outcry at our hypothetical college. Plus, as Figure 7 shows, the quasi-endowment would still be drained down from $104 million to $35 million.
The Theory of Natural Attrition (Figure 8)
Faced with a 10 percent decline in enrollment, an at-risk college could prolong its operations by allowing for the natural attrition of its faculty and staff without filling some vacancies. Doing so would reduce expenses and the amount it draws from its quasi-endowment.
Cash-Flow Projection for At-Risk Schools Facing 10% Enrollment Decline: Natural Attrition
| Year | Operating Revenue | Operating Expense | Opening Cash | Plus: Operating | Plus: Depreciation | Less: Debt | Less: Fixed Asset Additions | Net Cash Flow | Ending Cash | Quasi-Endowment |
| 1 | $117 | $117 | $14 | $0 | $10 | $4 | $13 | $(7) | $7 | $104 |
| 2 | 115 | 115 | 7 | 0 | 11 | 4 | 13 | (7) | 0 | 104 |
| 3 | 113 | 114 | 0 | (1) | 13 | 4 | 13 | (6) | (7) | 97 |
| 4 | 110 | 113 | (7) | (2) | 14 | 4 | 13 | (6) | (13) | 91 |
| 5 | 110 | 114 | (13) | (3) | 15 | 4 | 13 | (6) | (19) | 85 |
| 6 | 110 | 115 | (19) | (5) | 17 | 4 | 13 | (6) | (25) | 79 |
| 7 | 110 | 117 | (25) | (6) | 18 | 4 | 13 | (6) | (31) | 74 |
| 8 | 110 | 118 | (31) | (7) | 19 | 4 | 13 | (6) | (36) | 68 |
| 9 | 110 | 119 | (36) | (9) | 21 | 4 | 13 | (6) | (42) | 62 |
| 10 | 110 | 121 | (42) | (10) | 22 | 4 | 13 | (6) | (48) | 56 |
Note: Hypothetical college is a composite of the 21 New England schools that become financially at risk by experiencing a 10 percent decline in enrollment (see Figure 3). Projection includes quasi-endowment backstop.
But, as Figure 8 shows, if this composite school took advantage of a 10 percent attrition rate among faculty and staff from the start by selectively eliminating the equivalent of 40 percent of the positions that become vacant, its quasi-endowment position at year 10 would be improved by $21 million—not insignificant given that this would mean eliminating 97 positions, just 10 more than under the prior scenario. Plus, the school will have likely avoided many negative headlines.
EdNext in your inbox
Sign up for the EdNext Weekly newsletter, and stay up to date with the Daily Digest, delivered straight to your inbox.
* * *
College leaders would be wise to stop considering partnerships and mergers as akin to failure. Instead, it is critical that they be realistic about whether their institution can make it on its own. They should want to avoid not only Birmingham-Southern’s fate but also what that institution did to the 1,224 new students it enrolled between 2019—when it was obvious it was in deep trouble—and its closure in 2024.
Being proactive about a merger while you still have valuable assets and a strong value proposition provides leverage in negotiations. And using that leverage to preserve the mission of the school in the context of a merger may be the best and possibly only way for the board to fulfill its fiduciary responsibility.
Steven Shulman is a former entrepreneur who began consulting for higher education institutions in 1999. Michael B. Horn is an executive editor of Education Next, co-founder of and a distinguished fellow at the Clayton Christensen Institute for Disruptive Innovation, and author of the national bestseller Job Moves.
Explanation of the Methodology
The study used a simple formula with just two parts to examine each school’s potential long-term cash flows based on published year-end financial statements: cash and equivalents on hand and annual primary net cash flow (a measure that distinguishes from cash that might be on hand for technical, temporary, or restricted purposes), with the latter calculated in the following manner:
Operating Outcome + Depreciation – Debt Retirement – Capitalized Expenditures
Operating outcome is a college’s net income from operations—operating revenues minus operating expenses. Schools typically rely on this as the primary measure of their financial performance over the course of a year. But this focus is myopic. It doesn’t say whether a college is generating a cash surplus or cash deficit, which is far more important than the operating outcome per se. Our methodology addresses that by adding back depreciation (a non-cash expense); subtracting debt retirement (cash payments on debt principal given that just interest is considered an operating expense); and subtracting capital expenditures that are not funded with debt, which have an immediate impact on cash but are only recognized as operating expenses over time through future depreciation. Factors other than these that affect cash flow aside from new debt and the sale of assets are random and immaterial.
For those institutions that have a negative net cash flow, one can calculate how long the institution can continue to operate in this manner in the ordinary course of business on a present value basis simply by dividing its cash and equivalents on hand at the end of a fiscal year by the primary net cash outflow for that year. We refer to this measure as a college’s “baseline staying power”—the time period by which a college will exhaust its cash and cash equivalents before it must take extraordinary measures to meet payroll and pay other bills if it simply carries on as it has most recently.
A school with $25 million in cash and equivalents on hand and a negative net operating cash flow of $10 million, for example, would have 2.5 years of “staying power.” The calculations assume a business-as-usual posture—meaning they assume there won’t be any groundbreaking gifts, dramatic cuts, new debt, or growth.
Technical cash-management tactics and short-term borrowing to cover seasonal needs aside, if an institution desires to continue carrying on with business as usual, those extraordinary measures will likely mean dipping into its unrestricted quasi-endowment beyond a normal spend rate as the primary source of additional cash. By adding in an institution’s quasi-endowment, we can calculate a “maximum staying power” measure to see how long a college could sustain operations by spending down its unrestricted investments—a legal but dubious strategy in relation to sustainability that ordinarily serves as a way for schools to weather tough times that are temporary in nature.
One can then approximate how different declines in enrollment would impact the institution by reducing its total student net revenue in lockstep—a 10 percent decrease in overall enrollment, for example, would mean a 10 percent decline in the total student net revenue portion of an institution’s total operating revenue. For purposes of calculating staying power, it isn’t necessary to get overly analytical about which student populations might see declines and the impact of tuition discounting. The calculations focus only on net student revenue.
Some natural objections may arise.
- What about a school’s endowment? Endowments other than quasi-endowments are restricted by donor stipulations and can’t cover ordinary operations except in accordance with those stipulations and subject to state law, federal regulations, and the institution’s endowment spending policy. On average, for the 44 survey schools, 61 percent of total endowments are restricted.
- What about the ability of an institution to sell off other assets like real estate or to take out debt? Those are certainly options, although the ability to take out additional debt on favorable terms or at all from a compromised financial position is a question mark at best. With debt averaging 54 percent of the book value of fixed assets, the 44 schools also appear to be highly leveraged. Furthermore, liquidating assets is certainly not business as usual.
— S. M. S and M. B. H.