“How did you go bankrupt?” one American expat asks another in Ernest Hemingway’s The Sun Also Rises. “Two ways,” his friend responds. “Gradually and then suddenly.”
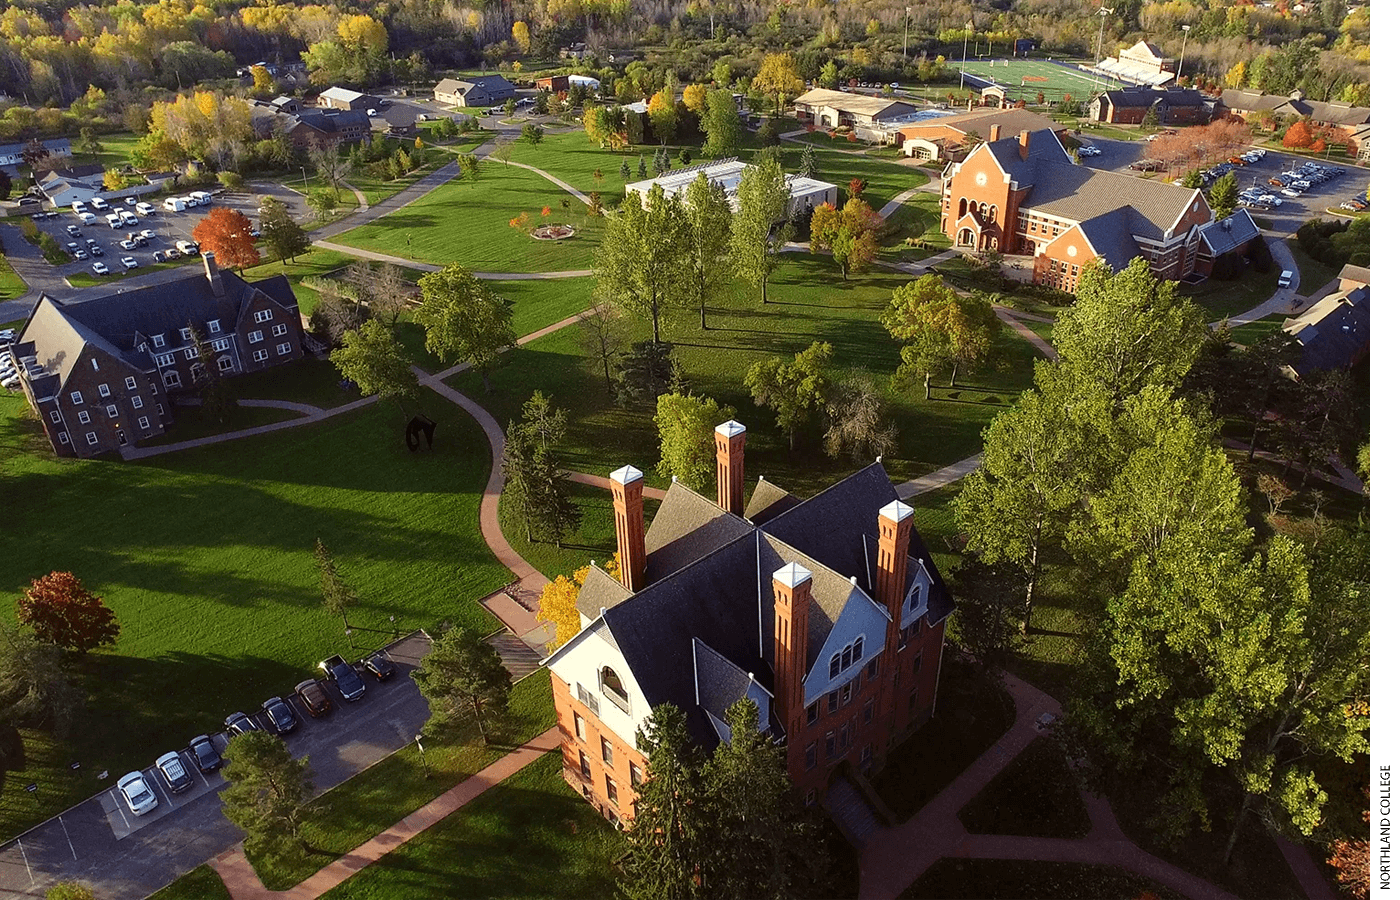
The most dramatic college closures tend to follow a similar arc. A century-old, beloved liberal arts institution abruptly shuts its doors, sending students and staff scrambling as it succumbs at last to the financial challenges dogging schools that rely on tuition dollars. But the forces creating those challenges—declining enrollment, punishing operating costs, and anemic endowment returns—typically accumulate over a period of years if not decades. In recent years, these forces have all been featured players in the final chapters of small nonprofit schools like Wells College (New York), Northland College (Wisconsin), Iowa Wesleyan University (Iowa), Finlandia College (Michigan), and more than three dozen others. This growth in closures has followed a massive reorganization of the for-profit college sector, where enrollment fell by more than half in the 2010s.
Research and policy discussions often focus on the negative effects of college closures on students, but that’s only part of the story. Colleges also serve as anchor institutions—local economic and cultural engines whose sudden disappearance can leave regions flat-footed. Communities with colleges have higher levels of educational attainment, employment in human capital-intensive industries, economic mobility, and local economic output. Colleges also function as cultural hubs, by supporting civic engagement and the arts, and by providing entertainment and a range of educational and enrichment opportunities for their neighbors. Closures affect entire communities, far beyond campus borders.
With higher education facing daunting financial conditions—not to mention a “demographic cliff” as the number of traditional-age students is set to decline starting with the class of 2026—more schools are likely to close. But which institutions are at the highest risk? To identify common characteristics of schools that close, we assembled the most comprehensive data set to date on colleges and universities. To measure institutions’ risk of closure, we also designed and tested a novel approach that uses machine learning to overcome data and methodological challenges. This method can predict closures with 83 percent average accuracy compared with 77 percent when applying the metrics currently used for federal accountability measurement. It also simultaneously enables the analyst to generate predictions for nearly twice as many institutions, as traditional methods typically discard many institutions due to missing data. Our methods thereby provide a more reliable glimpse into the future that can help local and regional leaders plan for and perhaps prevent potential disruptions.
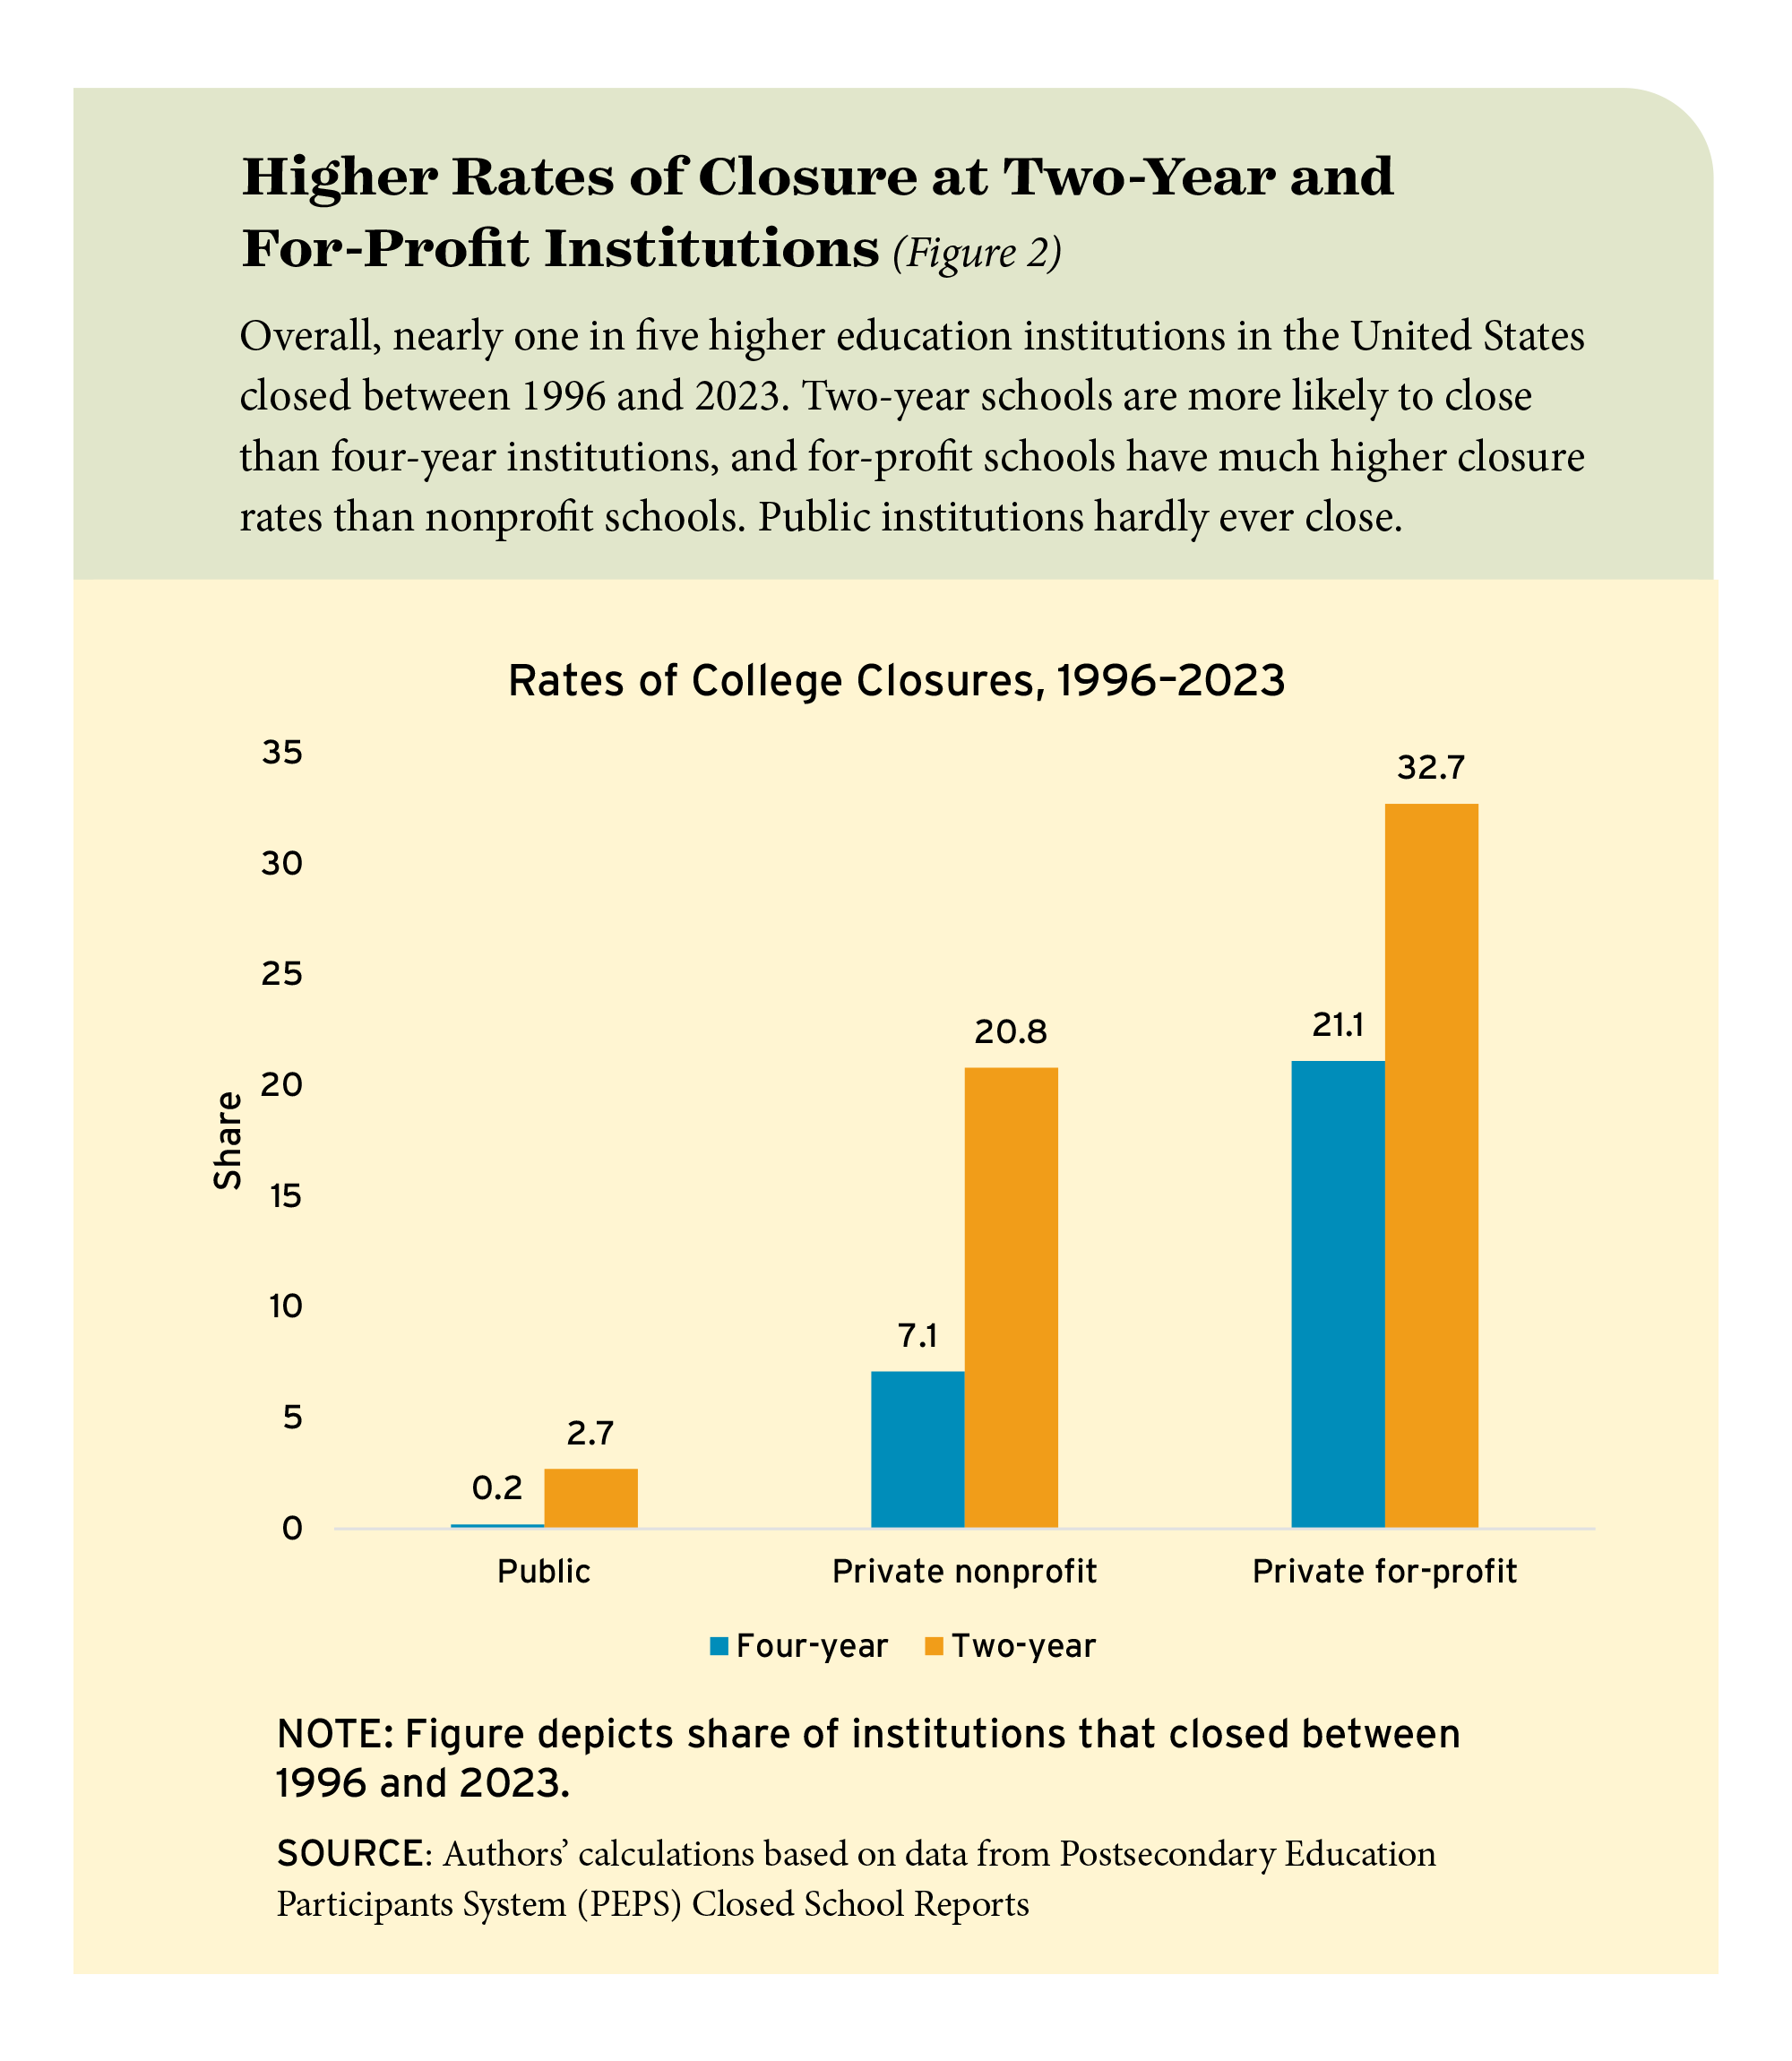
In looking at closures of four-year schools between 1996 and 2023, we find they are three times as likely at for-profits than at private nonprofits, while public institutions hardly ever close. Some 21 percent of for-profit colleges close compared with 7 percent of nonprofits and less than 1 percent of public schools. Our analysis also shows that closures are much more likely at two-year than at four-year colleges. Among all two-year schools, 21 percent of private nonprofits close compared with 3 percent of public programs. For-profit two-year schools have by far the highest closure rates among two-year programs, at 33 percent.
We investigate the extent to which institutional characteristics and financial metrics might foretell college closures by assessing their impact on the predictive power of traditional risk assessment and on our machine-learning model. This analysis shows that the federal government’s current measures of financial distress are informative; however, we also find that recent changes in enrollment, staffing, or revenue—metrics that are not currently part of federal accountability measurement—increase our model’s predictive power. We then look to the future and provide some back-of-the-envelope calculations to estimate the range of impacts on colleges from the “demographic cliff.”
While the precise effects of changing demographics, along with growing questions about the value of higher education are not yet fully known, it’s clear that more change is coming to American colleges and universities. With sound data and methods, the communities they shape can be better prepared for what’s ahead.
Financial Headwinds
Financial challenges have long played an important role in the history of American postsecondary education. For example, Harvard University relied on fundraising one-quarter of a bushel of corn (“colledge corne”) from each local family in the 1640s and 1650s. For the most part, institutions have proved fairly resilient: A 2016 analysis of nearly 500 private nonprofit colleges identified as having limited resources in 1972 found that nearly 85 percent continued to operate in some form more than four decades later.
But today, colleges are facing particularly unfavorable conditions in enrollment, tuition, and costs. The number of American 18-year-olds is projected to fall by 13 percent between 2026 and 2041, while the share of high-school graduates enrolling in college right away has already shrunk from 70 percent to 62 percent over the last decade. And when we look at enrollment among adult learners, defined as age 25 or older, the trends are even starker: Federal data show annual adult enrollment has fallen by nearly half since 2008. These declines are accompanied by growing skepticism among the public about the value of higher education (see “Apprenticeships on the Rise,” features, Summer 2023) and by the federal government’s expanded student-loan collection efforts.
Meanwhile, a growing number of states are limiting tuition increases at public colleges, and tuition growth has been at or below inflation at private nonprofit schools since 2018. Tuition discount rates at nonprofit schools reached a record-high average of 51 percent in 2022. At the same time, operating costs have risen quickly owing in part to pandemic-era inflation and a longer trend of rising operating expenses. While many colleges survived during the pandemic era due to timely federal support and emergency actions, more than four dozen nonprofit colleges closed between 2022 and 2024. Many of these closures came as a shock to students, staff, and the broader community, with some schools continuing to admit new applicants and coordinate next year’s courseloads weeks or even days before an announcement.
How can we better understand a college’s risk of shutting down? To date, research has identified several institutional characteristics statistically related to closure, such as being a Historically Black College or University (HBCU) or a women’s college, as well as financial characteristics like lower tuition, smaller endowments, and higher shares of instructional spending. Yet many of the factors do not necessarily cause financial distress in and of themselves; rather, they are correlated with other characteristics and indicators predictive of institutional challenges.
To better understand schools’ financial predicament, we look across the higher education industry to assess trends in revenues and expenditures. It is a vast sector: American higher education directly produces approximately $700 billion in expenditures, enrolls nearly 25 million students, and employs approximately 4 million people. It includes 5,686 institutions nationwide that are eligible to receive federal financial aid under Title IV of the Higher Education Act, along with a number of very small colleges, particularly in the for-profit sector, that operate without federal financial aid. Those non-eligible schools are not included in the descriptions and analyses that follow because of a lack of available data.
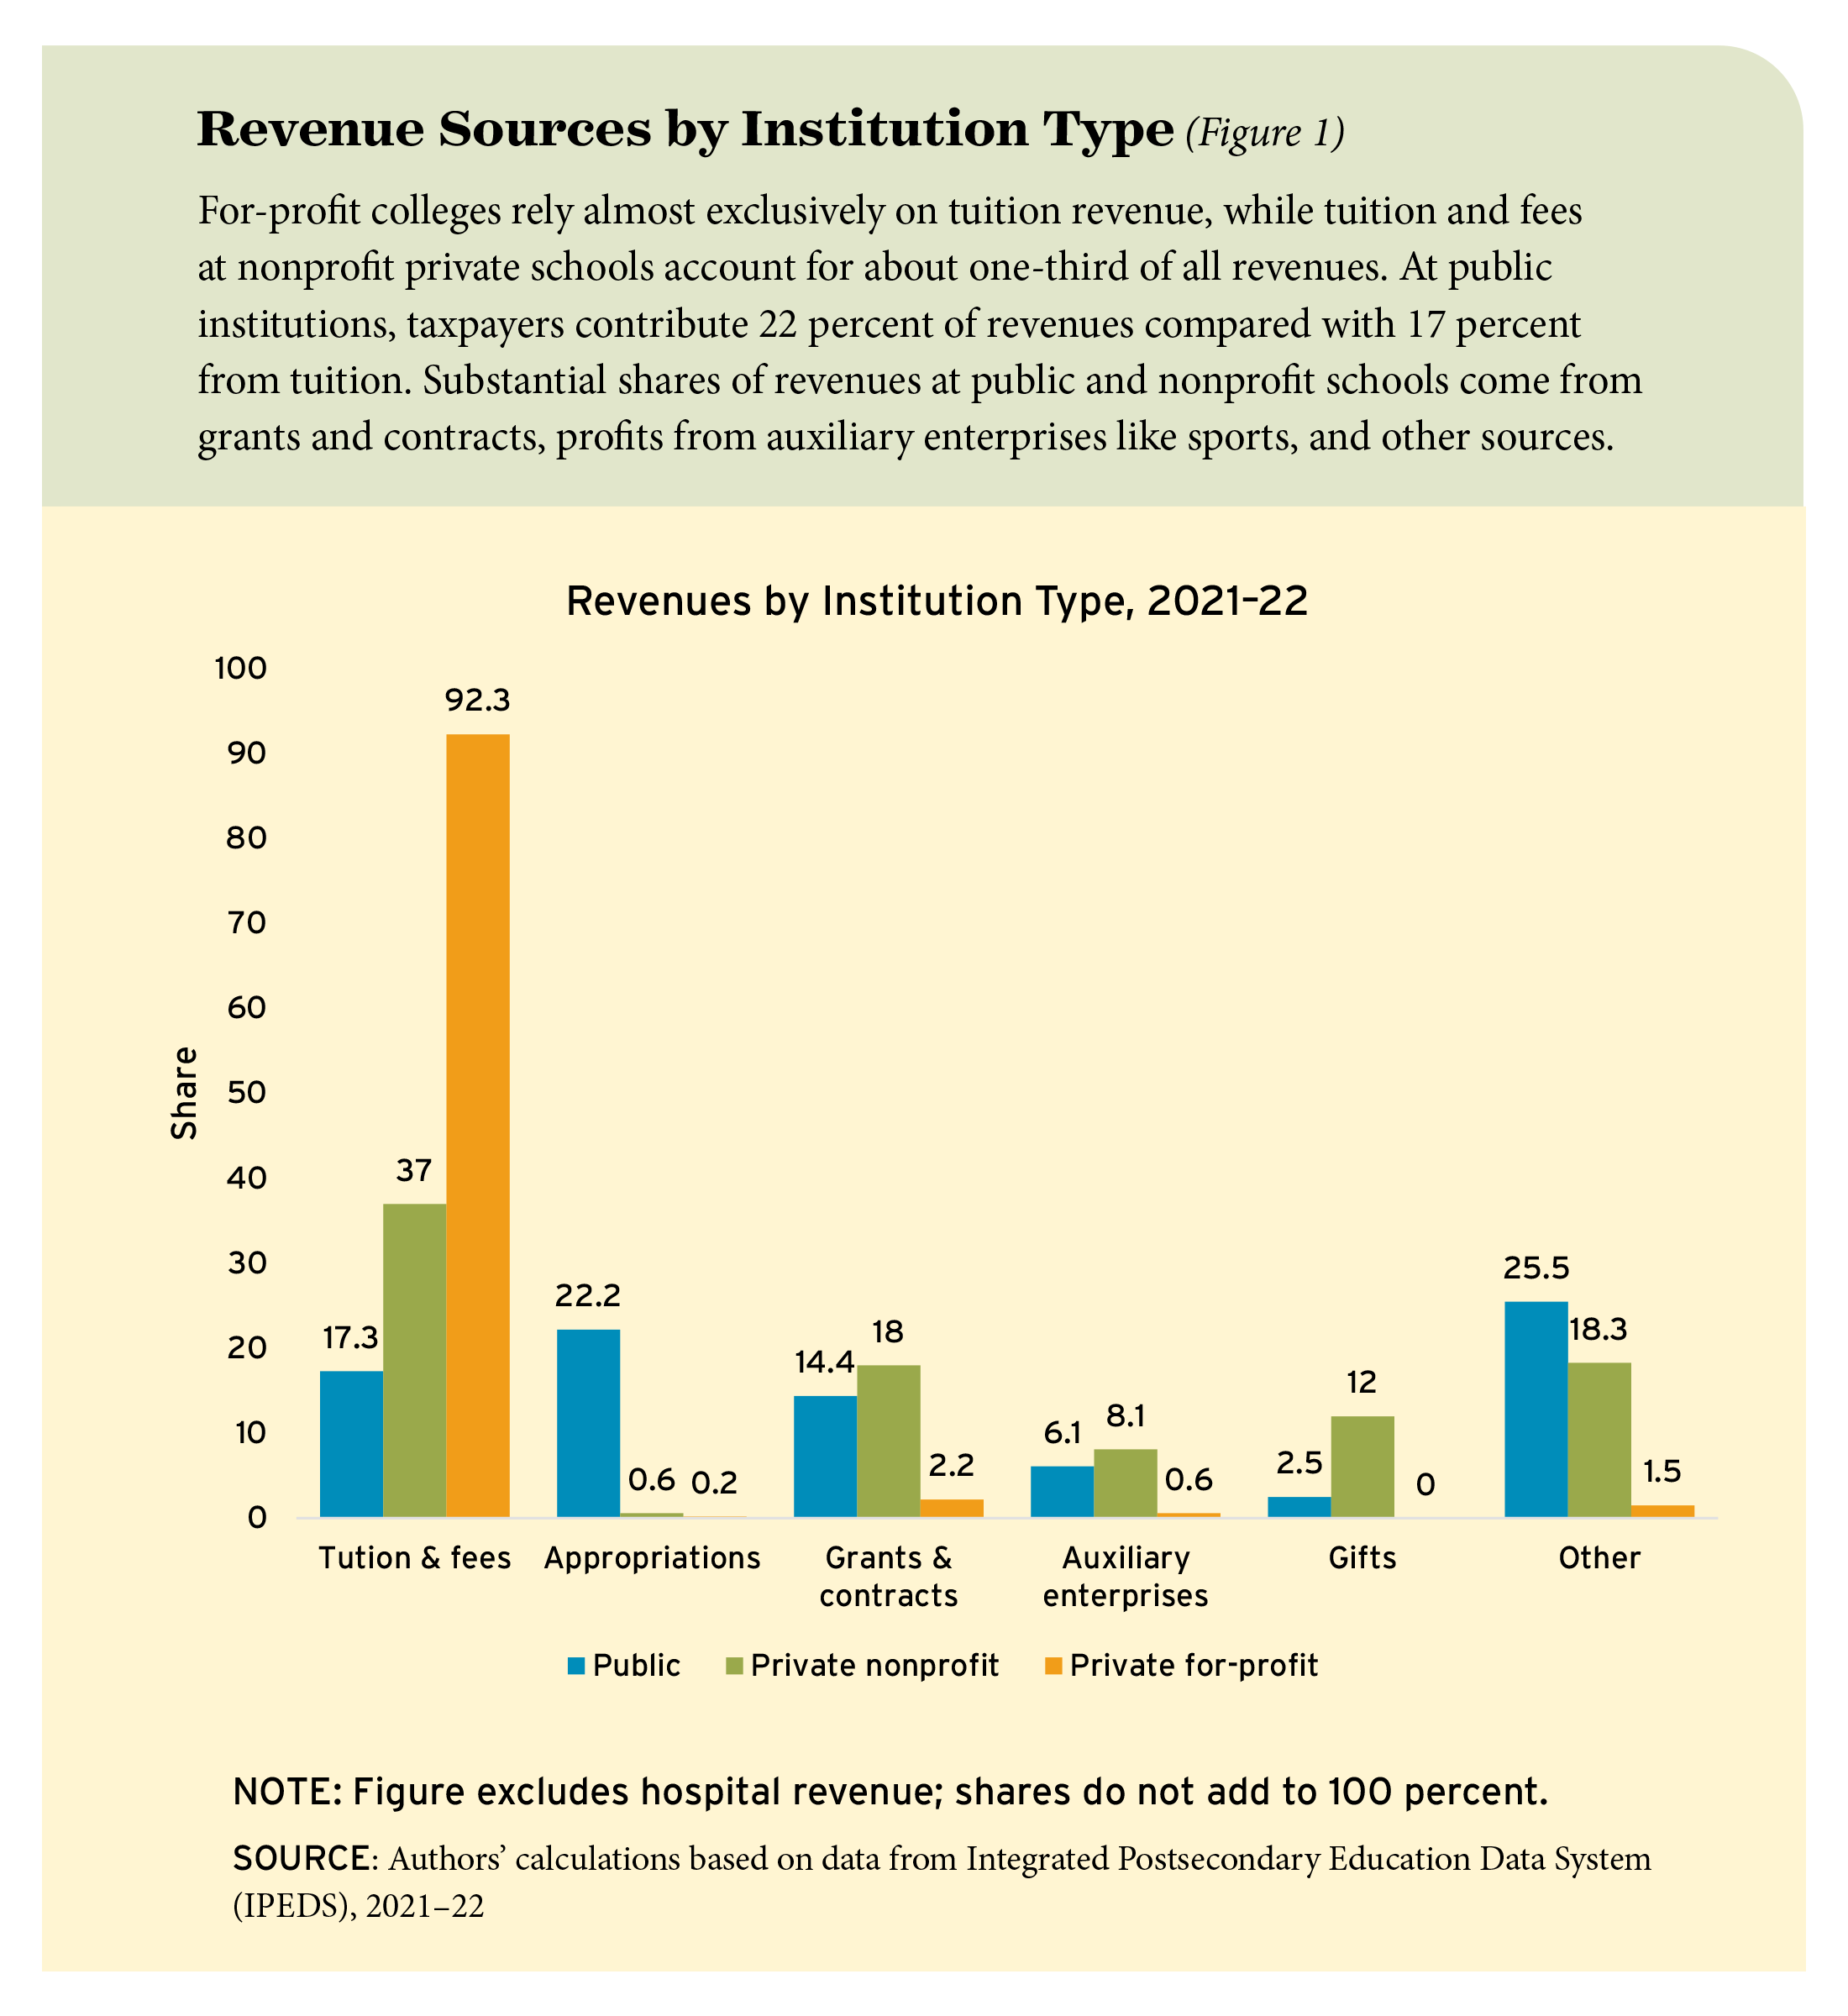
We first examine revenue sources across types of institutions and find broad differences (see Figure 1). For-profit schools are almost entirely reliant on tuition dollars, which account for about 93 percent of revenues compared with 37 percent at private nonprofits. Other major revenue sources at nonprofits include grants and contracts (18 percent), gifts (12 percent), and profitable auxiliary enterprises like sports (about 8 percent). Tuition dollars are less central at public colleges, which receive more government revenue (22 percent) than net tuition and fees (17 percent).
We also look at trends over time. Public colleges and universities experienced a clear upward trend in inflation-adjusted revenue, from $333 billion in 2002 to $472 billion in 2022, although revenue from both tuition and auxiliaries declined in real terms beginning in 2020 owing to the Covid-19 pandemic and enrollment declines. Revenues at private nonprofit colleges are more sensitive to investment returns due to school endowments; however, the long-term trend has been toward increased revenues for the sector, with tuition and auxiliary revenue generally following the same path as public institutions. By contrast, the finances of for-profit colleges grew sharply and then fell. From 2002 to 2011, revenue tripled from $15 billion to $46 billion amid dramatic growth. Following enrollment declines, a stricter regulatory environment, and the collapse of some large for-profit chains, total revenue declined to about $20 billion by 2018.
During those same years, expenditures grew. Operating costs have increased faster than general inflation for decades, driven by rising expenses for line items such as health insurance and administrative support. As a labor-intensive industry, expenses related to personnel are by far the largest expenditure category in most institutions’ budgets. Federal data from 2021–22 show that nationwide, instruction costs account for about 26 percent of expenditures at public colleges, compared with about 28 percent at nonprofits and 30 percent at for-profit schools.
Assessing Risk of Closure
The balance sheets and financial health of individual institutions vary widely within these broader trends. To take a closer look, we assemble the most comprehensive data set to date on the characteristics of 8,633 American colleges and universities, including dates of operation, institutional setting, student body, staff, and financial data from 2002 to 2023, primarily from the Department of Education’s Integrated Postsecondary Education Data System (IPEDS) data. We focus on variables that could potentially be associated with college closures based on prior research, economic theory, and our experiences in the field of higher education finance. These variables include enrollment, staff, revenues, expenses, assets and debt, financial metrics such as liquidity and leverage, and measures of economic health such as cash on hand and major swings in enrollment. We also document when data is missing—most frequently, institutional data lacks measures of debt, assets, and leverage. Finally, we look at the characteristics of the college’s local population, including rates of employment, poverty, and per-capita income.
We then identify schools that closed between 1996 and 2023 based on Closed School Weekly Reports from the Federal Student Aid’s Postsecondary Education Participants System (PEPS) database. Our analysis only counts schools where the main campus (not a branch or satellite) closed; overall, a total of 1,671 colleges closed during the analysis period.
The vast majority of closures are among private for-profit colleges, which have the highest closure rates (see Figure 2). This is intuitive—whether they are “nimble critters or agile predators,” for-profit colleges are much more likely to exit the marketplace if they do not see the opportunity to make a profit in the near future. Nearly three-fourths of closures in the data set are two-year for-profit colleges, and almost one-third of the 3,732 institutions observed in this sector closed at some point between 1996 and 2023. On the other hand, while closures at private nonprofit four-year colleges get the lion’s share of attention, rates are relatively modest at about 7 percent over the same period. Public schools, in turn, almost never fully close, but rather reorganize.
Comparing schools that close with those that don’t reveals immediate contrasts. Colleges that close tend to be smaller, more tuition-driven, and experience larger declines in enrollment and revenue than colleges that remain open. Among schools that never close, the median operating margin is about 9 percent, and tuition accounts for 45 percent of revenue; at schools that close, the median margin is 3 percent, and tuition makes up 86 percent of revenue two years prior to closure. Our data also show median year-over-year enrollment declines of 58 percent among colleges that close two years later, while those that remain open experience no or smaller enrollment declines. Further, more than one-fourth of colleges that close post operating losses in at least three of the five years prior to closure—twice the rate among colleges that remain open.
However, none of these factors on its own is a reliable predictor of closure, and overall, our comparisons show substantial overlap between open and closed colleges on individual metrics. Current federal accountability metrics mainly rely on a school’s financial responsibility score to assess risk, but achieving a better understanding of a school’s risk of closure requires more than a single metric—even a composite one.
Predicting the Past
To gain additional insight, we turn to decision trees, an “if . . . then” method of exploring how variables relate to an eventual outcome and to one another, and we use a machine learning algorithm called XGBoost to mine our rich data set. Such classification algorithms are designed to work with large amounts of incomplete data and can handle complex interactions and nonlinear relationships, thus they are better suited for predicting rare events like college closures or financial distress compared with score-based accountability metrics or more traditional statistical approaches.

The focus of our analysis is the predictive accuracy of decision trees and traditional probability models rather than the individual effect of a particular factor or characteristic on the risk of closure. We limit our sample to private schools (nonprofit and for-profit) between 2002 and 2023, when the data is most consistent, and compare each model’s predictions with data on whether schools actually closed.
This is not a causal analysis, as factors and characteristics are both interconnected and correlated with closures and with one another. However, the output from our models can be used in at least two commonly accepted ways: First, to identify relative risks, similar to how Financial Responsibility Composite Scores can sort institutions into “zones of danger” and prioritize additional auditing data collection or examination accordingly; and second, as the basis for binary classifiers to serve as a warning sign, such as Heightened Cash Monitoring status in which the government may limit advanced federal aid payments in favor of reimbursement.
In comparing actual and predicted closure probabilities across all schools and models, we find that the XGBoost machine learning method significantly outperforms other approaches. In evaluating the 100 institutions identified as at highest risk of closure, 84 actually close within three years when using the XGBoost model, compared with 47 for the federal metrics model and 61 for traditional econometric methods.
We also look at the relative predictiveness of individual factors, though the fact that many variables are highly correlated with, or even functions of one another, makes any interpretation of magnitude very difficult. For example, the Financial Responsibility Composite Score is a function of several financial metrics, such as a school’s primary reserve ratio. These metrics themselves are functions of other key variables, such as cash reserves and operating margin.
However, this does not mean that we cannot provide evidence on the relative importance of different factors in terms of their effect on predictive power. We find that, reassuringly, the variables that should have a strong theoretical impact on the likelihood of closure (e.g., measures of financial distress) do, in fact, significantly increase the predictive power in our model and traditional estimates of probability. For example, a school’s Financial Responsibility Composite Score is associated with a 4 percent gain in predictive power in the XGBoost model. We also find that including recent and medium-term changes in key factors in prediction models is particularly informative. For example, recent changes in enrollment increase predictive power by 2.4 percent. This stands in contrast to assessing risk based on a benchmark or set minimum level or ratio of key metrics, and it argues for the inclusion of past trajectory as an important factor that should be considered by monitoring agencies in addition to absolute levels. This is not currently a significant part of federal accountability measurement.
Over the “Cliff”
We then turn to a critical question. How many and what types of institutions may be at risk of financial distress in the future given reasonable and extreme scenarios on enrollment, revenue, and expense trends? Still on the horizon for many schools is the so-called “demographic cliff,” which could take the form of a gradual descent in enrollment over 15 years or a sudden drop by as much as 15 percent from 2025 to 2029.
We use 2019 data as a baseline and investigate various scenarios, assuming that revenues and expenses scale with enrollment and that institutions maintain the same revenue and expense shares when this occurs. This likely results in a conservative estimate of the number of closures because of the presence of fixed costs such as facilities and tenured faculty at many institutions. We use parameters from the traditional econometric models to estimate the impacts of no change in current enrollment patterns, a one-time enrollment drop of 15 percent, and a decline in enrollment of 15 percent over five years.
If the enrollment declines that colleges have experienced since 2019 persist into the future, we can expect to see one additional closure per year, which is an increase of 2 percent over the current average. Assuming the worst-case scenario predictions come to pass and higher education experiences a 15 percent enrollment drop overnight, there could be as many as 80 additional closures in a single year. A more gradual 15 percent decrease in enrollment over five years would result in 4.6 additional closures per year (i.e., 23 closures over five years).
EdNext in your inbox
Sign up for the EdNext Weekly newsletter, and stay up to date with the Daily Digest, delivered straight to your inbox.
These simulations point to the precarious potential situation facing postsecondary education in the coming years, especially if the demographic cliff materializes in a moderate to severe fashion. While some of the estimated increases might seem small at the national level, they would be significant for the handful of localities predicted to experience college closures in a given year. It is important to reiterate that most institutions that close are somewhat smaller than average, with the median closed school enrolling a student body of about 1,389 full-time equivalent students several years prior to closure. That said, for institutions located in small towns, these colleges are still one of the largest employers in the region. This means that many (if not all) of these additional predicted closures are likely to be at the sorts of local institutions that are significant economic engines and act as community anchors.
Even ignoring the potential negative effects due to reduced training capacity in a county that loses a college, the immediate employment effects as a share of the labor force might be large. This includes not only the loss in employment coming directly from the college but also the immediate spillovers from establishments that provide goods/services to schools (most notably, retail, health care, and food services). Moreover, most students work while attending college, so any working students who are either attracted to or kept from leaving the community because of the presence of the educational institution will also contribute to local economic effects.
Discussion
With the data we now have at hand, college financial distress and closures can be predicted more accurately, and a new method using machine learning techniques is significantly more accurate than extant warning systems. This information will be extremely helpful in the months and years ahead. The “demographic cliff” has just begun.
As future research, it would be valuable to estimate the impact of college closures and severe financial stress on county-level measures of employment, wages, and population. We are particularly interested in the effect of college-induced disruptions on temporary or permanent reallocations of human capital and employment within and across local and regional economic areas.
However, our focus on the negative effects of college closures does not necessarily mean that sector observers or localities should always seek to prevent them from happening. Institutions of higher education (and particularly those in the for-profit sector) do not close randomly or without cause. If they are unable to produce outcomes that students, employers, or society at large find valuable, then they should not be artificially sustained by governments absent evidence of significant positive externalities. Extending the existence of an educational institution destined for failure may actually compound the locality’s fiscal problems if the college cannot ultimately be sustainable on its own, as well as create a negative externality on other universities that could benefit from that enrollment.
While our predictive models of college financial distress and closure may not be able to predict the eventual failure of every institution, they are certainly effective at identifying those facing the greatest risk. The methods we outline can help governments, local communities, and sector observers anticipate labor market and infrastructure disruptions if more college closings appear imminent and be better prepared to support affected community members and businesses during the transition.
Robert J. Kelchen is professor at the University of Tennessee, Knoxville. Dubravka Ritter is special adviser at the Consumer Finance Institute at the Federal Reserve Bank of Philadelphia. Douglas A. Webber is principal economist at the Board of Governors of the Federal Reserve. This article is based on a working paper published by the National Bureau of Economic Research and the Federal Reserve Bank of Philadelphia, “Predicting College Closures and Financial Distress.” The views expressed here are those of the authors and do not necessarily reflect the views of the Board of Governors of the Federal Reserve, the Federal Reserve Bank of Philadelphia, or the Federal Reserve System.
This post has been updated to remove a numerical error in the estimated percentage change of college closures under various conditions.
Suggested citation format:
Kelchen, R. J., Ritter, D., and Webber, D. A.. (2025). “Colleges Are Closing. Who Might Be Next? How machine learning can fill data gaps and help forecast the future.” Education Next, 25(4), 25 November 2025