Executive summary
Recent research demonstrates that the test score gap between relatively advantaged and relatively disadvantaged students is much higher in some school districts than it is in other districts. But measured school quality often varies dramatically within a school district, and therefore it is important to know whether individual schools differ in the relative success of advantaged and disadvantaged students. We make use of detailed, linked birth and school records in Florida to investigate the degree to which this is true.
We find that schools vary dramatically in the relative success of advantaged and disadvantaged students, and that different schools within the same school district differ substantially in terms of their advantaged-disadvantaged success gaps. In some schools, both advantaged and disadvantaged students fare especially well; while in other schools, both fare especially poorly; while in still others, one group does relatively well and the other group does relatively poorly. We investigate whether these differences across schools can be explained by differences in relative kindergarten readiness of advantaged and disadvantaged students, and we find that pre-school preparation is unlikely to explain the cross-school differences that we find. Moreover, we find that overall school advantage levels are unrelated to differences between the success levels of advantaged and disadvantaged students.
Our findings indicate that policymakers should pay much closer attention to the practices of individual schools rather than concentrating exclusively on policies and interventions typically enacted at the district level. Moreover, the cross-school differences in the relative success of advantaged and disadvantaged students argue for enacting school accountability policies that shine the light on the success of specific populations, rather than concentrating solely on overall schoolwide performance levels or gains.
Introduction
The socioeconomic differences in student performance are well-known and extensively documented. [1] As just one example: nationally, 13-year-old students whose parents are college graduates scored over four-fifths of a standard deviation higher on the mathematics assessment of the National Assessment of Educational Progress (NAEP) in 2012 than did those whose parents did not finish high school. [2] In science in 2015 the same gap was also over four-fifths of a standard deviation. [3] Likewise, the test score gap between children from rich and poor families in the United States has widened over time, and is now over a full standard deviation. [4]
Important new work by Reardon and his collaborators shows that not only test scores [5] but also racial test score gaps [6] vary dramatically across American school districts. In this latter paper, Reardon and coauthors report that while racial/ethnic test score gaps average around 0.6 standard deviations across all school districts, in some districts the gaps are almost nonexistent while in others they exceed 1.2 standard deviations. There are many potential explanations for this cross-district variation in achievement gaps, including racial differences in socioeconomic status , differences in racial/ethnic segregation, differences in school and neighborhood quality, and the like; and the evidence to date about what the leading causes of this variation are is descriptive, rather than causal. Nonetheless, the fact remains that in some places, racial/ethnic and socioeconomic differences are extraordinarily larger than in other places. These differences also correlate with important long-run economic outcomes as documented in a new work by Chetty and co-authors, where they find suggestive evidence that “quality of schools—as judged by outputs rather than inputs—plays a role in upward mobility.” [7]
But we know that there exists tremendous variation in school quality within school districts. [8] This variation leads us to suspect that there are some schools where relatively advantaged students do well but relatively disadvantaged students do poorly, other schools where the reverse is true, other schools where both relatively advantaged and relatively disadvantaged students do well, and still other schools where both relatively advantaged and relatively disadvantaged students do poorly. Furthermore, we posit that there exist considerable differences in these patterns across schools within the same school district. If this is true, then it suggests that policymakers should pay much closer attention to the practices of individual schools rather than concentrating exclusively on policies and interventions typically enacted at the district level. And this would also indicate the value of introducing school accountability policies that shine the light on specific populations of students, rather than concentrating solely on overall performance levels or gains. [9]
In this report, we make use of remarkable student-level data combining children’s birth certificate data with their educational records that the Florida Departments of Education and Health merged for the purposes of this research agenda, and calculate school-level performance of relatively advantaged and relatively disadvantaged students. [10] Being able to match children’s school records to their birth certificates provides opportunities for a much more detailed measure of socioeconomic advantage or disadvantage than can be observed from school records, which typically include only eligibility for a free or reduced price lunch. We combine information on parental education levels, marital status and family structure, and poverty status at the time of birth [11] to construct a continuous index of socioeconomic status at the time of birth. [12] We investigate the degree to which schools vary in the gap between high and low socioeconomic status students, and then see whether these differences can be explained by differences in the pre-school preparation of high and low socioeconomic status students. We next explore whether schools differ in the extent to which relatively disadvantaged students catch up to relatively advantaged students (or fall farther behind), and we investigate the degree to which the differences we observe occur within school districts, and not just between these districts. We find that large school-level differences exist along all of these dimensions that are not explained by differences in the relative school preparation of advantaged and disadvantaged students, and that very substantial differences occur across schools within the same district. Therefore, we argue that school-level policies and practices must, to some degree, cause differences in the relative success of advantaged and disadvantaged students.
How much do schools differ in the gap between high and low socioeconomic status students?
We begin by documenting the degree to which schools differ in the gap between high and low socioeconomic students (SES). For this analysis, we restrict our attention to schools that have a reasonable degree of heterogeneity—at least three students in every birth cohort who come from all four quartiles of the socioeconomic status distribution: 568 elementary schools in the state of Florida satisfy this heterogeneity criterion simultaneously in grades three and five. [13] Our outcome of interest is the third or fifth-grade score on the Florida Comprehensive Assessment Test (FCAT) [14] taken in the relevant year between 1999 and 2012, which we standardize statewide at the grade and year level to have a mean of zero and standard deviation of one.
Figure 1. School-level average test scores for students from top and bottom SES quartiles
A. Grade 3
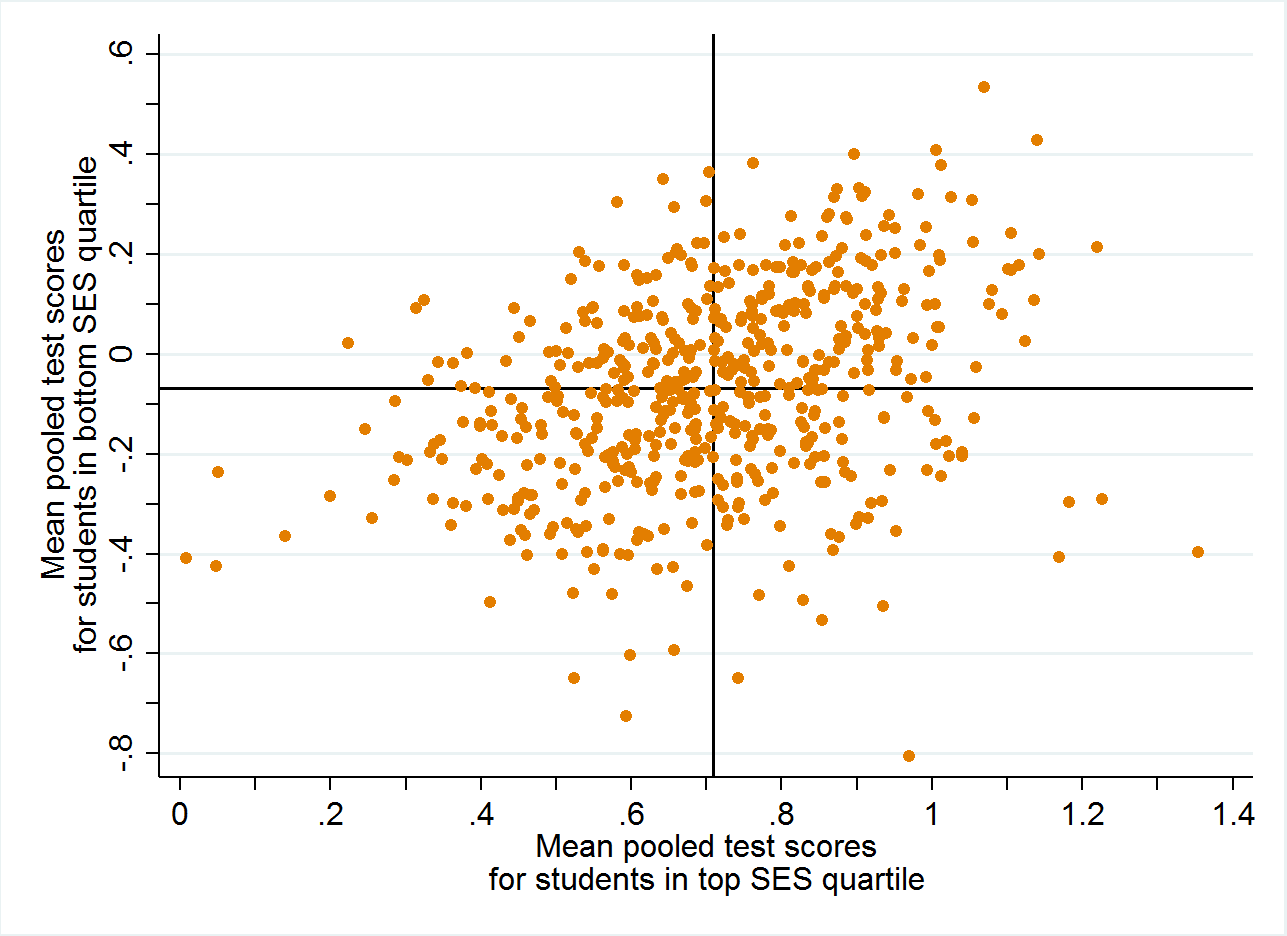
B. Grade 5
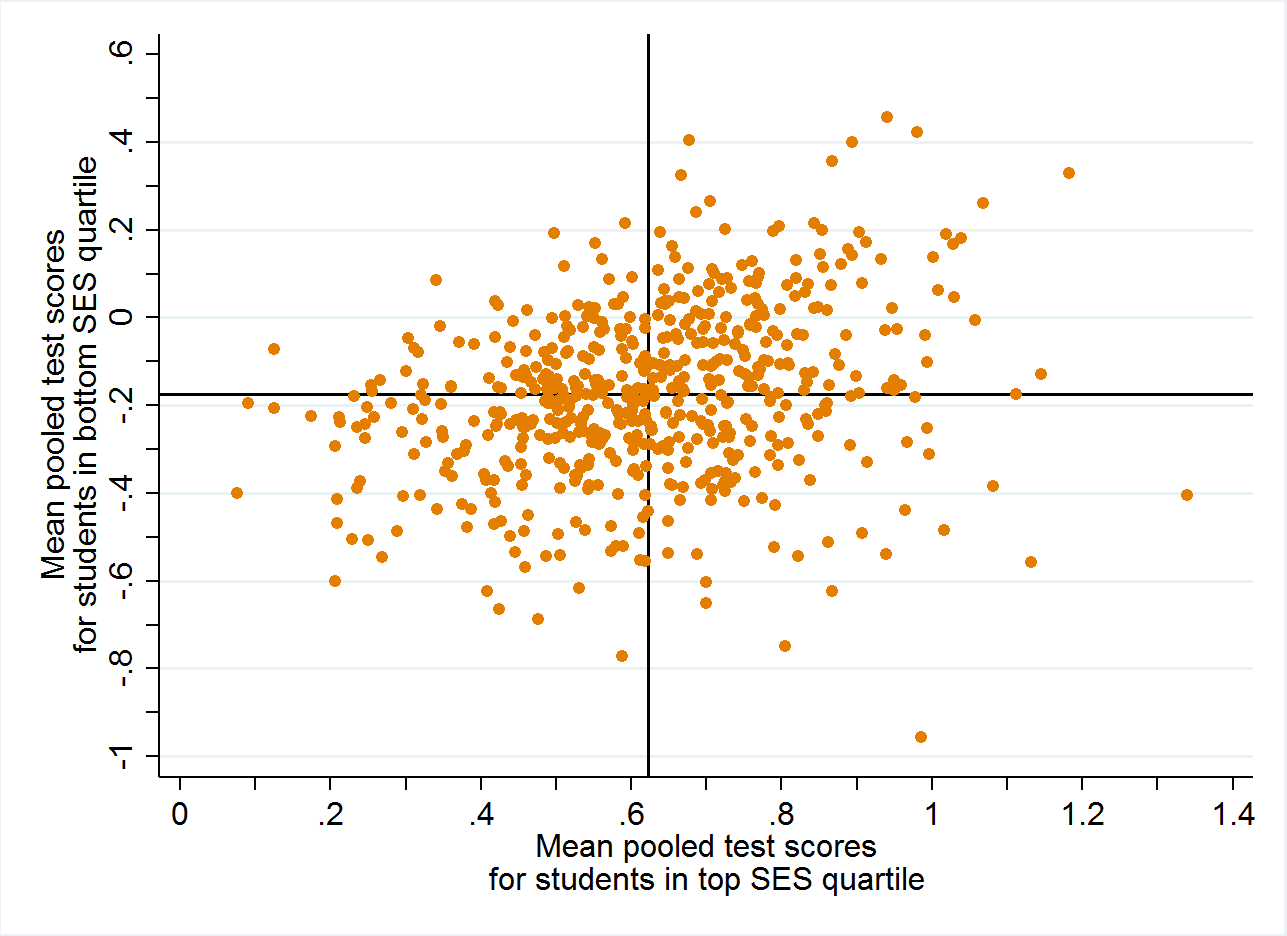
Figure 1 shows scatterplots of averaged reading and math test scores in third grade and fifth grade for students in the top quartile of the socioeconomic status distribution versus those in the bottom quartile of the socioeconomic status distribution in the same school. Each dot represents one of the 568 elementary schools in the analysis sample. The typical high-SES student in this sample scored about 0.6 to 0.7 standard deviations above the state average (depending on grade considered), while the typical low-SES student in the sample scored about 0.1 to 0.2 standard deviations below the state average. (Low-SES students in the set of heterogeneous schools we consider are more advantaged than the population of low-SES students overall, hence their average performance is only modestly below the state average. There are also relatively homogeneous schools in Florida with both higher and lower average test scores overall that we exclude from this analysis.)
The first thing that is immediately apparent is that the correlation between the performance of high-SES students and the performance of low-SES students in the same school is positive but relatively modest (0.34 and 0.27 in third and fifth grades, respectively). The four quadrants of each graph, defined based on means of both axes, represent schools where both high-SES and low-SES students perform especially well (top right), where both perform especially poorly (bottom left), where high-SES students perform especially well but low-SES students perform especially poorly (bottom right), and where low-SES students perform especially well but high-SES students perform especially poorly (top left). There are many schools in all four quadrants of these graphs including over 200 schools that are in the off-diagonal quadrants. Among schools where low-SES students score well above average (say, better than 0.2 standard deviations above the statewide average), high-SES fifth-graders in some schools score as low as 0.6 standard deviations above the statewide average, while in other schools they score as much as 1.2 standard deviations above the statewide average. Among schools where high-SES students score well above average (say, better than one standard deviation above the statewide average), low-SES fifth-graders in some schools score as low as 0.6 standard deviations below the statewide average, while in other schools they score as high as 0.3 standard deviations above the statewide average. In other words, there are schools where low-SES students score higher than do high-SES students at numerous other schools. Furthermore, while in some cases, the SES test score gap is less than 0.3 standard deviations, in other cases the gap is well above one standard deviation.
The potential role of family sorting
This large cross-school variation in SES performance gaps could be because they educate high-SES and low-SES students differently, or it could be that there are major fundamental differences across schools in the relative pre-school preparation of high-SES and low-SES students. It’s impossible to know for certain how much of these differences are due to each of these explanations, but the Florida administrative data allow us to take a first pass at this question. For five out of eight birth cohorts we consider, the state assessed all kindergarteners at the beginning of the school year to determine whether the students arrived at school ready for kindergarten. In general, around 80 percent of low-SES kindergarteners and around 94 percent of high-SES kindergarteners in these heterogeneous Florida schools are ready for kindergarten, according to the state. [15]
To take a first stab at this question, we rank the schools based on the gap between high-SES and low-SES kindergarten readiness rates for schools for which we also computed third and fifth grades averages. [16] In 537 out of 560 schools, high-SES students have higher kindergarten readiness rates than do low-SES students, and the differences between their kindergarten readiness rates are often very high. In some schools, high-SES and low-SES students enter school with nearly identical kindergarten readiness rates (or with low-SES students even having a slight advantage in the case of 18 schools). But in other schools, high-SES kindergarteners are more than 30 percentage points more likely than are low-SES kindergarteners to start school ready for kindergarten (31 schools).
Figure 2. School-level associations between SES gaps in kindergarten readiness and test scores
A. Grade 3
B. Grade 5
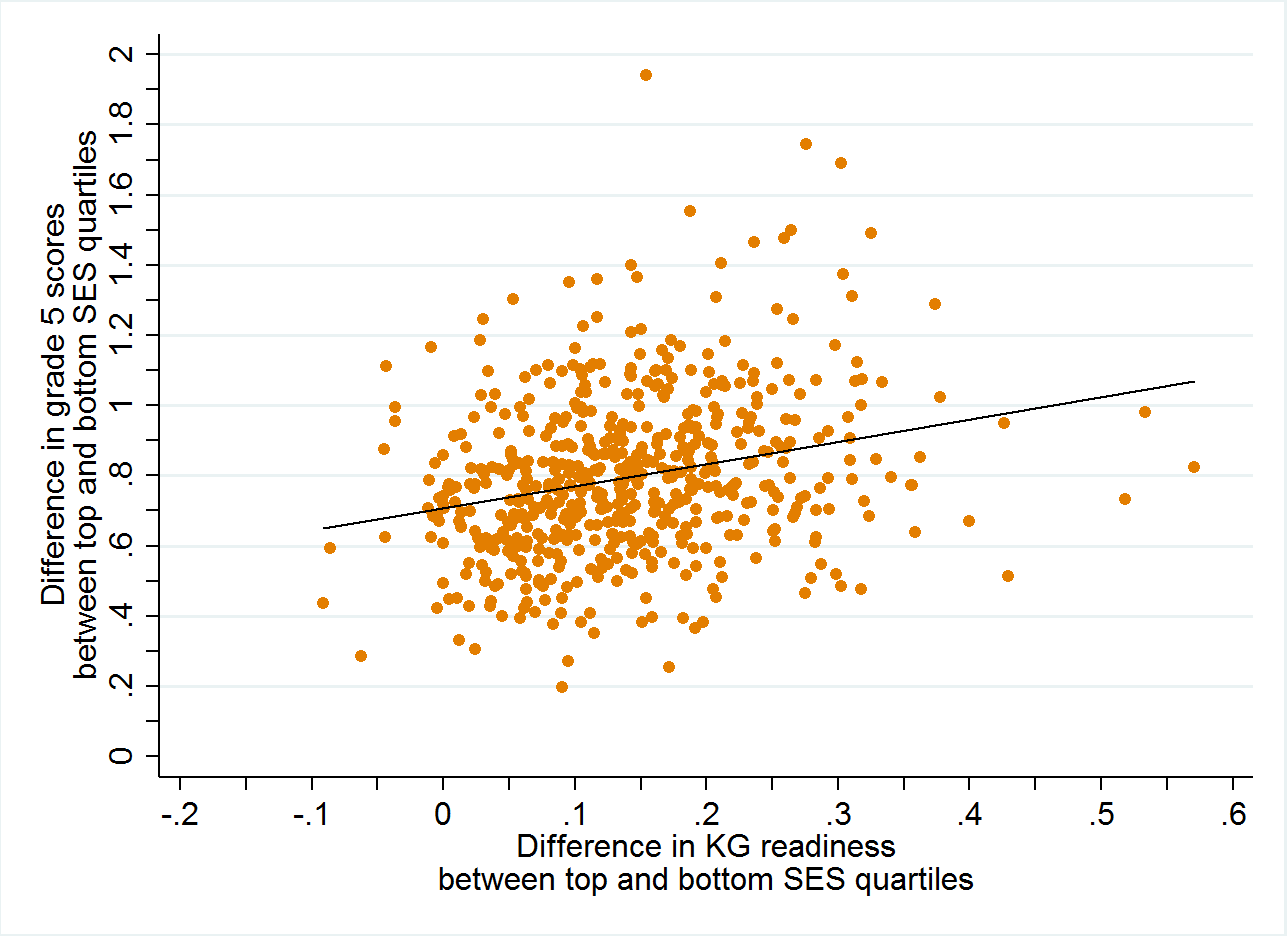
How well do these SES gaps in kindergarten readiness predict SES gaps in test scores in third or fifth grades? As can be seen in Figure 2, the schools that have larger kindergarten readiness gaps also have larger test score gaps in third and fifth grades: as the kindergarten readiness gap increases by 10 percentage points, the test score gaps increase by around 0.06 of a standard deviation. But the slopes are still far from the 45-degree line, and at every level of the kindergarten readiness gap there exists a very large variation in test score gaps. For the 20 schools with near-zero kindergarten readiness gaps, test score gaps in grades three and five range from less than two-fifths of a standard deviation to more than a full standard deviation. For the 11 schools with kindergarten readiness gaps of around 30 percentage points, test score gaps range from less than third of a standard deviation to over 1.5 standard deviations. In summary, while SES differences in readiness to start school predict SES differences in test scores a few years later, it appears to be the case that schools also vary considerably in what happens to high-SES and low-SES children between kindergarten entry and the end of elementary school.
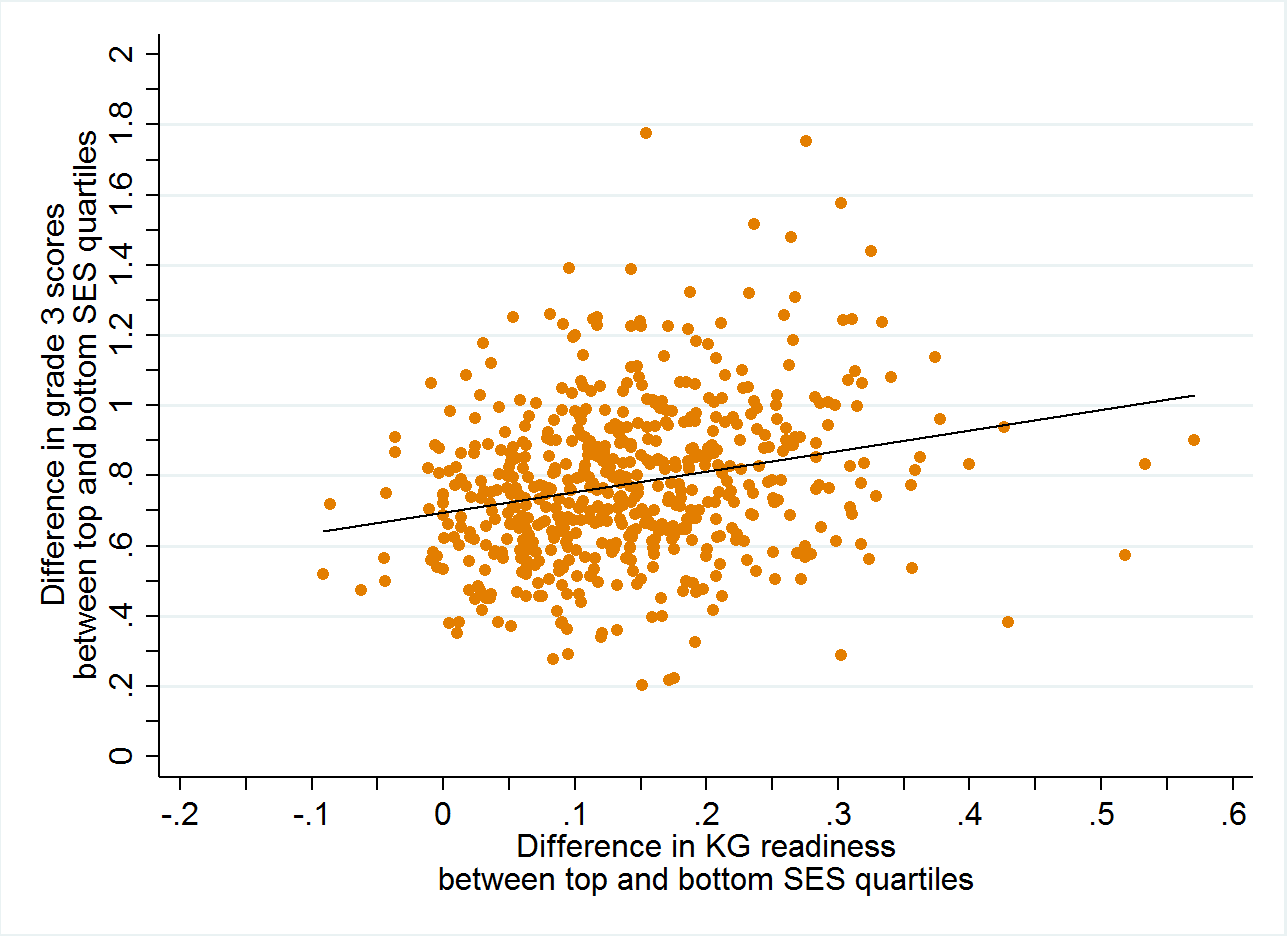
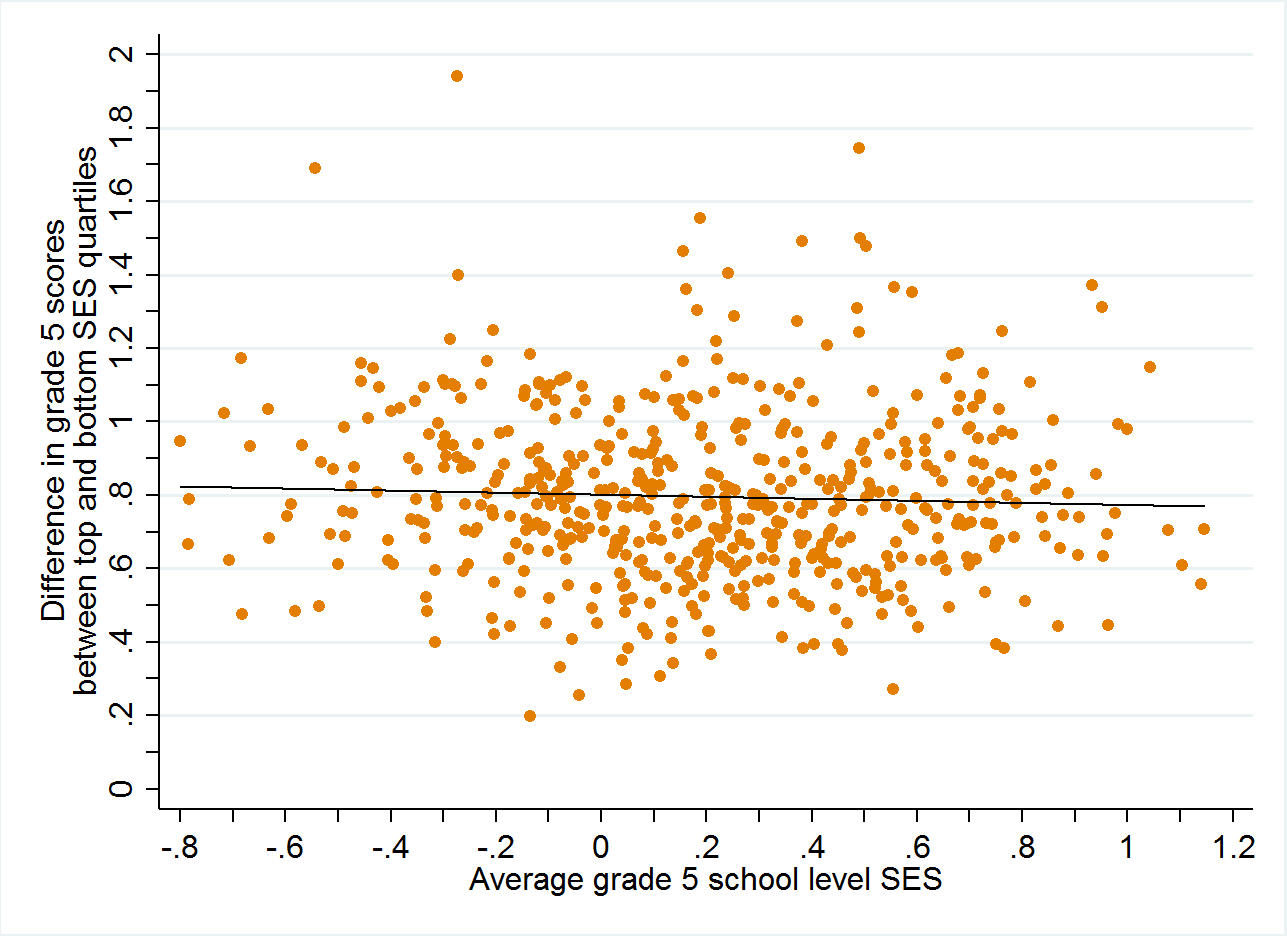
Our analysis involves only schools with at least a reasonable degree of heterogeneity. Some of these schools have many more high-SES students than low-SES students, and some of these schools have many more low-SES students than high-SES students. Do SES test score gaps differ depending on whether the school is comparatively affluent or comparatively disadvantaged? In Figure 3, we relate the average SES level of the school to the test score gap in third or fifth grade between students in the top and bottom SES quartile. We observe that there is virtually no relationship between the relative affluence of the overall student body of the school and the SES test score gap in that school: schools serving primarily high-SES students and those serving primarily low-SES students have the same average SES test score gaps (around 0.8 standard deviations) in both third and fifth grades. Across the board, there exists large within-school-type variation in school-level SES test score gaps, but almost no difference across school types (stratified by average student body SES) in the SES test score gap. (We note that we’ve also investigated whether school-level SES is related to the SES gap in kindergarten readiness rates, and, as with test scores, there is no relationship between the SES of the overall student body of a school and the SES gap in kindergarten readiness.) Therefore, it does not appear that school SES levels per se affect the degree to which high-SES and low-SES students differ in either their academic performance or their kindergarten readiness probabilities.
Figure 3. School-level associations between average SES of the school and the gap in test scores between top and bottom SES quartile students
A. Grade 3
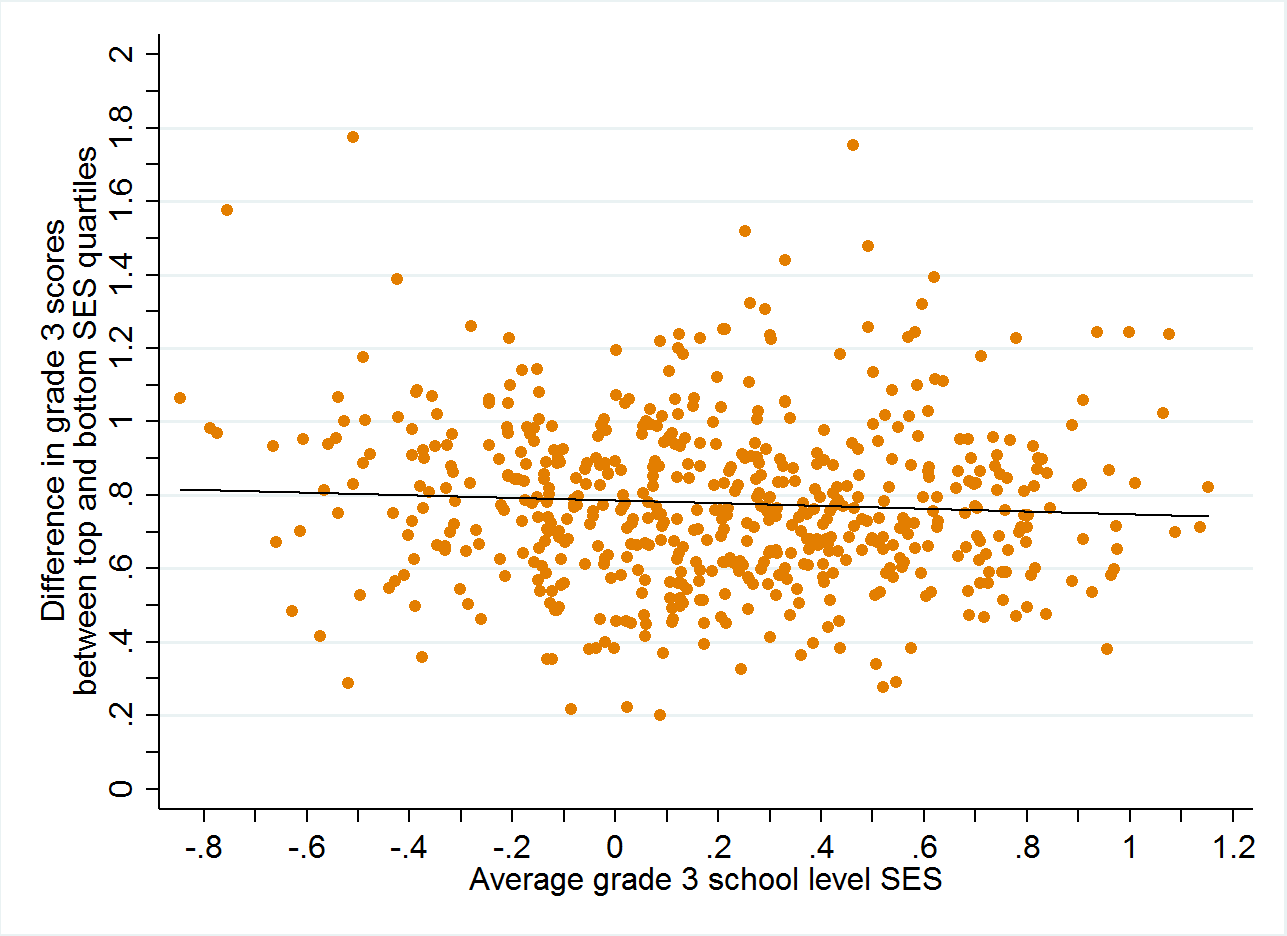
B. Grade 5
Schools vary in their rates of socioeconomic convergence or divergence
In Figure 4 we plot the relationship between test score growth between third grade (the first statewide tested grade in Florida) and fifth grade (typically the last year of elementary school in Florida) for high-SES students and low-SES students. The horizontal axis reflects the mean test score growth for high-SES students and the vertical axis reflects the mean test score growth for low-SES students. We can interpret a positive value as representing the typical student in an SES group in a school gaining ground relative to their statewide peers, and a negative value as representing the typical student in an SES group in a school losing ground relative to their statewide peers. Incidentally, the typical relative growth from third to fifth grade in this set of heterogeneous schools is modestly negative (around 0.1 standard deviations).
Figure 4. School-level associations in test score growth for students from top and bottom SES quartiles
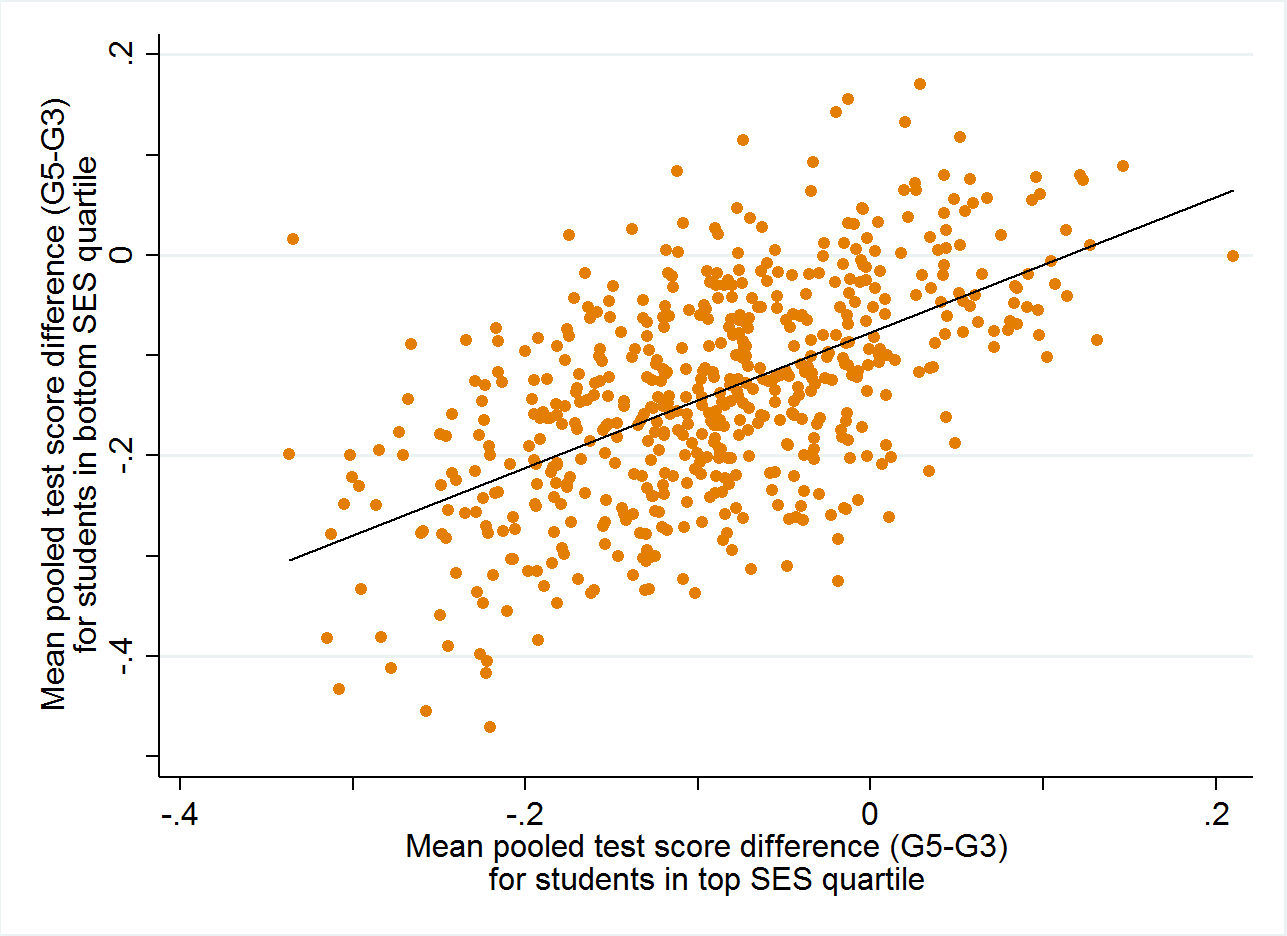
The first thing that is clear from this graph is that schools where high-SES students grow faster also tend to be the schools where low-SES students grow faster, and vice versa. But at the same time, we continue to see wide variation in the average growth of low-SES students for any given level of high-SES student growth, or the reverse. Among schools where high-SES students fall back around 0.2 standard deviations relative to the state average between third and fifth grades, there are some schools where low-SES students lose only around 0.1 standard deviation of relative ground, and others where low-SES students lose nearly 0.4 standard deviations of relative ground. Among schools where high-SES students neither gain relative ground nor fall back relative to their statewide peers, there are some schools where low-SES students gain around 0.05 standard deviation of relative ground, and others where low-SES students lose 0.24 standard deviations of relative ground.
Just because one group gains ground on another in a school between third and fifth grades doesn’t necessarily mean that the school is consistently serving one set of students better than another. It could, for instance, be a manifestation of regression to the mean: a negative relative gain between third and fifth grades could be reflective of particularly strong third grade test scores, and a positive relative gain between third and fifth grades could be reflective of particularly weak third grade test scores. It might also be a function of schools serving different students better or worse at different grade levels. And, of course, it’s also possible that schools that serve one group better than another in the early elementary grades also serve the same group better than the other in the later elementary grades. Nevertheless, this finding indicates that policymakers would be well-served to take a close look at the specific practices of individual schools in an attempt to uncover the reasons why test scores converge in some schools and diverge in others.
Is the variation within or between school districts?
Finally, we evaluate the degree to which differences in relative test score performance (or growth) of high-SES versus low-SES students are largely occurring within school districts or across school districts. The answer to this question would help us to understand more about where to shine the light regarding whether school district-level policies and practices or school-level policies and practices are likely to be more influential in serving as relative elevators for high-SES or low-SES students.
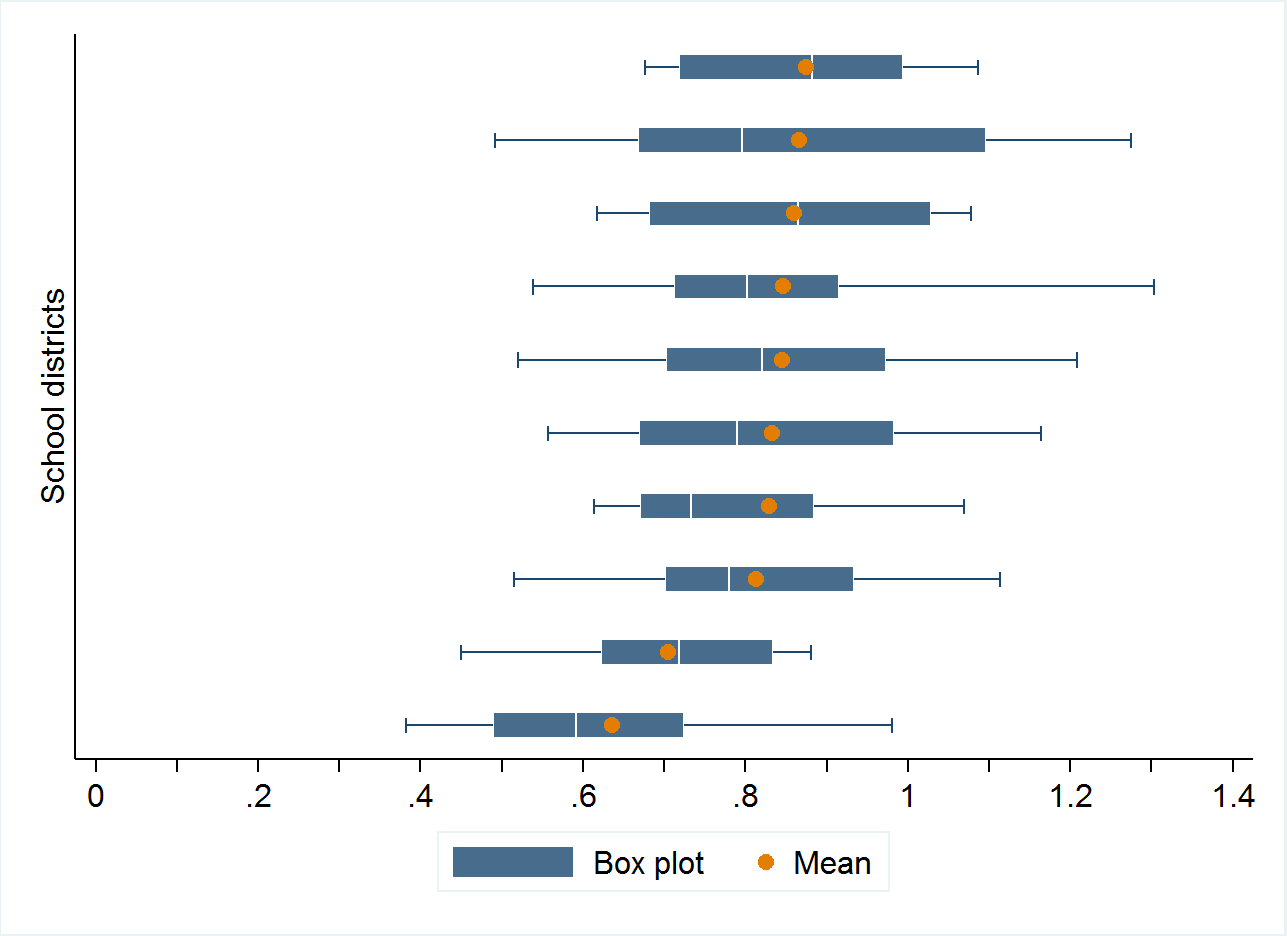
As a first step in this process, we look separately at the ten largest school districts in the state. (Florida has 67 county-level school districts, and the ten largest districts all rank within the 47 largest school districts in the United States, in terms of student enrollment, including seven of the 25 largest.) In Figure 5 we present box plots of the distribution of the high-low-SES third grade test score gap, the high-low-SES fifth grade test score gap, and the high-low-SES test score growth gap for each of these ten school districts. The solid part of the box plot represents a district’s interquartile range (that is, the range of values from the district’s 25th percentile to the district’s 75th percentile) and the line represents the range of values from the district’s 10th percentile to the district’s 90th percentile. In order to avoid identifying individual school districts, we present the ten school districts in the order of their average high-low-SES gap in the relevant graph (denoted by the orange circles); the school districts are consequently in different orders in each graph.
It’s apparent from Figure 5 that school districts vary considerably in their test performance gaps between high-SES and low-SES students; this is unsurprising given the large cross-district variation in racial/ethnic gaps found in the work by Reardon and colleagues mentioned in the introduction. [17] Among the ten largest school districts in Florida, the average high-low-SES test score gap ranges from about 0.6 standard deviations to about 0.9 standard deviations in third and fifth grades, and the high-low-SES gap in test score growth ranges from zero to nearly one-tenth of a standard deviation. In few cases, the 25th percentile of this gap in one district is approximately identical to the 75th percentile in another district.
Figure 5. Variation in SES gaps in test scores and test score growth in the ten largest Florida school districts
A. Grade 3
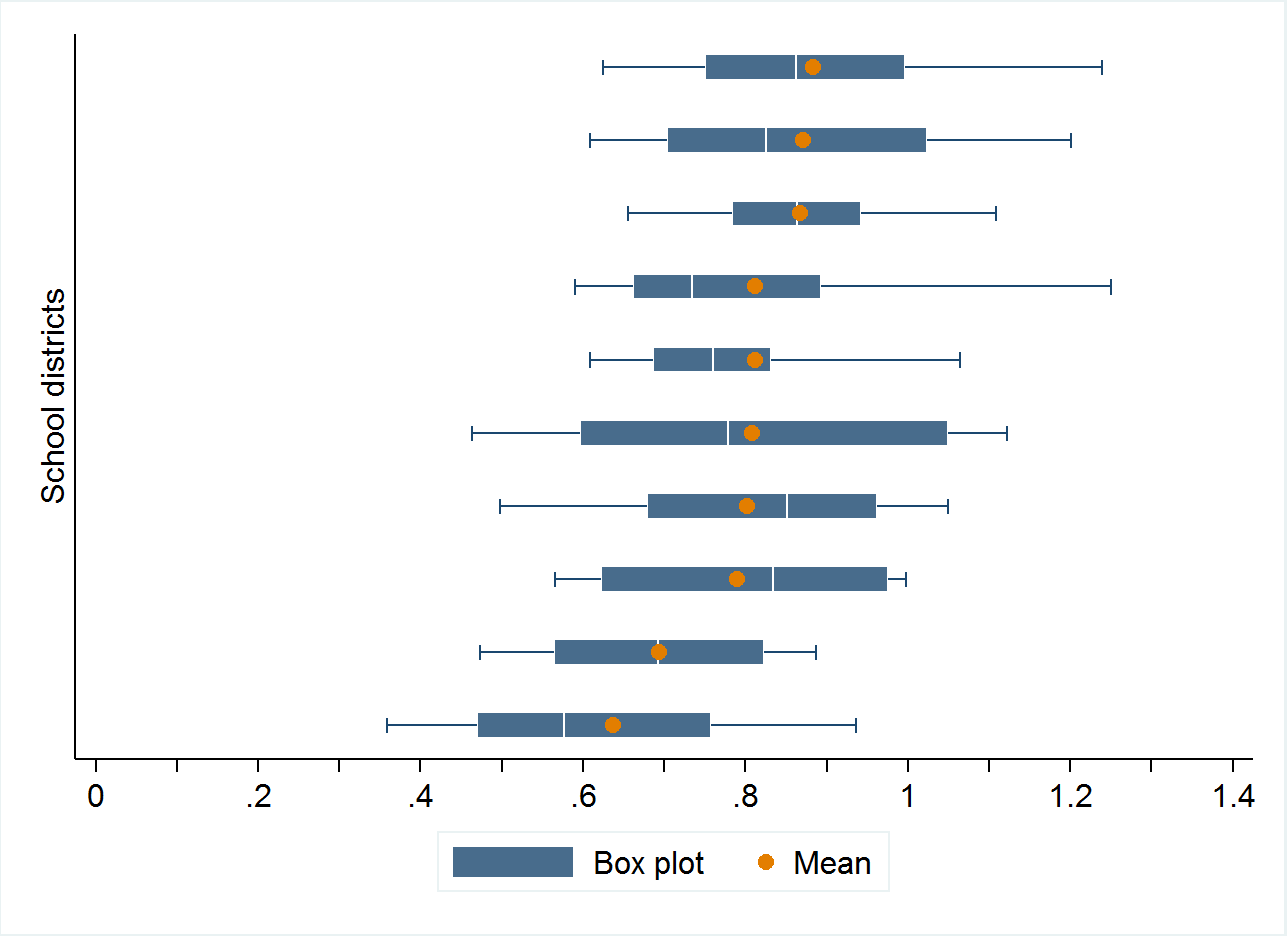
B. Grade 5
C. Growth between grades 3 and 5
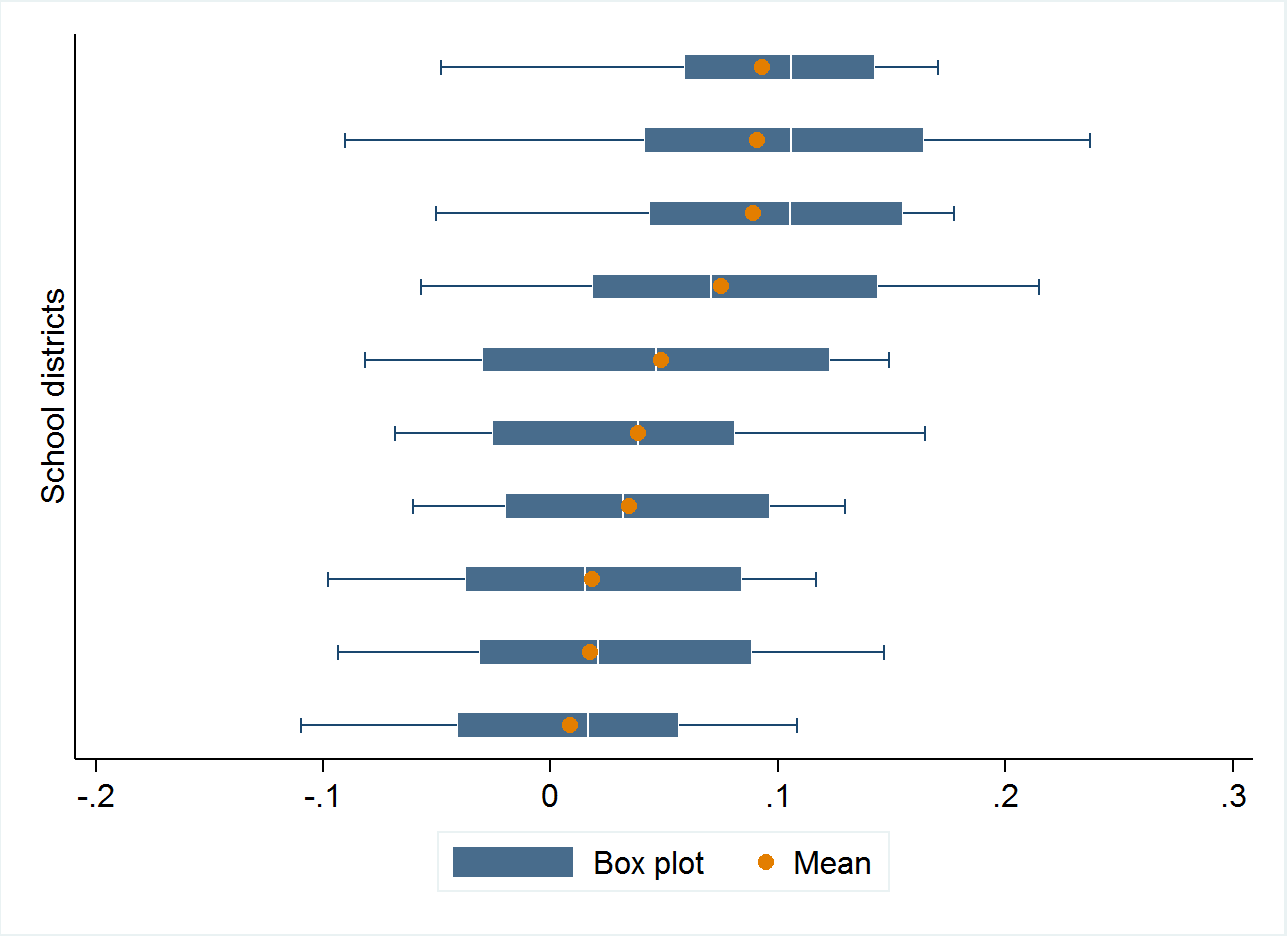
But mean gaps across districts miss very large differences within districts. Among each of the ten largest districts in Florida, the observed range between the 10th and 90th percentile of the SES test score gap is larger than the observed difference between the school district with the largest SES gap and the school district with the smallest SES gap (among the ten largest school districts in Florida, that is). Even the observed range between the 25th and 75th percentile of the SES test score gap within a school district is typically in the same ballpark as the between-district range. These findings make clear that while we can learn a tremendous amount by comparing school districts in terms of their racial, ethnic, or socioeconomic gaps in test scores, there is a large degree of variation within school districts in their outcome gaps as well.
Conclusions and implications
This analysis makes clear that large differences in the performance of high-SES students and low-SES students in the same schools do exist; that these apparent gaps are not simply reflective of gaps in preparation; and that while the variation across school districts is substantial, the variation within school districts may be even larger (at least among the largest districts in Florida).
These findings provide substantial lessons for policymakers. For one, they have implications for the design and implementation of school accountability policies. Some schools fare especially well with both advantaged and disadvantaged students, others fare especially poorly with both groups, while others still fare well with one group and poorly with another. The pattern of differences across schools, across and within school districts, argues for enacting school accountability policies that hold schools accountable for the success of specific populations, rather than concentrating solely on overall schoolwide performance levels or gains.
These findings also highlight the importance of taking a close look at the practices and instructional policies at the school level, rather than solely concentrating on district-level policies. Differences in kindergarten readiness certainly explain a large amount of the performance differences between advantaged and disadvantaged students—at the population level and at the school level—but there appear to be major differences at the school level that contribute to the relative success of advantaged and disadvantaged students.
Meanwhile, the gap between advantaged and disadvantaged students is remarkably similar between schools with comparatively affluent student bodies and those with comparatively disadvantaged student bodies. This indicates that while there are many reasons why school districts and states might want to seek to integrate relatively advantaged and relatively disadvantaged students within the same school, it appears unlikely that a policy goal of reducing the test score gap between students in these groups will be realized through further socioeconomic integration (at least once there gets to be the degree of socioeconomic integration necessary to be part of this study to begin with). We caution, however, that our analysis is correlational rather than causal, so these patterns of findings are merely suggestive that socioeconomic test score gaps persist relatively unabated regardless of the degree of socioeconomic integration at the school level, and are far from definitive.
— David Figlio and Krzysztof Karbownik
 David Figlio is professor of education, social policy and economics at Northwestern University and research associate at the National Bureau of Economic Research. Krzysztof Karbownik is a postdoctoral researcher at the Institute for Policy Research, Northwestern University.
This post originally appeared as part of Evidence Speaks, a weekly series of reports and notes by a standing panel of researchers under the editorship of Russ Whitehurst.
The author(s) were not paid by any entity outside of Brookings to write this particular article and did not receive financial support from or serve in a leadership position with any entity whose political or financial interests could be affected by this article.
Notes:
1. One prominent recent meta-analysis of the extant literature is Selcuk Sirin, “Socioeconomic Status and Academic Achievement: A Meta-Analytic Review of Research,” Review of Educational Research, 2005.
2. National Assessment of Educational Progress mathematics data reported in Digest of Education Statistics, 2015 Table 222.85, National Center for Education Statistics.
3. Digest of Education Statistics, 2015, Table 223.10.
4. Sean Reardon, “The Widening Academic Achievement Gap Between the Rich and the Poor: New Evidence and Possible Explanations,” in Greg Duncan and Richard Murnane, eds., Whither Opportunity? Rising Inequality, Schools, and Children’s Life Chances, Russell Sage Foundation, 2011.
5. Erin Fahle and Sean Reardon, “How Much do Test Scores Vary Among School Districts? New Estimates Using Population Data, 2009-2013,” Stanford University, CEPA working paper 17-02, January 2017.
6. Sean Reardon, Demetra Kalogrides, and Ken Shores, “The Geography of Racial/Ethnic Test Score Gaps,” Stanford University, CEPA working paper 16-10, January 2017 version.
7. Raj Chetty, Nathaniel Hendren, Patrick Kline, and Emmanuel Saez, “Where is the Land of Opportunity? The Geography of Intergenerational Mobility in the United States,” Quarterly Journal of Economics, 129(4):1553-1623, 2014
8. As one piece of evidence, when states assign explicit grades to their schools, there is often exceptional variation in state-assigned grades within school districts. In Florida, for example, in 33 out of the 44 school districts where at least 10 schools were graded in 2017, at least one school received a grade of A while at least one other school received a grade of D or F. In all but one of the 11 remaining districts, there was a three-grade difference between the highest-graded and lowest-graded school in the district.
9. As one example, Florida’s school grading system has placed extra weight on the performance improvements of historically low-performing students in its school grade calculations since 2002.
10. We analyze records for children born in Florida between 1994 and 2001 and observed in the test score records in both third and fifth grades – a total of 872,893 children. We focus on these children so that we can observe relationships between socioeconomic status and student outcomes at different points in time. Third grade is the first time students are tested statewide, and fifth grade is generally the end of elementary school, so these two grades represents the bookends of ages in which we observe performance statewide in elementary school.
11. We use Medicaid-funded births as a proxy for poverty status at the time of birth.
12. For more details about the way in which we construct this index, see David Autor, David Figlio, Krzysztof Karbownik, Jeffrey Roth, and Melanie Wasserman, “Family Disadvantage and the Gender Gap in Behavioral and Educational Outcomes,” NBER working paper 22267, May 2016.
13. These schools—around one-quarter of the overall set of elementary schools statewide—are relatively unusual. They tend to have higher average socioeconomic status students than the population of elementary schools overall. Students in the schools in this sample are more likely to have married parents (70.7 percent versus 61.7 percent statewide with third grade test scores), less likely to have fathers absent at the time of birth (9.8 percent versus 15.2 percent statewide), less likely to have Medicaid-funded births (a proxy for poverty at the time of birth, 37.7 percent versus 48.8 percent statewide), and have relatively better educated mothers (13.1 years of maternal education at the time of the child’s birth, versus 12.5 years on average statewide). These schools also have fewer black students than the statewide average, with 15.7 percent black students versus 24.9 percent statewide for students with third grade test scores.
14. The FCAT is universally administered statewide and is used by the state to evaluate students and schools.
15. In the years at the beginning of our time period, the state had its own statewide kindergarten assessment. After a few years of statewide assessment recorded in the administrative data, the state introduced the DIBELS kindergarten readiness assessment. For more details about the kindergarten readiness assessment in the present data, see David Figlio, Jonathan Guryan, Krzysztof Karbownik, and Jeffrey Roth, “The Effects of Poor Neonatal Health on Children’s Cognitive Development,” NBER working paper 18846, February 2013. (The final version of the paper in the American Economic Review does not include the kindergarten readiness outcome, due to space constraints.) Statewide, 77.5 percent of low-SES students and 94.6 percent of high-SES students are ready for kindergarten.
16. Eight schools that we include in grades three and five analyses do not run kindergarten classes, and thus we exclude them from the analysis. This leaves us with 560 schools for this analysis.