
Executive summary
We make use of matched birth-school administrative data from Florida, coupled with an extensive survey of instructional policies and practices, to observe which policies and practices are associated with improved test performance for relatively advantaged students in a school, for relatively disadvantaged students in a school, for both, and for neither.
We consider twelve policies and practices from this survey that are neither highly common nor challenging to implement, and we find that in seven of twelve cases, the policy/practice is associated with much different fifth grade test score outcomes for advantaged versus disadvantaged students. For example, sponsoring Saturday school is associated with significant increases in test performance for disadvantaged students but reductions in test performance for advantaged students. While these are not causal estimates of relationships – to do so would require either an experiment or a natural experiment – they do make clear that school policies and practices that are associated with better outcomes for some students might be associated with worse outcomes for others.
Our bottom line is this: Policies and practices that might be successful overall could actually help one group of students while harming another, so care should be taken when evaluating them to see whether they are benefiting all, some, or no students – and whom they are benefiting. Schools might do a better job ensuring success for all students the more they investigate how the practices are affecting different groups of students. We hope that this analysis will shed some light on possible policies and practices to be evaluated more rigorously, and to encourage a careful analysis of heterogeneous effects of policies and practices.
Introduction
The socio-economic differences in student performance are well-known and extensively documented. [1] As just one example: Nationally, 13-year-old students whose parents are college graduates scored over four-fifths of a standard deviation higher on the mathematics assessment of the National Assessment of Educational Progress (NAEP) in 2012 than did those whose parents did not finish high school. [2] In science in 2015 the same gap was also over four-fifths of a standard deviation. [3] Likewise, the test score gap between children from rich and poor families in the United States has widened over time, and is now over a full standard deviation. [4]
Important recent work by Reardon and his collaborators shows that not only test scores [5] but also racial test score gaps [6] vary dramatically across American school districts. In this latter paper, Reardon and coauthors report that while racial/ethnic test score gaps average around 0.6 standard deviations across all school districts, in some districts the gaps are almost nonexistent while in others they exceed 1.2 standard deviations. There are many potential explanations for this cross-district variation in achievement gaps, including racial differences in socio-economic status, differences in racial/ethnic segregation, differences in school and neighborhood quality, and the like, and the evidence to date about the leading causes of this variation is descriptive, rather than causal. Nonetheless, the fact remains that in some places, racial/ethnic and socio-economic differences are extraordinarily larger than in other places. These differences also correlate with important long-run economic outcomes as documented in a new work by Chetty and co-authors, where they find suggestive evidence that “quality of schools – as judged by outputs rather than inputs – plays a role in upward mobility”. [7]
Moreover, there exists tremendous variation in school quality within school districts. [8] And there are some schools where relatively advantaged students do well but relatively disadvantaged students do poorly, other schools where the reverse is true, other schools where both relatively advantaged and relatively disadvantaged students do well, and still other schools where both relatively advantaged and relatively disadvantaged students do poorly. [9] Furthermore, there exist considerable differences in these patterns across schools within the same school district. [10]
The next logical question is to ask whether there are any school-level policies or practices that predict whether schools do particularly well with relatively advantaged students, with relatively disadvantaged students, with both, or with neither. To study this question persuasively, there should either be an experiment that randomly assigns students to schools that have different sets of policies or practices, or a “natural experiment” caused by policy changes or a policy roll-out that affects some schools or areas differently from others. But a good first step is to correlate these performance measures with a broad and varied list of school policies and practices to observe the emerging patterns. Such an analysis would then help researchers and policymakers to shine a light on individual policies and practices using more rigorous empirical methods. This is the purpose of the present report.
In this report, we make use of a remarkable survey carried out during the 1999-2000, 2001-02, and 2003-04 school years by Figlio, Goldhaber, Hannaway, and Rouse. Figlio and colleagues attempted to survey the complete population of school leaders in Florida regarding a wide range of school policies and practices, and achieved response rates between 70 and 80 percent in every survey round. [11] We match these survey responses to a student-level dataset that combines children’s birth certificate data with their educational records. The Florida Departments of Education and Health merged the birth and education records for the purposes of this research agenda.
Being able to match children’s school records to their birth certificates provides new opportunities for a much more detailed measure of socio-economic advantage or disadvantage than can be typically observed from school records. We combine information on parental education levels, maternal age, marital status, and poverty status at the time of birth [12] to construct a continuous index of socio-economic status at the time of birth. [13] Using this information, we calculate school-level performance of relatively advantaged and relatively disadvantaged students. [14] Because the children in the matched dataset were born between 1994 and 2001, the school leader survey response years correspond to when the students in the matched administrative data were either in elementary school or just before they entered elementary school.
Using this matched dataset, we investigate the degree to which twelve popular school-level policies and practices correlate with the relative success of disadvantaged students, advantaged students, both, or neither.
School-level policies and practices considered
The surveys carried out by Figlio, Goldhaber, Hannaway, and Rouse include dozens of questions. For this initial investigation of the data, we limit ourselves to the twelve questions that have considerable variation in the frequency with which the policy is carried out. Many policies and practices are implemented by almost all schools and many policies and practices are implemented by very few schools, and we want to look at policies and practices that are more in the middle of the spectrum. [15] Because our outcome of interest is the fifth-grade statewide test score, we limit the analysis to elementary schools.
While the surveys inquired about many policies and practices that were highly-frequently cited or rarely cited, the policies and practices identified in the surveys that are in the middle of the frequency spectrum are:
(1) Does this school use monetary rewards (including one-time cash bonus) to reward teacher performance, independent of incentives used by the district?
(2) Does this school use block scheduling?
(3) Does this school make use of subject matter specialist teachers?
(4) Does this school use looping (to keep students with teachers and classmates across years)?
(5) Does this school use multi-age classrooms?
(6) Does this school assign an aide to low-performing teachers to improve their performance?
(7) Does this school provide sponsored summer school?
(8) Does this school extend the school year beyond what the state and district require?
(9) Does this school sponsor Saturday school?
(10) Does this school require summer school for grade advancement of low-performing students?
(11) Does this school require before-school or after-school tutoring of low-performing students?
In addition, we constructed a twelfth school policy/practice regarding the required number of days of teacher professional development; to be parallel with these dichotomous outcomes, we measure whether the school is above or below the median in the number of required professional development days for teachers.
The survey intentionally did not define these terms, but rather left it to respondents to answer the questions as they saw fit.
Analysis and results
In this analysis, we look separately at students who are relatively advantaged (top quartile of the socio-economic distribution) and relatively disadvantaged (bottom quartile of the socio-economic distribution), and focus on schools that are reasonably heterogeneous – those with at least ten observed students in each socio-economic quartile. (All told, 1,223 public elementary schools have at least ten observed students in each socio-economic quartile across observed school years.) We first regress fifth grade statewide test scores on a series of background variables (race, ethnicity, country of birth, gender, gestational age, birth weight, and month and year of birth) and then compare these “residualized” test scores across schools that either offer the policy/practice or that do not, and do so separately for relatively disadvantaged and relatively advantaged students. Because test scores differ greatly across race-ethnicity-nativity groups, and these characteristics are permanent for each child, we prefer to “net out” any variation in achievement that does not come from either socio-economic status or school policies. While we recognize that racial and ethnic composition are themselves also indicators of socio-economic status and affluence, we want to try to get at the portion of socio-economic status that is not associated with race and ethnicity. We estimate and present a multivariable analysis, in which we consider a “horse race” between the twelve policies and practices; sometimes schools carry out two or more of these policies and practices, and we want to see which seem to be more strongly associated with test scores for different groups of students. [16]
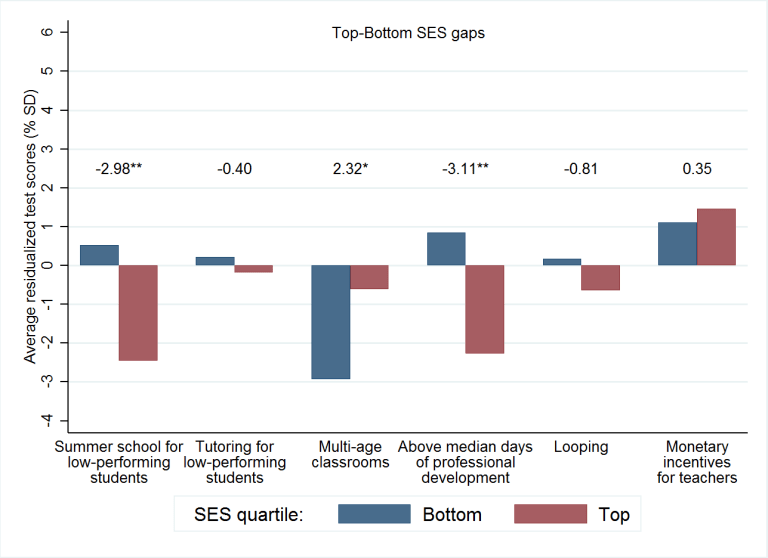
The figures below present the fifth grade test score differences between schools that offer the policy/practice and those that do not, estimated separately for relatively disadvantaged and relatively advantaged students. The blue bars (to the left of each pair of bars) present the estimated relationships for the least advantaged students, and the red bars (to the right of each pair of bars) present the estimated relationships for the most advantaged students. We arrange the policies and practices based on the average socio-economic status of the schools that adopt these practices; schools educating the least advantaged students are the most likely to sponsor Saturday school, while schools educating the most advantaged students are the most likely to offer monetary incentives for teachers. To make the graphs more readable, we split the policies and practices into two groups of six, with the policies and practices that tend to be adopted by relatively disadvantaged schools presented in the first graph and the policies and practices that tend to be adopted by relatively advantaged schools presented in the second graph. Test scores are standardized and residualized as noted above, and we present estimated differences in terms of percentage of a standard deviation.
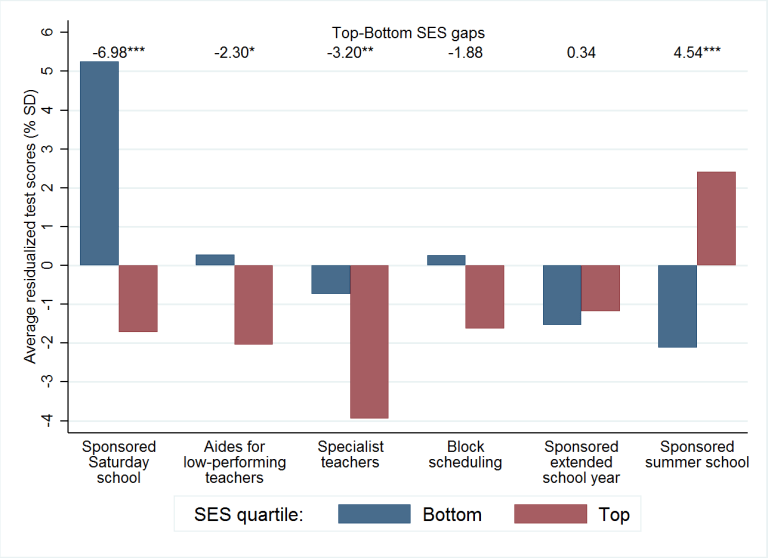
To help to interpret these figures, consider the practice at the very left of the top graph – whether a school sponsors Saturday school, the practice most disproportionately associated with schools educating disadvantaged students. We find that the most disadvantaged students have 5.3 percent of a standard deviation higher test scores in schools that sponsor Saturday school than in schools that do not. But the difference in test scores for the most advantaged students goes the other way: The most advantaged students have 1.7 percent of a standard deviation lower test scores in schools that sponsor Saturday school than in schools that do not. As a consequence, the difference between the estimated relationships for disadvantaged versus advantaged students are 7 percent of a standard deviation.
This comparison makes clear that it might be challenging for a school to achieve high performance for all students – at least with the same set of policies and practices. While we are not estimating a causal relationship, and there are many unobserved reasons why a school might choose to sponsor Saturday school, it’s still the case that we observe that disadvantaged students’ test scores are higher in schools that sponsor Saturday school, while advantaged students’ test scores are lower in these same schools.
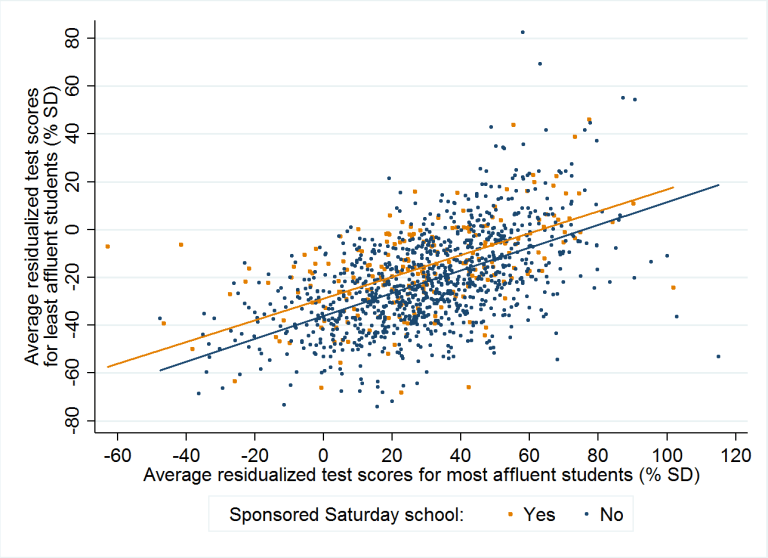
Indeed, consider the following scatterplot, in which each point represents a different Florida elementary school. We plot test scores for the most advantaged students on the horizontal axis and those for the least advantaged students on the vertical axis. The blue dots are schools that do not sponsor Saturday school, and the orange dots are schools that do. In general, schools that do better with one group of students do better with the other group of students. But for any given level of advantaged-student test scores, relatively disadvantaged students do better in schools that sponsor Saturday school than in those that do not.
Looking more broadly, we observe that among the range of policies and practices that we consider, the policies and practices are associated with statistically significantly different associations for advantaged and disadvantaged students in seven of the twelve cases. In five of these seven instances, the estimated associations go in opposite directions for advantaged and disadvantaged students, whereas for the sixth and seventh (subject matter specialist teachers and multi-age classrooms) the estimated associations are negative for both advantaged and disadvantaged students, but much larger (and statistically distinct from zero) for advantaged students in the case of subject-matter specialist teachers, and for disadvantaged students in the case of multi-age classrooms. There are other cases where there are differences: Required summer school for low-performers is associated with worse test scores for advantaged students, but not for disadvantaged students; aides for low-performing teachers and more professional development are associated with worse test scores for advantaged students but better for disadvantaged students; and sponsored summer school seems to have a positive relationship for advantaged students and a negative one for disadvantaged students. [17]
Occasionally, we do see a practice that is associated with improved (or reduced) test scores for both advantaged and disadvantaged students: In addition to the cases of multi-age classrooms and subject-matter specialist teachers in elementary school, the estimated relationships point in the same direction (but are not statistically distinct from zero) in the case of extended school year (negative association for both). Again, while these are not causal estimates of relationships – to do so would require either an experiment or a natural experiment, as mentioned above – they do make clear that school policies and practices that are associated with better outcomes for some students might be associated with worse outcomes for others.
Conclusion
Our bottom line is this: Policies and practices that might be successful overall could actually help one group of students while harming another, so care should be taken when evaluating them to see whether they are benefiting all, some, or no students – and whom they are benefiting. Schools might do a better job ensuring success for all students the more they investigate how the practices are affecting different groups of students. We hope that this analysis will shed some light on possible policies and practices to be evaluated more rigorously, and to encourage a careful analysis of heterogeneous effects of policies and practices.
— David Figlio and Krzysztof Karbownik
 David Figlio is Dean of the School of Education and Social Policy at Northwestern University and research associate at the National Bureau of Economic Research. Krzysztof Karbownik is a postdoctoral researcher at the Institute for Policy Research, Northwestern University.
This post originally appeared as part of Evidence Speaks, a weekly series of reports and notes by a standing panel of researchers under the editorship of Russ Whitehurst.
The author(s) were not paid by any entity outside of Brookings to write this particular article and did not receive financial support from or serve in a leadership position with any entity whose political or financial interests could be affected by this article.
Notes:
1. One prominent recent meta-analysis of the extant literature is Selcuk Sirin, “Socioeconomic Status and Academic Achievement: A Meta-Analytic Review of Research”, Review of Educational Research, 2005.
2. National Assessment of Educational Progress mathematics data reported in Digest of Education Statistics, 2015 Table 222.85, National Center for Education Statistics.
3. Digest of Education Statistics, 2015, Table 223.10.
4. Sean Reardon, “The Widening Academic Achievement Gap Between the Rich and the Poor: New Evidence and Possible Explanations”, in Greg Duncan and Richard Murnane, eds., Whither Opportunity? Rising Inequality, Schools, and Children’s Life Chances, Russell Sage Foundation, 2011.
5. Erin Fahle and Sean Reardon, “How Much do Test Scores Vary Among School Districts? New Estimates Using Population Data, 2009-2013”, Stanford University, CEPA working paper 17-02, January 2017.
6. Sean Reardon, Demetra Kalogrides, and Ken Shores, “The Geography of Racial/Ethnic Test Score Gaps”, Stanford University, CEPA working paper 16-10, January 2017 version.
7. Raj Chetty, Nathaniel Hendren, Patrick Kline, and Emmanuel Saez, “Where is the Land of Opportunity? The Geography of Intergenerational Mobility in the United States”, Quarterly Journal of Economics, 129(4):1553-1623, 2014.
8. As one piece of evidence, when states assign explicit grades to their schools, there is often exceptional variation in state-assigned grades within school districts. In Florida, for example, in 33 out of the 44 school districts where at least 10 schools were graded in 2017, at least one school received a grade of A while at least one other school received a grade of D or F. In all but one of the 11 remaining districts, there was a three-grade difference between the highest-graded and lowest-graded school in the district.
9. David Figlio and Krzysztof Karbownik, “Some Schools Much Better than Others at Closing Achievement Gaps Between Their Advantaged and Disadvantaged Students”, Brookings Institution, Evidence Speaks, July 20, 2017.
10. Figlio and Karbownik, ibid.
11. The first major paper published using the wide range of these data was Cecilia Rouse, Jane Hannaway, Dan Goldhaber, and David Figlio, “Feeling the Florida Heat? How Low-Performing Schools Respond to Voucher and Accountability Pressure”, American Economic Journal: Economic Policy 5(2): 251-281, 2013.
12. We use Medicaid-funded births as a proxy for poverty status at the time of birth.
13. For more details about the way in which we construct this index, see David Autor, David Figlio, Krzysztof Karbownik, Jeffrey Roth, and Melanie Wasserman, “Family Disadvantage and the Gender Gap in Behavioral and Educational Outcomes”, NBER working paper 22267, May 2016.
14. We analyze records for children born in Florida between 1994 and 2001 and observed in the test score records in fifth grade – a total of 920,078 children. The final sample, limiting also to only top and bottom quartile of SES, comprises of 327,549 children.
15. We code the policies and practices as “yes” if the school ever reports having them in place.
16. We have also estimated these models on a case-by-case basis, and we find highly similar results. We report the “horse race” multivariable analysis so that we can differentiate between policies and practices that are correlated with one another. As expected, the univariable correlations are generally larger in magnitude.
17. This is not due to collinearity between sponsoring summer school and requiring summer school, because the same relative patters are apparent when the relationships are estimated separately.