By Margaret Raymond and the CREDO team
From the moment of birth, Americans have a fascination with seeing how we measure up. Apgar scores assess the vitality of a newborn. Growth charts compare a youngster to his peers. Report cards throughout school equate a student’s academic performance with a grading standard. Professional athletes, corporations, and communities all have rating systems designed to reveal their quality. We are a nation obsessed with the story told in numbers. And we seem to take on faith that the rating systems behind the scores are on target.
The quality of our public schools has been measured in innumerable ways, and stakeholders may draw on any number of sources for rankings to support a particular agenda. Each winter, Education Week issues Quality Counts as a magazine supplement to its weekly newspaper. Report cards track and compare state education policies and outcomes in six areas: chance-for-success; K–12 achievement; standards, assessments, and accountability; transitions and alignment; the teaching profession; and school finance. For example, the grade for transitions and alignment is based on 14 indicators related to “early-childhood education, college readiness, and economy and workforce,” while the school finance indicators measure spending patterns and resource distribution. Through these report cards, Education Week purports to “offer a comprehensive state-by-state analysis of key indicators of student success.”
The Quality Counts rankings are eagerly anticipated, thoroughly perused, and widely quoted. After the 2009 rankings were released, the Maryland State Department of Education issued a press release touting the state’s place at “the top of the list in Education Week’s tally, just ahead of Massachusetts.” Florida governor Charlie Crist celebrated the news that Education Week’s Quality Counts rated Florida’s schools 10th in the nation, based on its average rating across the six categories that comprise the analysis. Are Florida’s schools among the nation’s best? It depends on what you measure. By November of 2009, two lawsuits had been filed in Florida claiming the state was failing to provide high-quality education to its students. The plaintiffs claimed the state has low graduation rates, frequent school violence, and low levels of education spending and teacher pay compared to other states.
 The rankings are also frequently misunderstood. Among the most widely cited of the Quality Counts ranking schemes is the Chance-for-Success Index (CFSI), which attempts to measure a state’s capacity for helping young people succeed. Here’s what Education Week’s Editorial Projects in Education (EPE) Research Center has to say about the index:
The Chance-for-Success Index captures the critical role that education plays at all stages of an individual’s life, with a particular focus on state-to-state differences in opportunities. While early foundations and the returns in the labor market from a quality education are important elements of success, we find that the school years consistently trump those factors. In every state, indicators associated with participation and performance in formal schooling constitute the largest source of points awarded in this category, and help explain much of the disparity between the highest- and lowest-ranked states.
The CFSI’s stated aim is to show the role that education plays as a student moves from childhood through the formal K–12 system and into the workforce, but then the rest of the description is fairly ambiguous. Many states nonetheless interpret the index as a simple measure of school quality. Maryland came in fifth in 2009, with a B+. The Maryland schools’ press release cited above reported that the state “ranked among the nation’s leaders in ‘Chance for Success,’ which looks at how well graduates achieve beyond high school.” Of course, some states choose not to emphasize their CFSI score. For example, the New Mexico education department’s January 2009 press release led with its number-two rank and A grade for transition and alignment policies and buried in the middle its 51st-place CFSI grade of D+.
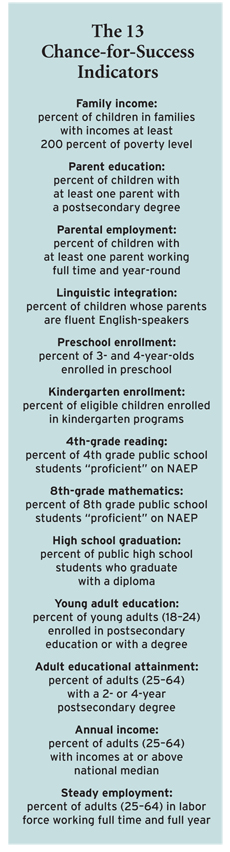
Does CFSI measure the school system’s contributions to achievement beyond high school? It’s hard to say. Most of its components, described as “key facets of education spanning stages from childhood to adulthood,” are a grab bag of demographic characteristics. The index combines indicators related to family background, wealth, education levels, and employment with schooling measures, including kindergarten enrollment and selected National Assessment of Educational Progress (NAEP) test scores. The 13 components of success are identified in the sidebar. Not all of these have a clear relationship to postsecondary success, and several are beyond the control of state policymakers.
Consider the parental employment indicator and its role in an index that is updated annually or even every other year. Short-run trends in parental employment may not have any impact on the overall quality of a state’s education system; even the direction of possible influence is unclear. Parents who see how difficult it is to get and retain employment without education may stress the value of school completion, but it is also conceivable that underemployed parents may seek to accelerate their children’s entry into the labor force, even at the expense of their education. A similar problem exists with annual income: many factors outside of education quality influence the vitality of a state economy. Even if strong gains in public education are realized, it will be years before the effects are reflected in adults’ annual income. Income trends over the next few years will have little or nothing to do with current levels of education quality.
A Different Approach
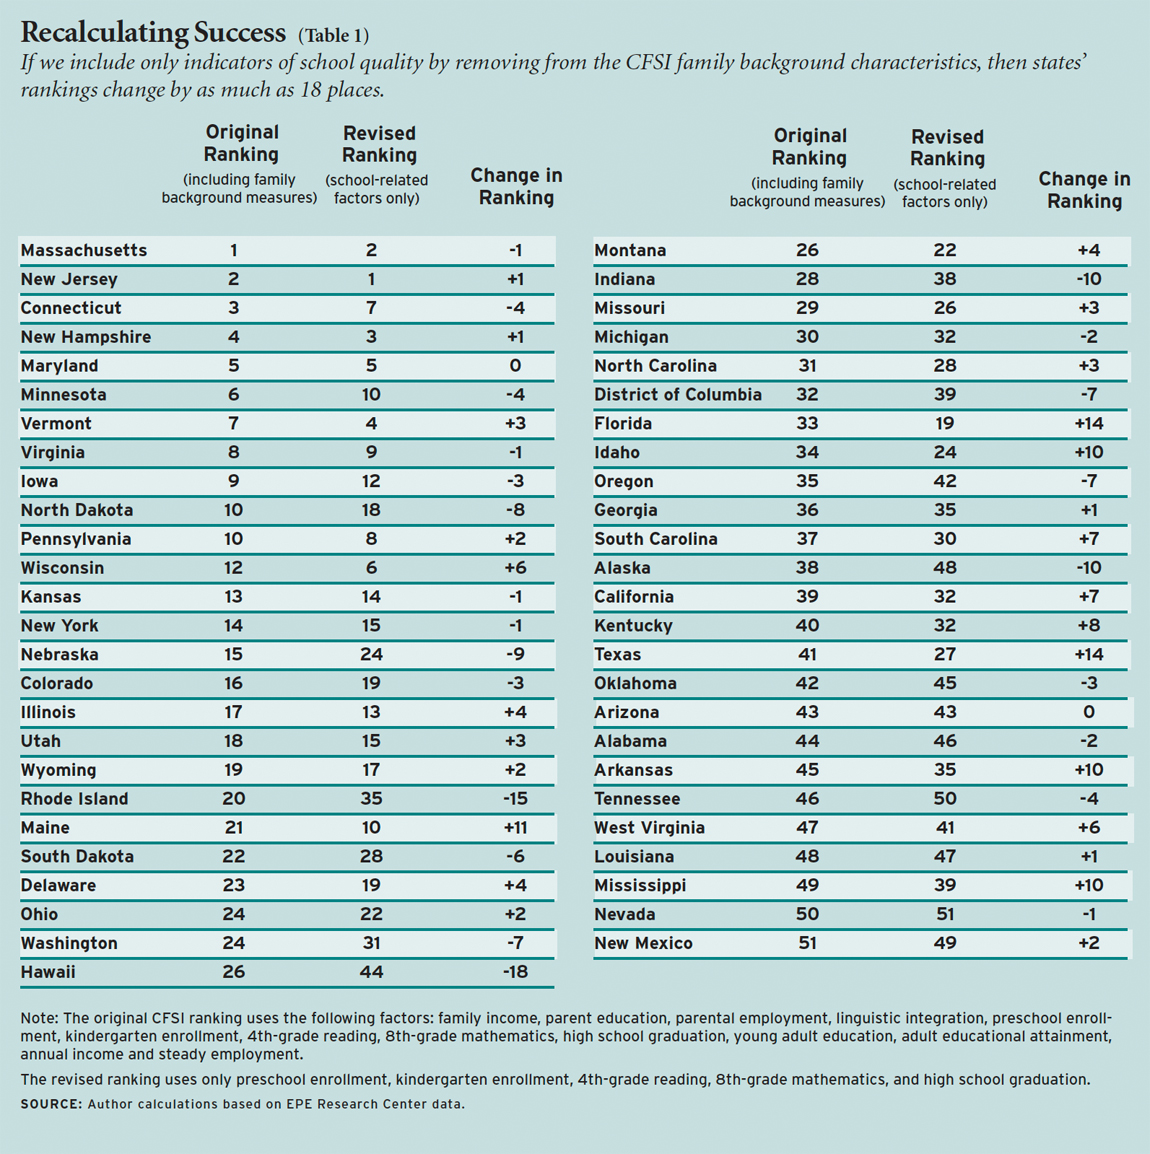
Absent a sound theory of action, it is easy to go on a data spree. As seen in the CFSI, the more the merrier. As an experiment, we reconstructed the Chance-for-Success Index. First, we selected a clear standard for our index: we defined “success” as the percentage of young adults, aged 18 to 24, who are productively engaged in postsecondary endeavors (pursuing a college degree, active military service, or full-time employment). We limited the indicators to only those factors for which a reasonable empirical base of evidence shows an association between the indicator and our definition of success and that are plausibly under the control of education policymakers. Five indicators have a clear bearing on education outcomes: preschool enrollment, kindergarten enrollment, 4th-grade reading, 8th-grade mathematics, and high school graduation. Using the same source data as the 2009 CFSI and giving each factor equal weight, we computed new averages for each state and compared the new rankings to the originals.
Our results show marked divergence from the CFSI rankings (see Table 1). Only Maryland (5th) and Arizona (43rd) retained their rankings, although four of the top five stayed within that band. Looking down the list, however, 34 states moved 3 or more places, 21 shifted by 5 or more places, and 13 states moved by 8 or more places. Does our revised index precisely rank states’ public education systems? Probably not. The ideal index would be one that measured how well states and schools did, given their demography. Still, this exercise shows how sensitive the CFSI is to the choice of indicators.
Removing family background characteristics from the index changes states’ rankings substantially. The states that drop the most in the revised rankings are Hawaii, Rhode Island, Indiana, Alaska, Nebraska, and North Dakota. The states that gain the most are Florida, Texas, Maine, Idaho, Arkansas, and Mississippi, mostly poor, rural states.
Is the CFSI largely a measure of parental education? We looked at where the states would fall if we ranked them by individual family background variables. The variable that by itself provides a ranking with the closest fit to the CFSI is percentage of children with at least one parent with a postsecondary degree (parent education). Ranked by that measure alone, only 8 states would move by 8 or more places from their positions in the CFSI. Indicators of family income and adult education levels also produce rankings similar to the CFSI. Ranking states by either the percentage of children in families with incomes at least 200 percent of poverty level (the family income indicator) or the percentage of adults (25–64) with a 2- or 4-year postsecondary degree (adult educational attainment), only 15 states would move 8 or more places.
Measuring the Measure
Report cards must meet a number of conditions if they are to be reliable. First, they need to clearly define the condition or result being examined. None of the descriptions provided by the CFSI editors accomplish this—they never reveal exactly what they take the “chance for success” to be, asserting only that some states provide better opportunities than others. Explained the EPE Research Center’s director, “a child’s life prospects depend greatly on where he or she lives.”
Second, the indicators that are employed should have direct and proven association with the outcome being measured. The CFSI’s current approach mixes inputs such as demographics with outcomes like academic results to arrive at a single score. The result is a tautology: success is the sum of the parts; the parts are by default the components of success.
The editors of Quality Counts gather and report a variety of measures that reflect current education and policy performance across all 50 states and the District of Columbia and, through comparison, encourage states to take actions that would lead to improvements in their ratings. Nowhere do the Quality Counts editors show how or why the Chance-for-Success Index is a good predictor of success. Instead, they provide statistics that divert attention away from the things that actually do matter, such as high-quality teaching, a good range of school options, and success in early elementary schools. There is risk in including variables that have no real impact on the result being studied. States may view the results as motivators to improvement, and ineffective indicators may lead to ineffective attention and investment. Narrowing the scope of the Chance-for-Success Index to factors both causally related to school achievement and under the control of state education officials or school districts would improve its value and deliver the right signals to states.
CREDO at Stanford University supports education organizations and policymakers in using research and program evaluation to assess the performance of education initiatives. The team is led by Margaret Raymond and includes Kenneth Surratt, Devora Davis, Edward Cremata, Emily Peltason, Meghan Cotter Mazzola, Kathleen Dickey, and Rosemary Brock.
This article appeared in the Spring 2010 issue of Education Next. Suggested citation format:
Raymond, M. (2010). Quality Counts and the Chance-for-Success Index: Narrowing its scope to factors schools can control would give the measure greater value. Education Next, 10(2), 77-80.