
A central component of federal education law for more than 15 years is that states must report student achievement for every school both overall and for subgroups of students, including those from economically disadvantaged families. Several states are leading the way in developing and using innovative methods for identifying disadvantaged students, and other states would do well to follow them.
Until recently, low-income students have almost always been identified as those eligible for the federal free or reduced-price lunch (FRL) program. [1] But FRL eligibility is quickly becoming useless for both research and policy, as I documented in a 2016 Evidence Speaks report.
About one in five schools now offer free lunches to all of their students under a “community eligibility” provision. [2] The result is that the share of U.S. students receiving a subsidized lunch has climbed from less than 35 percent in 1990 to more than 50 percent today, even though the share of children who grow up in low-income families has not changed over this period.
This trend presents immediate challenges to states as they implement new school accountability systems under the Every Student Succeeds Act (EESA). [3] Continuing to use FRL to identify economically disadvantaged students in community eligibility schools means either saying that all students are eligible, which would violate the spirit of ESSA, or surveying families to find out who would be eligible on an individual basis, which would be costly and burdensome. Census data could be used to estimate the level of disadvantage in a school’s surrounding neighborhood, but cannot be linked to achievement data at the student level.
Fortunately, several states are leading the way in adopting new methods for identifying disadvantaged students based on their families’ participation in programs such as the Supplemental Nutrition Assistance Program (SNAP), Temporary Assistance for Needy Families (TANF), Medicaid, and the foster care system.
Districts have been making such linkages to “directly certify” students for FRL without them having to complete a form. States assuming the responsibility for this linkage reduces burden on districts and ensures more uniformity. Most important for ESSA purposes, it means that states including Delaware, Massachusetts, New Mexico, Tennessee, and Washington, DC will be able to shine a light on the achievement of disadvantaged students even in schools where all students get a free lunch. [4]
Washington, DC makes for an instructive case study, as it is an urban school system where two-thirds of students attend schools where free lunch is provided to everyone. DC’s new accountability system will identify economically disadvantaged students as those who are “at-risk” by virtue of participation in SNAP or TANF or being in foster care or homeless. [5]
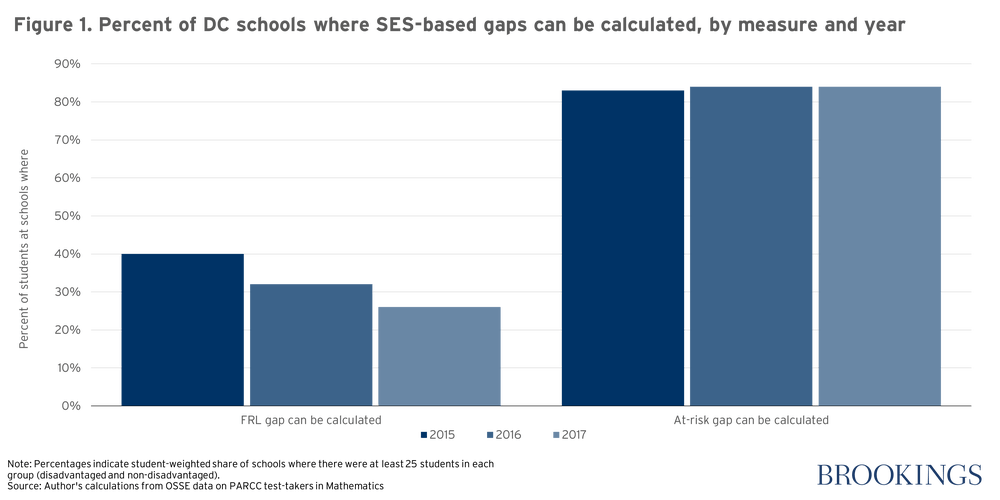
Shifting to this new definition dramatically increases the number of schools for which achievement gaps can be calculated (Figure 1). [6] In 2017, only 26 percent of students attended schools where the achievement of FRL students could be compared to non-FRL students, down from 40 percent two years earlier. But more than 80 percent of students attend schools where the scores of at-risk students can be compared to other students. [7]
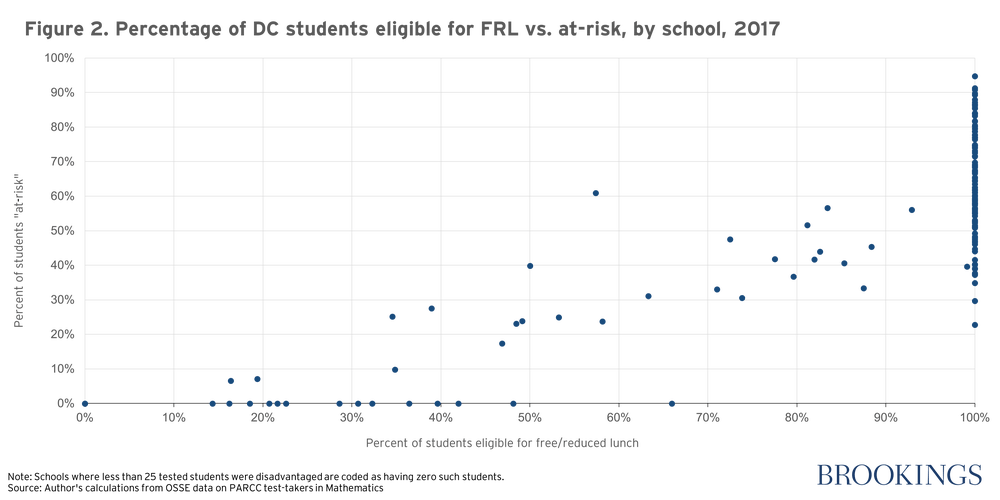
School-by-school data, reported in Figure 2, show that the at-risk percentage varies dramatically among the two-thirds of schools where all students receive a free lunch, from 23 percent to 95 percent. By collecting the data underlying the at-risk designation, DC makes it possible to both measure achievement gaps within these schools and understand differences in contexts across these schools.
Transitioning to a new measure of economic disadvantage will entail some challenges. There is surely some cost of making data linkages across systems maintained by different agencies, and it has to be done using methods that ensure the privacy and confidentiality of student records. States may need to make upgrades to their data systems, or amend laws or regulations that restrict how data can be used.
But it is clear that FRL participation is no longer a viable option for identifying economically disadvantaged students, especially in areas with significant low-income populations. All states should follow the lead of DC, Delaware, Massachusetts, New Mexico, and Tennessee by putting in place linked data systems that enable them both to identify students who should get a free lunch—regardless of whether they fill out a form—and to shine a bright light on how much these students are learning.
— Matthew M. Chingos
 Matthew M. Chingos is director of the Urban Institute’s Education Policy Program.
This post originally appeared as part of Evidence Speaks, a weekly series of reports and notes by a standing panel of researchers under the editorship of Russ Whitehurst.
The author(s) were not paid by any entity outside of Brookings to write this particular article and did not receive financial support from or serve in a leadership position with any entity whose political or financial interests could be affected by this article.
Notes:
1. The FRL program is available to families who earn less than 185 percent of the federal poverty level (currently $46,435 for a family of four; https://www.gpo.gov/fdsys/pkg/FR-2018-05-08/pdf/2018-09679.pdf
2. http://www.frac.org/community-eligibility
3. For an overview of ESSA, see https://www.edweek.org/ew/issues/every-student-succeeds-act/index.html. For an implementation timeline, see https://ccsso.org/sites/default/files/2018-02/ESSA%20Implementation%20Timeline%20Resource.pdf.
4. https://www.ecs.org/wp-content/uploads/State-Information-Request_Low-Socio-Economic-Status.pdf, http://www.doe.mass.edu/infoservices/data/ed.html, and https://osse.dc.gov/sites/default/files/dc/sites/osse/publication/attachments/Accountability%20System%20Meeting%2C%20July%2012%2C%202017.pdf
5. In high schools, at-risk students also include those who are at least one year older than the expected age for their grade.
6. The statistics I report are based on data from the PARCC math test (i.e. they are based on test-takers, not all students), but I obtain similar results using data from the English language arts test. In all analyses, I exclude schools where less than 67 students were tested and, for simplicity, refer to the number of tested students as “student enrollment” (even though not all students are tested; e.g., PK-5 schools only test students in grades 3-5).
7. DC only reports the number of FRL and at-risk students if there are at least 25. For consistency, Figure 1 counts the number of schools (weighted by student enrollment) where there are at least 25 disadvantaged students and at least 25 non-disadvantaged students.