
Executive Summary
Policymakers and the media use the Pell Grant program to measure the share of low-income students enrolled at specific colleges and universities, but the reliability of this measure is rarely scrutinized. This paper discusses several key limitations of the “Pell proxy” that could affect its reliability, especially when used to draw conclusions about admissions and recruiting practices at particular universities or categories of schools. Generally, the proxy undercounts low-income students enrolled in institutions of higher education while counting middle-income students as low-income. Using the Pell proxy to compare trends is even more problematic because Pell Grant take-up rates and eligibility rules have changed markedly over time. These trends may have affected the makeup of Pell Grant students differently by institution, reducing the reliability of the Pell proxy further.
This analysis also illustrates that when Congress increases the maximum Pell Grant faster than the rate of inflation—which it tends to do over long periods of time—more middle-income families qualify for the program. This eligibility design increases the cost of the program more than would be necessary to increase grant size for only the lowest income students. Policymakers could adopt a number of changes to the program to address this issue and better target aid.
Introduction
Few statistics in higher education policy receive as much attention as the share of students from low-income families who attend different types of colleges and universities, particularly the most elite and selective institutions. Policymakers and the media use this enrollment information to assess the economic diversity of the student body at individual universities, whether universities are effectively recruiting low-income students, and how access to college has changed over time for students in different income groups. Yet hardly any of these analyses use actual information about a student’s income. Instead, they categorize all students who received a federal Pell Grant as low-income.
For example, U.S. News reports the “economic diversity” of what it ranks as the top 25 national universities using the share of undergraduates at each school who received Pell Grants. U.S. News is careful to acknowledge that this is not a perfect measure of low-income status but goes on to say, “Many experts say that Pell figures are the best available gauge of how many low-income undergraduates there are on a given campus.”[1] Similarly, researchers at the Georgetown University Center on Education and the Workforce, in a report about Pell Grant recipients at selective universities, write that “the vast majority of Pell Grant recipients come from families with very low incomes—about 73 percent have an annual income of $30,000 or less,” which is why the share of students receiving Pell Grants “has become a widely-acknowledged proxy for how many low-income students a college or university is serving.”[2]
Similar to these two examples, many analyses that use Pell Grants to count low-income students warn that the measure is not perfect. Even so, they rarely provide much information on what the limitations of using this “Pell proxy” actually are. Some researchers have, however, uncovered flaws in the Pell proxy. In 2005, Jeffery Tebbs and Sarah Turner of the University of Virginia concluded that the limitations were severe enough to make it “inappropriate” for assessing enrollment policies and trends.[3]
This paper builds on and updates that work. It aims to provide more information on the Pell proxy’s limitations by making the proxy the focus rather than the means of the analysis. The paper first provides a brief explanation of the Pell Grant program, and discusses the available data on recipients and low-income student enrollments. It then illustrates some of the limitations of the Pell proxy through an analysis of five iterations of the National Postsecondary Student Aid Study (NPSAS) spanning the years 1995-96 to 2011-12, the most recent year for which data are available. The NPSAS is a nationally-representative dataset of college enrollees, and unlike other datasets, it includes information on student incomes and financial aid awards.
The analysis reveals several key limitations of the Pell proxy that could affect its reliability, especially when it is used to draw conclusions about admissions and recruiting practices at particular universities or categories of schools. Generally, the proxy undercounts low-income students enrolled in institutions of higher education while counting some middle-income students as low-income. Using the Pell proxy to compare trends is even more problematic because Pell Grant take-up rates and eligibility rules have changed markedly over time. These trends may have affected the makeup of Pell Grant recipients and the share of students of students who receive Pell Grants differently at each institution, further reducing reliability of the Pell proxy to make cross-institutional comparisons.
The pell grant program: eligibility and application process
The Pell Grant program has been the cornerstone of federal student aid for postsecondary education since its inception in the 1970s. It provides portable grants to students enrolled in undergraduate degree and certificate programs who meet a financial means test. Congress sets the maximum grant that a student can receive annually through the budget and appropriations process. Not all students receive the maximum; grants are awarded on a sliding scale based on a student’s financial need.
Students fill out the Free Application for Federal Student Aid (FAFSA) to apply for Pell Grants, student loans, and other aid. The application establishes the “expected family contribution” (EFC) a student—and her parents if she is a dependent—can put toward her education costs each year. Generally, students with an EFC less than the maximum Pell Grant qualify for a grant equal to the difference.[4] For example, in the 2011-12 academic year the maximum Pell Grant was $5,550. A student with an EFC of $4,000 would therefore qualify for a $1,550 Pell Grant for the academic year if enrolled full time.[5]
Students are informed of their EFC after completing the FAFSA, but are not awarded a Pell Grant until they apply to and enroll in a college or university. Upon accepting the grant, the Department of Education disburses the funds to the institution. Students can then use this for tuition, fees, books, and living expenses while enrolled, but they cannot receive a grant that exceeds this total cost of attendance in a given year. Additional eligibility restrictions are discussed in a later section.
why pell is a widely-used proxy
There are several reasons why researchers and the media almost exclusively use the Pell proxy to measure the share of low-income students at colleges and universities. First and foremost, the program historically has provided grants largely to students from low-income families. The median income of a Pell Grant recipient in 2011-12 was approximately $17,300.
Second, data and statistics are readily available. The U.S. Department of Education’s Integrated Postsecondary Education Data System (IPEDS) requires institutions of higher education to submit data on the share of their students who received Pell Grants. The data are then made publicly available on the IPEDS website. The Department also publishes separate data on Pell Grant disbursals for each institution of higher education on its website, which researchers can compare with enrollment figures published by these institutions to calculate the share of students with Pell Grants.
A third reason for the measure’s ubiquity is that data on student incomes at different institutions of higher education are limited. While institutions are required to report information on the race and gender of their students (and myriad other statistics through the IPEDS system) they do not report the share or number of students from different income groups. As a practical matter, they may not have this information for all students, especially those who do not file applications for financial aid.
There are some exceptions to this lack of information on student incomes. Since 2008, the government has required institutions to report a limited set of statistics on student incomes to the IPEDS system, but a long list of limitations apply to these statistics such that they might account for only 5 percent of undergraduates at a university. Moreover, the data sorts students into five predetermined income groups that are not adjusted for inflation over time.[6]
A recent paper and accompanying dataset released in 2017 by economist Raj Chetty and the Equality of Opportunity Project provides another source of income information.[7] Chetty and his colleagues use non-public data from individual federal income tax returns to examine the share of students at each college who are from low-income families, defined as the bottom income quintile. However, the analysis is limited to students age 19 to 22, which fails to capture a large group of older, independent students, many of whom are low-income.[8]
In summary, the share of students who received a Pell Grant is a widely used proxy for low-income students because grants are awarded mainly to those students; data on how many students at each institution of higher education receive a Pell Grant is readily available; and finally, data on student incomes at each institution of higher education has only recently become available and does not cover all students at each institution. This is not to say, however, that the Pell proxy is perfectly accurate. A better understanding of its limitations will help inform how researchers and the media use the proxy and how they disclose its shortcomings.
analysis: pell grant recipients by income group
The U.S. Department of Education’s NPSAS dataset can provide some insight into the accuracy of the Pell proxy. This quadrennial dataset includes student-level records for approximately 100,000 undergraduates and is designed to be nationally representative of students attending institutions eligible for federal aid programs. The data come from multiple sources, including college and university records, government databases, and student interviews. The NPSAS is not representative at the institutional level, however, meaning it cannot be used to assess the share of students at a particular college who are low-income or receive Pell Grants. Despite this limitation, the NPSAS data can still be used to identify potential problems with the Pell proxy and examine its accuracy for broad categories of institutions.
As a first step in the analysis of Pell Grant recipients by income group, I limit the data to U.S. citizens or legal residents enrolled in bachelor or associate degree programs, or certificate programs. Students who do not meet these requirements are generally ineligible for a Pell Grant. I then create four income groups for the academic years 1995-96, 1999-00, 2003-04, 2007-08, and 2011-12, adjusting the income brackets for inflation for the earlier datasets so that the groups are comparable.[9] Using the 2011-12 data as the base year, the groups are $0 to $30,000, which this paper will refer to as low-income; $30,001 to $65,994; $65,995 to $106,993; and $106,994 and higher.[10] The analysis uses total income, not adjusted gross income reported on the student’s or parent’s federal income taxes and FAFSA, although the two measures of income are similar.[11] The data reflect income one year prior to each academic year (e.g., income data for the 2011-12 year is from 2010).
Why do many low-income students not receive a Pell Grant?
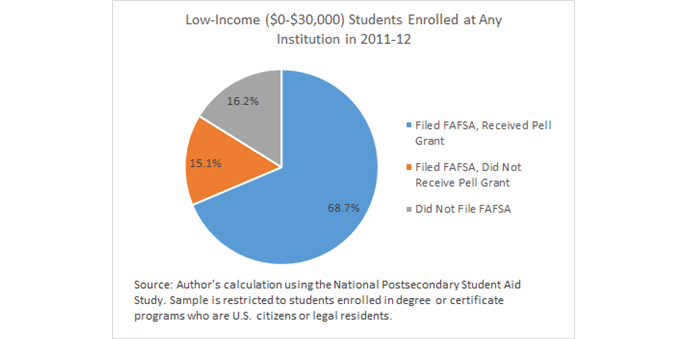
Looking first at the share of students in the low-income group who received Pell Grants in the most recent year (2011-12) reveals that only 68.7 percent of low-income students received a Pell Grant in 2011-12. Most studies using the Pell proxy, however, are focused on four-year institutions, and limiting the analysis to this group of students shows that the share of low-income students who received a Pell Grant is still surprisingly low (73.2 percent). These results stand in contrast to the implicit assumption in the Pell proxy that nearly all low-income students receive Pell Grants. In reality, the Pell proxy falls far short of capturing 100 percent of low-income students, even at four-year institutions, which receive the most attention when it comes to low-income student enrollment.
The NPSAS data also offer some possible explanations why so many low-income students do not receive Pell Grants.[12] A straightforward one is that these students do not apply for aid. Indeed, as Figure 1 shows, 16.2 percent of low-income students in 2011-12 did not file a FAFSA, which accounts for about half of the students who did not receive Pell Grants. But as Figure 1 also shows, the other half of low-income students who did not receive a Pell Grant did file a FAFSA.
It may be surprising that low-income students who filed a FAFSA did not receive Pell Grants. It turns out that about a quarter of those students may have significant assets despite their low incomes. The EFC formula appears to have captured that information and disqualified them for a Pell Grant. In short, failing to apply for a grant or having an EFC that exceeds the maximum Pell Grant explains much of why these low-income students did not receive Pell Grants. What explains the rest is less clear, at least from the NPSAS data.
Figure 1:
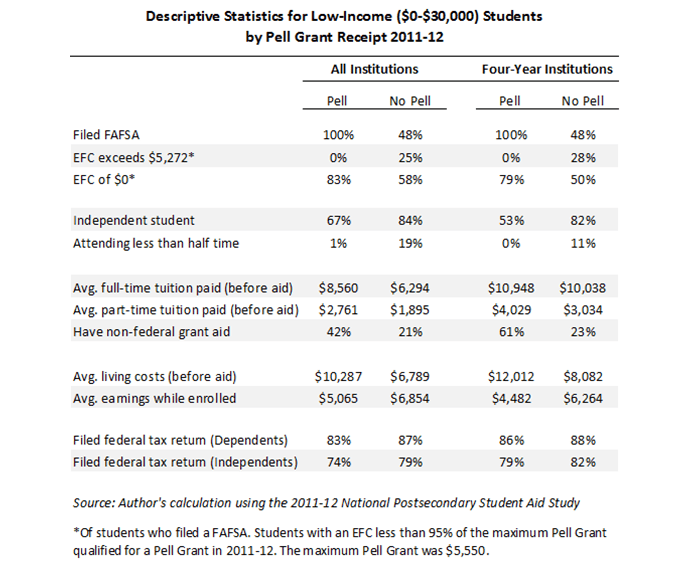
Comparing low-income students who received a Pell Grant with those who did not in 2011-12 provides just a few clues. Figure 2 shows that low-income students who did not receive a Pell Grant are more likely to be independent (i.e., not dependents of their parents) and earn more while enrolled. They are also more likely to attend part-time and are more likely to attend institutions with lower prices. In fact, nearly one in five of those who did not receive a grant were enrolled less than half time, whereas students who did receive a grant all attended at least half time or full time. Attending less than half time does not make these students ineligible for a Pell Grant, but it does make them ineligible for other federal aid like student loans, which may dissuade them from filing the FAFSA and qualifying for a Pell Grant.
Another possible explanation for the missing Pell Grant recipients could be that these students have other financial aid such that they do not need or want a Pell Grant. The data do not, however, offer much support for this theory. Just 21 percent of low-income students who do not receive a Pell Grant have any form of other grant aid, and the median amount is $1,008.
Figure 2:
There are other restrictions that affect Pell Grant eligibility that may play some role in disqualifying students, but the NPSAS does not include any data about them. For example, students in default on a federal student loan are ineligible for Pell Grants. About one in five recipients of a federal student loan are currently in default and there is some evidence that students from low-income families are more likely to default on a student loan.[13] It is possible that some of the low-income students who do not receive a Pell Grant have re-enrolled in institutions of higher education after previously dropping out and defaulting on a federal student loan and are therefore ineligible. Students convicted of a drug offense while receiving federal student aid are also not eligible for a Pell Grant. And students failing to make “satisfactory academic progress” (i.e., maintain a minimum grade-point average) lose eligibility. Of course, another explanation is that some low-income students may be eligible for a Pell Grant and opt not to take it—even after applying.
Why an increasing share of students receive Pell Grants
So far the discussion has focused on the share of students who did not receive a Pell Grant in 2011-12, which has implications for the Pell proxy because it suggests the proxy is undercounting low-income students. But another important finding in this analysis that merits more attention is the increasing share of students who do receive Pell Grants. This finding suggests that the Pell proxy has reliability problems when researchers use it to compare low-income student enrollments over time. Increases in the share of students who receive Pell Grants may not signal that a university has actually enrolled more low-income students; it may be that more of its low-income students are receiving grants, which would be consistent with national trends shown in this analysis.
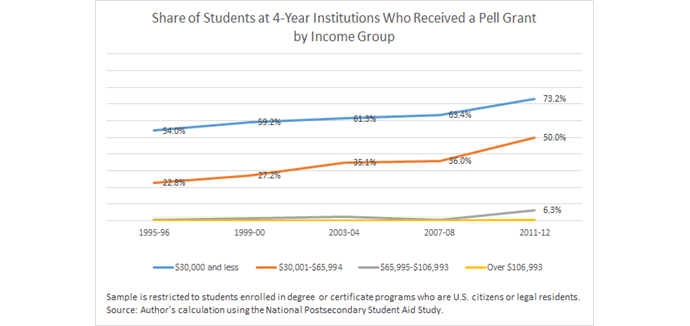
In 1995-96, fewer than half of students in the low-income group received a Pell Grant. Each successive year in the analysis shows the share increasing, with increases in the late 1990’s and those from 2007-08 to 2011-12 being the largest (see Figure 3). The change over time in the share receiving Pell Grants is even larger for the students whose families earned between $30,001 and $65,994. Just 16.7 percent of these students received Pell Grants in 1995-96, but over time that share more than doubled to 43.8 percent. The same pattern is evident when restricting the analysis to students attending four-year institutions (see Figure 4).
Figure 3:
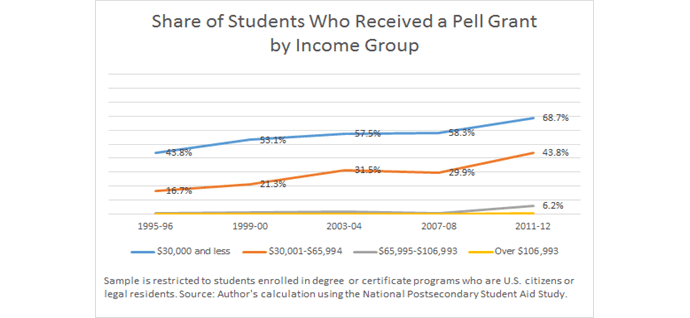
Figure 4:
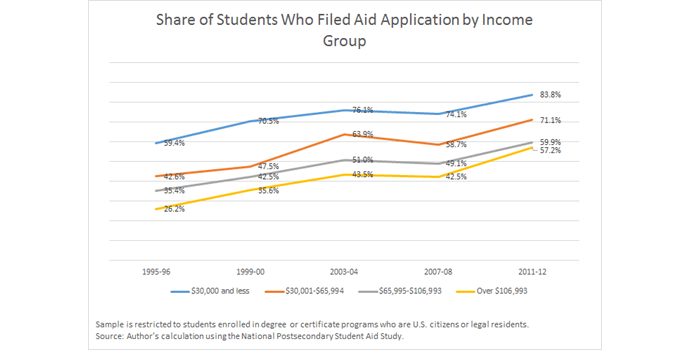
One reason a larger share of students received Pell Grants over time appears to be that more of them filed the FAFSA. Figure 5 shows that in 1995-96, just 59.4 percent of low-income students filed a FAFSA, but by 2011-12 the share increased to 83.8 percent. The second income group saw a larger change, rising from 42.6 percent to 71.1 percent over that period. Those increases closely track the rise in the share of students receiving Pell Grants and are similar for students attending four-year institutions.[14]
There may be a number of reasons why more students and families completed the application. More families may be aware of the form through outreach efforts, while simplification and the availability of online tools may also have boosted filing rates. Rising college prices might have played a role as well if more families were motivated to seek out financial assistance.
In addition to higher application rates, those who use the Pell proxy should be aware of another trend that has contributed to more students receiving Pell Grants. Changes that lawmakers made to eligibility rules boosted the share of students from the second and third income groups who receive Pell Grants. While the program has always targeted low-income students, middle-income students are more likely to receive a grant than ever before. The next section covers this development in detail.
Figure 5:
Middle-income students receive Pell Grants more than ever
The main justification for the Pell proxy is that most students who receive Pell Grants are low-income. That is accurate, but it also sidesteps two important shortcomings of the Pell proxy. As discussed earlier and shown in Figures 1 and 2, many students from the second income group receive Pell Grants, which is a close approximation for middle-income. Median household income was $49,445 in 2010, the year that the 2011-12 NPSAS data covers.[15] In 2011-12, 43.8 percent of students in this second income group received a Pell Grant, and 50 percent of those students at four-year institutions received one. That is more than double the share who received grants in 1995-96. Even a small share of students from the third income group (6.2 percent) received Pell Grants in 2011-12 across all institutions, whereas none of these students received grants in 1995-96.
To be sure, some might argue that there is nothing inaccurate about the Pell proxy including students from the second and third income groups. In their view, counting only students in the first income group defines low-income status too narrowly. The formula for the EFC, they would point out, incorporates information beyond a family’s income, such as household size, and therefore provides a more comprehensive measure of a family’s resources than income alone. Thus, the middle-income families who receive Pell Grants are more accurately counted as low-income families because they have limited means to pay for college. Regardless of whether this makes the Pell proxy more or less accurate for identifying low-income students, the important point here is that eligibility has been moving up the income spectrum, changing what the proxy measures over time. And the policies that drove those changes had nothing to do with the EFC formula’s more comprehensive measure of financial means.
The increase in the share of middle-income students who receive a Pell Grant is largely the result of Congress increasing the maximum Pell Grant at a rate that significantly exceeded inflation. Recall that a student is eligible for a Pell Grant if her EFC is less than the maximum Pell Grant. So if the maximum Pell Grant increases faster than the rate of inflation over time, but the EFC for a middle-income family increases at only the rate of inflation, more families will qualify for a grant at the margin. And the margin pushes further into income levels that are middle-income. Congress actually exacerbated the growing gap between the maximum grant and EFCs by making the EFC formula more generous (i.e., reducing families’ EFCs) over time—particularly between 2007-08 and 2011-12—such that a middle-income family actually saw its EFC decline in real terms.[16]
To see this effect, consider that families in the second income group had a median EFC of $3,059 in 1995-96, after adjusting for inflation.[17] Because that was higher than the maximum Pell Grant of $2,960 that year, most students in that income group did not qualify for a Pell Grant. In 2011-12, however, students in that income group were much more likely to qualify. The median EFC for this income group actually fell in real terms to $2,529, while the maximum Pell Grant increased faster than inflation to $5,550.[18] Thus, students from the second income group with a median EFC who did not qualify for a grant in 1995-96 were eligible for a Pell Grant of $3,021 in 2011-12.
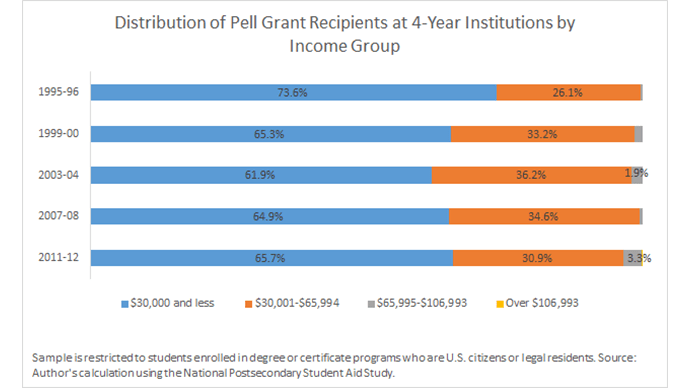
That a greater share of middle-income students now receive Pell Grants is only part of the Pell proxy’s middle-income problem. Looking at the share of all students who receive a Pell Grant who are middle-income, rather than the share of middle-income students who receive a Pell Grant reveals another issue. At four-year institutions, students from the second and third income groups have made up as much as 38.1 percent of Pell Grant recipients (2003-04), a surprisingly high share given that the Pell proxy is supposed to measure low-income status.
That figure has fluctuated considerably over time, which adds to the imprecision of the Pell proxy (see Figure 6). For example, a large increase in the size of the maximum Pell Grant between 1999-00 and 2003-04 boosted the share of Pell Grant recipients in the second and third income groups to its highest share, 38.1 percent. More middle-income students continued to gain eligibility for Pell Grants in later years, but that trend was more than offset by a different trend. A spike in the share of students enrolled in four-year institutions shifted the distribution of all Pell Grant recipients toward the low-income group. The increase in low-income enrollment has likely reversed in recent years and forthcoming data should show that the share of Pell Grant recipients who are middle-income is increasing again.
Figure 6:
Conclusion: implications for researchers and policymakers
The Pell proxy is the most widely-used measure among researchers and the media to determine the share of low-income students enrolled in individual colleges and universities because data on student incomes are largely unavailable or limited. Those who use the Pell proxy rarely note, however, that far fewer than 100 percent of low-income students receive Pell Grants, even at four-year institutions. As this analysis shows, colleges and universities may be enrolling many more low-income students than the Pell proxy suggests.
Another flaw in the Pell proxy cuts the other way. Many middle-income students now receive Pell Grants, meaning the Pell proxy is capturing students who are not low-income. While it is possible that the undercounting of low-income students and the inclusion of middle-income students in the Pell proxy cancel one another out, each flaw may vary from one institution to another. For example, if one university’s Pell Grant students are mostly middle-income and a second university’s Pell Grant students are entirely low-income, the Pell proxy would inaccurately treat the two institutions as enrolling similar numbers of low-income students. The Pell proxy could also inaccurately show that two institutions that actually enroll the same number of low-income students enroll different numbers if one enrolls low-income students more likely to file and claim a Pell Grant while the other enrolls low-income students less likely to apply for or claim one.
While the undercounting and over counting issues might wash, the problems with using the Pell proxy to measure enrollment over time are irrefutable. The significant changes in Pell Grant take-up rates, eligibility rules, and enrollment patterns over time make the Pell proxy extremely unreliable for tracking changes in low-income student enrollment over more than a few years. Researchers and the media should avoid the Pell proxy altogether for such analyses. While the NPSAS can provide more reliable information about enrollment trends than the Pell proxy, it does not provide information usable at the institution level. Therefore, the federal government should develop and make a new source of data available.
The approach used in the Chetty study referenced earlier offers a model. The researchers used federal tax forms that institutions of higher education must file for nearly each student who enrolls (Form 1098 T) to build a dataset that includes information on family income. Policymakers could enable federal agencies to make this data more widely available while adopting measures to protect privacy. They can also address the limitation in the data regarding the exclusion of most independent students. Chetty excluded these students because his study was focused on parental incomes, but data on independent students’ incomes can be obtained in the same manner as for the parents of dependent students.
Another finding from this analysis—the increasing share of middle-income students who apply and qualify for a Pell Grant—has implications beyond the accuracy of the Pell proxy. This trend highlights a design feature of the Pell Grant program that deserves more scrutiny. When Congress increases the maximum Pell Grant faster than the rate of inflation (which it tends to do over long periods of time because college prices rise faster than inflation) but does not make commensurate changes to the eligibility formula, more middle-income families qualify for a grant.
This is a result of the sliding-scale formula for grant eligibility, which increases the cost of the program more than would be necessary to increase grants for the lowest income students. Policymakers and researchers may wish to scrutinize the merits of providing middle-income families with Pell Grants, especially when it comes at the expense of providing larger grants to students with the lowest incomes. Past proposals in Congress have sought to remedy this issue by establishing a maximum income limit for a Pell Grant or making other adjustments to the eligibility formula.[19]
This analysis also shows how the Pell Grant proxy could be more accurate than data on student and family incomes for measuring the number of low-income students in institutions of higher education. Some of the low-income students who do not receive a Pell Grant have sufficient assets that the EFC formula disqualifies them for a grant. The Pell proxy excludes this group of students, whereas a dataset including only income information would count such students as low-income. Whether these students should be counted as low-income in the EFC formula or in analyses using the Pell proxy is certainly open to debate.
While the Pell proxy could be a more accurate measure of a family’s ability to pay for college because it captures more than income information, most of the findings in this analysis point to significant shortcomings in the Pell proxy. Researchers and the media should do more to acknowledge and disclose those limitations when using the Pell proxy. That might also help convince policymakers to make better data available to measure the share of low-income students enrolled in colleges and universities.
— Jason Delisle
 Jason Delisle is a resident fellow at the American Enterprise Institute.
This post originally appeared as part of Evidence Speaks, a weekly series of reports and notes by a standing panel of researchers under the editorship of Russ Whitehurst.
The author(s) were not paid by any entity outside of Brookings to write this particular article and did not receive financial support from or serve in a leadership position with any entity whose political or financial interests could be affected by this article.
Notes:
1. US News & World Report, “Economic Diversity Among the Top 25,” www.usnews.com/best-colleges/rankings/national-universities/economic-diversity-among-top-ranked-schools.
2. Anthony P. Carnevale and Martin Van Der Werf, “The 20% Solution: Selective Colleges Can Afford to Admit More Pell Grant Recipients,” Center on Education and the Workforce, Georgetown University, 2017, https://cew.georgetown.edu/wp-content/uploads/The-20-Percent-Solution-web.pdf.
3. Jeffrey Tebbs and Sarah Turner, “College Education for Low-Income Student: A Caution about Using Data on Pell Grant Recipients,” Change: The Magazine of Higher Learning, Volume. 37, Issue. 4 (2005) pp. 34-43.
4. For the 2011-12 year, students must qualify for a Pell Grant of at least 5% of the maximum grant of $5,550 to receive a grant. Congress subsequently changed this threshold to 10%, moderately reducing eligibility. Prior to the percentage-based policy, lawmakers set a nominal amount for the threshold. Student had to qualify for at least a $200 Pell Grant to receive one during the other years covered in this study. There is an alternative method for calculating eligibility than the maximum-grant-minus-EFC approach, and students qualify for the lesser of the two amounts. The alternative method subtracts a student’s EFC from the cost of attendance; the difference is the value of the Pell Grant he receives. Most students are not awarded Pell Grants using this method because it rarely results in the lesser Pell Grant. That is because a student’s cost of attendance is typically larger than the maximum Pell Grant award, so subtracting EFC from cost of attendance results in a larger Pell Grant than subtracting EFC from the maximum Pell Grant. This alternative method is predominantly used for students at low-cost colleges to limit their Pell Grant to their relatively low expenses as they cannot be awarded a Pell Grant in excesses of the cost of attendance.
5. While students qualified for a Pell Grant if the maximum grant exceeded their EFC by $278, the minimum grant they received was not be less than $555 under a policy to increase the size of the minimum grant. In years prior to 2011-12 in this analysis, a similar policy set the minimum grant at $400 for students qualifying for at least $200.
6. Institutions report the number of enrolled undergraduate students in each of five income groups: $0-$30,000; $30,001-$48,000; $48,001-$75,000; $75,001-$110,000; and $110,001 and over. The institution uses the income information on a student’s FAFSA in computing this statistic for IPEDS. To be counted in the statistics students must be full-time and they must be first-time (defined as first-year students who have never attended a postsecondary institution before). They must be enrolled in the fall, awarded federal financial aid (at any point during the year), be seeking a degree or certificate, and they must be paying the in-district or in-state tuition rate, if attending a public institution. For an example of how restrictive these exclusions can be, consider the University of Maryland-College Park. In Fall 2014, UMD had 27,056 undergraduate students. Of those, 4,140 were full-time, first-time, and degree/certificate-seeking. Of those, 3,050 were awarded any aid (from the government or the institution, or other sources). Of those, 1,800 paid the in-state tuition rate. Of those, 1,249 were awarded any Title IV federal student aid. These 1,249 students form the basis for the student income data in IPEDS. They represent 30% of all full-time, first-time, and degree/certificate-seeking undergraduate students at UMD, and just 5% of all undergraduate students in attendance.
7. Raj Chetty et al., “Mobility Report Cards: The Role of Colleges in Intergenerational Mobility,” Equality of Opportunity Project, Stanford University, July 2017, www.equality-of-opportunity.org/papers/coll_mrc_paper.pdf.
8. In 2011-12, 27% of low-income students enrolled in degree or certificate programs (those earning $30,000 or less) started college at the age of 23 or older and thus would not appear in these data. The same is true for 16% of low-income students at four-year institutions. Author’s calculation using the National Postsecondary Student Aid Study, 2011-12.
9. All adjustments for inflation use the Personal Consumption Expenditures price index.
10. These groups reflect quartiles for family incomes of all dependent undergraduates in the 2011-12 dataset and are adjusted for inflation for datasets from earlier years. However, the analysis includes all undergraduates—independent and dependent students. The low-income group created using these quartiles for dependent students is useful for this analysis because it is more closely aligned with eligibility rules for the Pell Grant program than is the lowest income group using quartiles for all undergraduates. Many independent students have very low, or no incomes, and including them for purposes of determining income group cut points results in two low-income groups. Specifically, the bottom two quartiles are $0-$14,125 and $14,126-$35,000.
11. Average total income is about $4,000 higher than average adjusted gross income in the 2011-12 dataset as it is a more comprehensive measure of income.
12. This analysis is already limited to students who meet the degree program and citizenship requirements for Pell Grants; those factors can therefore be ruled out as explanations.
13. Adam Looney and Constantine Yannelis, “A Crisis in Student Loans? How Changes in the Characteristics of Borrowers and in the Institutions They Attend Contributed to Rising Loan Defaults,” Brookings, Fall 2015, https://www.brookings.edu/wpcontent/uploads/2015/09/LooneyTextFall15BPEA.pdf; The share of students currently in default is based on the author’s calculation using U.S. Department of Education, “Federal Student Loan Portfolio,” 2017, https://studentaid.ed.gov/sa/about/data-center/student/portfolio. It includes total number of borrowers in default in 2017 as a share of all borrowers whose loans have come due and are not in in-school status or grace period.
14. Students in the highest two income groups also saw increases in application rates, but these students are generally not eligible for Pell Grants. They file the FAFSA mainly to gain access to federal student loans or because a state aid program or the institution they attend requires it.
15. US Census, “Income, Poverty, and Health Insurance Coverage in the United States: 2010,” https://www.census.gov/prod/2011pubs/p60-239.pdf#page=5; A few statistics can help determine the extent to which the cutoff for the second income group might be producing the appearance that many middle-income students receive a Pell Grant when these students might be better categorized as low-income. In other words, it is important to know how many students in the second income group are just over the $30,000 cutoff. Looking at the distribution of student incomes for students who received a Pell Grant in the second income group shows that median income is $44,767, near the midpoint for that income group. Moreover, a quarter of these students have incomes between $54,762 and $65,994, making this group a reasonable grouping for middle-income. Income at the 10th percentile for this group is $32,397; at the 25th percentile it is $36,472.
16. The College Cost Reduction and Access Act (CCRAA) of 2007 made a number of changes to how the EFC is calculated. The changes that have the greatest relevance for the increases in share of middle-income students eligible for Pell Grants were those made to the “Income Protection Allowances.” The EFC calculation excludes a set amount of income based on a family’s situation. The CCRAA increased those limits for the 2009-10 through 2012-13 years and then indexed the higher levels to inflation thereafter. Unlike other changes included in the law, the changes to the Income Protection Allowances reduced EFCs for all applicants, not those primarily with low-incomes. College Cost Reduction and Access Act of 2007, Public Law 110-84, https://www.congress.gov/110/plaws/publ84/PLAW-110publ84.pdf.
17. Figure is only for students who filed a FAFSA. While the NPSAS includes an imputed value for those who did not file, the imputed figure is not included here.
18. The distribution of incomes within the second income group was not substantially different in 2011-12 than it was in 1995-96. Therefore, the reduction in the EFC was the result of policy changes Congress had made to the formula not a downward shift in the distribution of incomes in that income group.
19. Fiscal Year 2015 Budget Resolution, “The Path to Prosperity,” http://budget.house.gov/uploadedfiles/fy15_blueprint.pdf ; Congressional Budget Office “Options for Reducing the Deficit: 2017 to 2026,” December 2016, www.cbo.gov/sites/default/files/114th-congress-2015-2016/reports/52142-budgetoptions2.pdf.