 Every summer, the news is filled with stories about summer learning loss. The warnings sound dire: two months of math learning lost for most students every summer, and two to three months of reading learning lost for low-income students, according to the National Summer Learning Association. By the ninth grade, “summer learning loss during elementary school accounts for two-thirds of the achievement gap in reading between low-income children and their middle-income peers,” the association says. There can be no doubt about it: as American children lounge poolside, watch too much television, and play too many video games, most are forgetting what they learned in school last year, and low-income students are falling even further behind.
It sounds plausible. But how reliable are these claims? How many of these findings can be replicated? Is summer learning loss really a thing?
I used to be a big believer in summer learning loss. After all, children’s home lives can be pretty different. Some children live in big houses with one sibling and two college-educated parents. Others children live in small run-down apartments with several siblings competing for time with a single parent who may not have finished high school. We know that these differences make a mark in early childhood; we know that poor children are already behind academically by the time they start kindergarten. Why wouldn’t family disadvantages have the same negative effects when children return home for summer vacation?
But my belief has been shaken. I’m no longer sure that the average child loses months of skills each year, and I doubt that summer learning loss contributes much to the achievement gap in ninth grade.
Several things happened to challenge my faith. One is that my colleagues and I tried to replicate some of the classic results in the summer learning literature—and failed. Sure, the patterns were present on one test—the one used in the best-known study of summer learning. But that study is 30 years old, and we couldn’t replicate its results using modern exams. And it turned out that the test from that study had problems, which had been debated long ago and then, over time, forgotten.
Then I looked more closely at the research on early learning. Early-childhood scholars believe that nearly all of the gaps between children’s skills form before the age of five, or even before the age of three. According to their research, the gaps that we observe in ninth grade were already present, and almost the same size, as they were when those children started kindergarten. Where does summer learning loss fit into that picture?
And of course there is no shortage of researchers who will tell you that achievement gaps are largely the fault of schools. Schools serving poor communities are inferior, these scholars argue, and even when poor children attend schools in middle-class communities, they are shunted into lower achievement groups and curricular tracks, which impede their intellectual growth while wealthier peers surge ahead. If school is the source of achievement gaps, where does that leave summer holidays?
Each research community carries on as though its version of reality is correct, but these three claims are incompatible. How can achievement gaps be full-fledged at age five, yet triple during summer vacations, yet still be the fault of schools? Those claims can’t all be right.
The contradictions got to me, and I decided to investigate. I found that researchers were honestly describing the patterns in the test results that they had to work with. The contradictions, it turned out, emerged from the test scores themselves.
A classic result fails to replicate
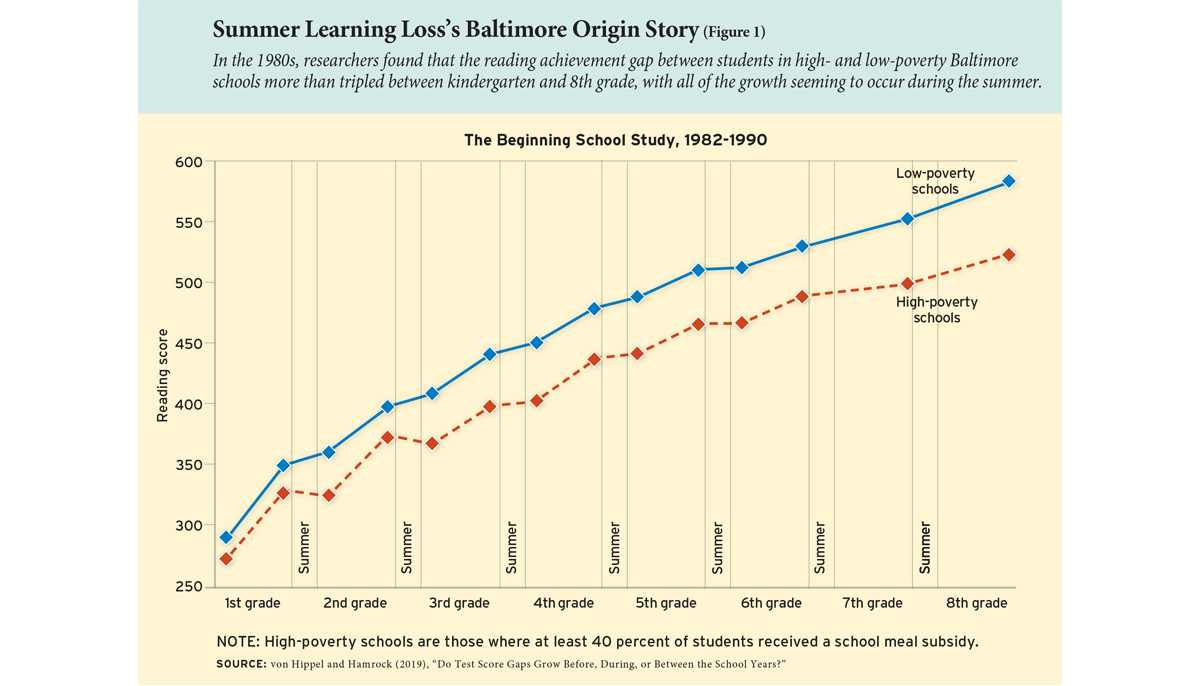
Let’s start with the most famous study regarding summer learning loss: the Beginning School Study, which started in the fall of 1982 with 838 first graders in the Baltimore City Public Schools. Students were tested twice a year, in fall and spring, so researchers could tell how quickly they were learning during the school year and during summer vacation.
At the beginning of the study, first graders in high-poverty schools scored 16 points below other first graders on the California Achievement Test (see Figure 1). The gap more than tripled, to 56 points, by the end of eighth grade. Remarkably, all of the gap growth took place during summer vacations; gaps did not grow during the school years. This is where we get the idea that more than two thirds of the eighth-grade achievement gap comes from summer learning loss.
But does this result hold for children today? There are reasons for doubt. The most obvious is that the Beginning School Study is old, and it’s not clear how broadly we can generalize its results. The children in the study all attended public schools in a single city and finished eighth grade in the spring of 1990. They are over 40 years old today. Yet major publications and advocates have quoted these results as if they are findings of current national interest; for example, Malcolm Gladwell’s 2008 book Outliers discussed them at face value, Time magazine published the results as recently as 2010, and The Economist summarized them in 2018. Couldn’t researchers have supplied more recent data from a wider variety of locations to make the same point?
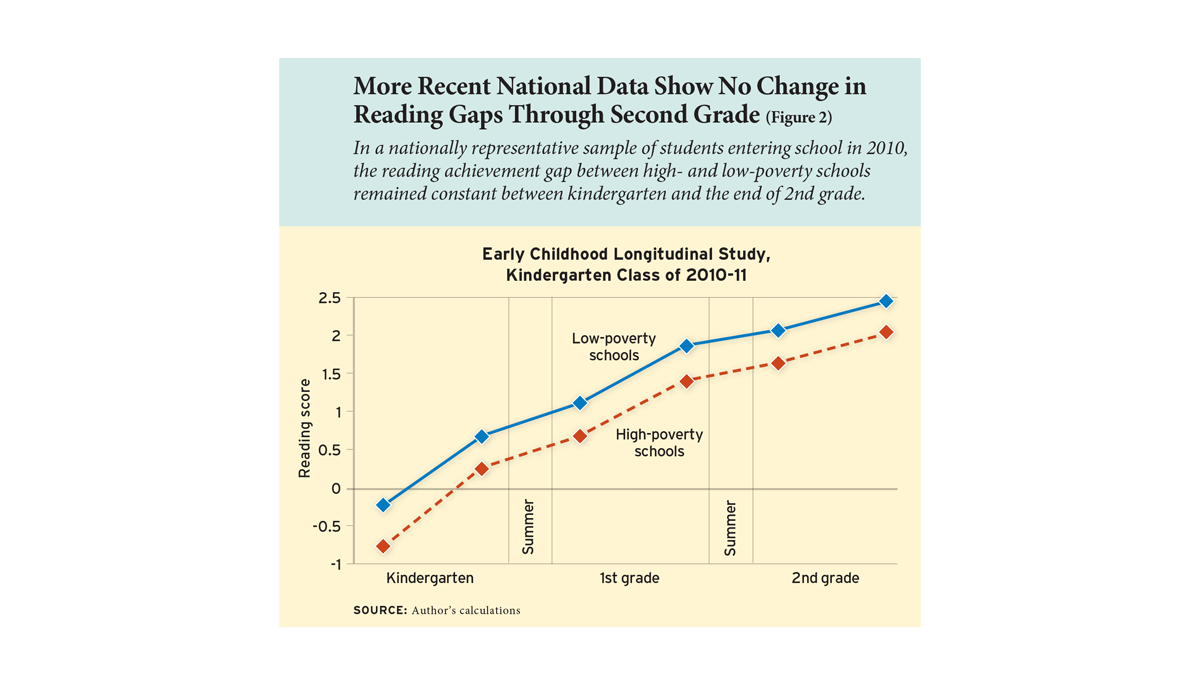
No—and here’s why. Broad, modern data don’t look like the data used in the Beginning School Study. Consider the federal Early Childhood Longitudinal Study of the kindergarten class of 2010–11, a nationally representative sample of children in public and private schools across the United States. Figure 2 uses these national data to estimate the gap in reading scores between students in high- and low-poverty schools. The gap barely changed between the start of kindergarten and the end of second grade. There is no sign of the gap growing during summer vacations.
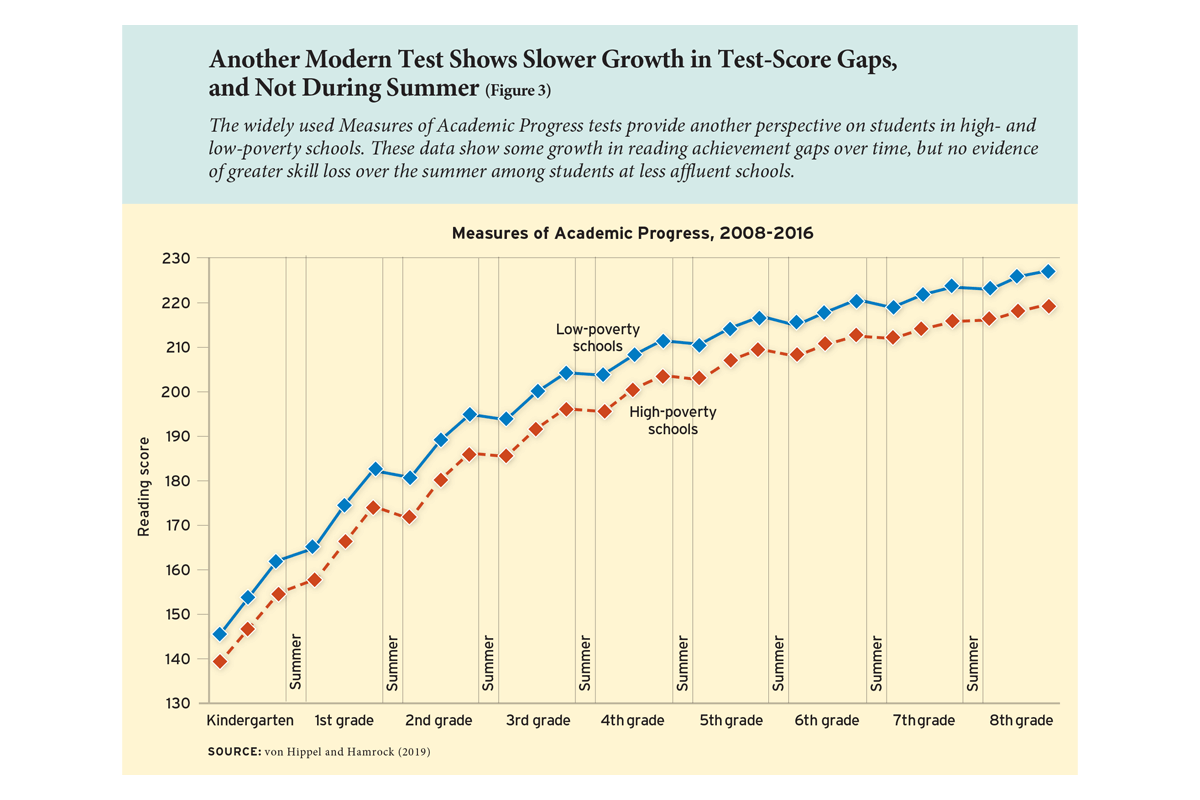
Or look at the Measures of Academic Progress, a test developed by the Northwest Evaluation Association and given in more than 7,800 schools and districts across the United States. Gaps on that test don’t look like the Beginning School Study either. Figure 3 shows the reading gap between high- and low-poverty schools among students in 25 districts across 15 states starting in 2008. The gap did grow between kindergarten and eighth grade, but only by one third, and the gap grew no faster during the summer than it did during the school year.
The fun-house mirror of 1980s test scores
What happened? How did a result that looked so clear in 1980s Baltimore go up in smoke when we tried to verify it using national data from around 2010? Were children so different in the 1980s? Was Baltimore such an odd place?
No. But the way we test and score student performance has changed dramatically since the days of the Beginning School Study.
Many of us—parents, teachers, politicians, even most researchers—take standardized test scores at face value; we interpret scores as though they reflected children’s skills neutrally, like a mirror. But in the 1980s, some scores could give a misleading reflection, like a fun-house mirror. Scores from the 1980s got children in more or less the right order, with more-advanced students ahead of less-advanced kids. But they distorted the distances between children, making some gaps look larger or smaller than they were.
That’s because turning a set of right and wrong answers on a test into a valid test score is a surprisingly hard thing to do.
You might think that it’s easy to score tests. Just ask a bunch of questions and award a score based on the percentage of correct answers. For example, suppose you give children 10 math problems, and on average poor children answer 6 questions correctly, while rich children answer 8 questions correctly. Then the average percentage is 80 percent for rich children and 60 percent for poor children—a gap of 20 percentage points. Easy, right?
But now add 10 new questions. What happens to those percentages? As Sean Reardon has pointed out, it depends on how hard the new questions are. And that has big implications for the test-score gap.
If the new questions are so hard that no child can answer them, then the percentage of correct answers will fall to 40 percent for rich children (who will get 8 out of 20 right) and 30 percent for poor children (who will get 6 out of 20 right). And just like that, the achievement gap gets cut in half, shrinking from 20 to 10 percentage points. Likewise, if the new questions are so easy that everyone can answer them, again the achievement gap is cut in half to 10 percentage points. Wealthy children will earn 90 percent scores by answering 18 out of 20 questions correctly, and poor children will score 80 percent by getting 16 out of 20 questions right.
But if the new questions are in the middle, where most rich children can answer them and most poor children cannot, then the percentage gap between rich and poor children will grow bigger than 20 percentage points. Depending on what questions you add, you can get any gap that you want.
Modern-day scoring methods try to solve this problem by comparing children’s performance in a way that controls for the difficulty of the questions on the test. But some methods are more effective than others. And even the best methods can disagree.
Modern scoring methods weren’t widely implemented when the Beginning School Study was first administered in 1982. The study used the California Achievement Test, which at the time was still scored by a simple method known as Thurstone scaling, developed by Louis Thurstone in 1925, the age of pencils and graph paper. It was only in 1985, as personal computers spread, that the test switched to a more computationally intensive method known as item response theory.
That switch radically changed the appearance of achievement gaps on the California Achievement Test. When the test used Thurstone scaling, it showed that score gaps expanded as children grow older. But when it switched to item response theory scaling, gaps did not expand anymore—in fact, as students got older, gaps shrank.
Test watchers were shocked. Test experts were alarmed. “Something’s awry,” one lamented, “in the state of test mark.” But the fracas subsided, and hardly anyone remembers it today, when practically every major test uses item response theory
Though now an overlooked footnote in psychometric history, the switch from Thurstone scaling to item response theory shaped classic findings on summer learning loss. The Beginning School Study used the old Thurstone-scored test and concluded that achievement gaps more than tripled between first grade and eighth. If it had used the item response theory version, though, it would have found that achievement gaps didn’t grow with age at all.
Measuring summer learning: from one fun-house mirror to another
Changes to the California Achievement Test also changed apparent patterns of summer learning. When the test used Thurstone scaling, the scores of high- and low-achieving students spread apart over the summer, producing the appearance of summer learning gaps that remain famous today. But when the test switched to item response theory scaling, high and low scores converged over the summer—the opposite of the famous finding. So had the Beginning School Study started just a few years later, our mental image of summer learning might be very different.
In fact, it’s hard to estimate summer learning accurately—and it was harder in the 1980s. In the 1980s, children generally took “fixed-form” tests (including the California Achievement Test), which asked the same questions of every child in the same grade twice: at the beginning and end of the school year. All first graders answered the same questions, all second graders answered the same questions, and so on.
But think about how fixed-form testing affects efforts to calculate summer learning. During first grade, every child took the same test and answered the same questions in fall and spring. Then children went home for the summer, and when they came back to start second grade they got a different test form with different questions. So first-grade learning was calculated by comparing fall and spring answers to the same questions, but summer learning was calculated by comparing spring and fall answers to different questions.
Comparing scores from different test forms is challenging, especially if the tests are scored using a distorted scale. In the 1980s, estimating summer learning by comparing different test forms was like trying to estimate how much taller a child had grown over the summer by comparing their reflections in two different fun-house mirrors. Any difference between the mirrors—any difference between the first- and second-grade test forms and the way they were scored—had the potential to distort researchers’ impressions of summer learning. Test vendors tried to solve this problem by “aligning” the first- and second-grade scores, but it’s not clear how successful they were. The fact that two versions of the California Achievement Test didn’t agree on how gaps changed over the summer between first and second grade suggests that at least one version wasn’t properly aligned.
The fun-house mirror problem wasn’t limited to the Baltimore results. Before 2000, pretty much all summer-learning studies used fixed-form tests that changed at the end of summer vacation. And a lot of tests used scaling methods that wouldn’t pass muster today. So the whole summer-learning literature reviewed in a 1996 meta-analysis—including well-known results from New York City in the 1960s and from New Haven and Atlanta in the 1970s—is questionable. If we could go back in time and give those kids modern tests, it’s quite possible that the results wouldn’t replicate.
Are we still in the fun house?
Today, many tests still use fixed forms, but the best modern tests are “adaptive”: they ask harder questions after students give correct answers and easier questions after students give incorrect answers. You’ve experienced adaptive testing if you’ve taken a college or graduate-school entrance exam—like the SAT, GMAT, or GRE—since the mid-1990s.
Adaptive tests have several advantages. They don’t ask all students the same questions, and they automatically get harder as children get older. So adaptive tests don’t need to change abruptly at the start of a new grade, which means they do a more accurate and reliable job of estimating summer learning.
Or do they?
Earlier I mentioned a couple of tests that were given to children who started kindergarten in 2010: the Measures of Academic Progress test developed by the Northwest Evaluation Association, and a test developed for the Early Childhood Longitudinal Study of the kindergarten class of 2010–11. Both tests were administered adaptively, and both were scored using item response theory. You might think they’d show the same patterns—and on some issues they do. They both show that learning slows as children get older, and they both demonstrate that achievement gaps change only a little after the start of kindergarten.
But they don’t agree when it comes to summer learning.
Sociologists Joseph Workman and Joseph Merry have compared summer-learning loss estimates from these tests, and found they don’t look alike at all. According to the Early Childhood Longitudinal Study tests, summer learning loss is trivial. On average, children lose just two weeks of reading and math skills their first summer vacation. During their second summer vacation, they lose two weeks of reading again, and they actually gain a little in math.
According to the Measures of Academic Progress tests, though, summer learning loss is much more serious. On average, children lose about a month of reading and math skills during their first summer vacation. And during their second summer vacation, they lose three full months of skills in reading and math.
How can students lose three months on one test, when they’re barely losing, or even gaining, on another? It’s hard to explain. And it’s not the only way that these tests disagree. In research with Caitlin Hamrock, I’ve found that tests also disagree about how achievement gaps change with age. According to the Measures of Academic Progress, most achievement gaps grow as children get older, but according to the Early Childhood Longitudinal Study, most gaps hold steady or even shrink. These are the kinds of disagreements that I hoped adaptive testing and item response theory would solve, but maybe it’s not that easy. Even on an adaptive test, maybe it’s just hard to estimate how gaps change over time.
Can summers offer trailing students a chance to catch up?
So what do we know about summer learning loss? Less than we think. The problem could be serious, or it could be trivial. Children might lose a third of a year’s learning over summer vacation, or they might tread water. Achievement gaps might grow faster during summer vacations, or they might not. Results from older tests can’t be replicated on modern tests, and modern tests don’t necessarily agree with each other. But it is almost surely not the case that summer learning loss accounts for two thirds of the achievement gap at the end of eighth grade. On modern tests, it seems that most of the eighth-grade achievement gap is already present at the start of kindergarten. Early-childhood scholars are right about that.
What else do we know about summer learning? There is one result that replicates consistently across every test that I’ve ever looked at. It’s so obvious that it’s easy to overlook, but it’s still important: nearly all children, no matter how advantaged, learn much more slowly during summer vacations than they do during the school years. That means that every summer offers children who are behind a chance to catch up. In other words, even if gaps don’t grow much during summer vacations, summer vacations still offer a chance to shrink them.
What’s the best way to capitalize on this annual opportunity? Previous research shows that summer learning programs for disadvantaged children can take a bite out of achievement gaps, especially if students attend them regularly for several years. Unfortunately, poor attendance sometimes dilutes the effectiveness of summer learning programs; students who attend summer programs regularly get a benefit, but other students do not.
So-called “year-round” school calendars aren’t the answer, as I discussed in an earlier review. Despite their misleading name, year-round calendars don’t actually increase the amount of time that children spend in school; instead, they take the usual 170–180 days and distribute them more evenly across the seasons. Summer vacations are shorter, but breaks at other times of year are longer, so that the total time spent in and out school—and the total amount learned and forgotten—does not change.
By contrast, “extended-year” calendars do take advantage of the opportunity to accelerate student learning during the summer months. Extended-year calendars typically add extra weeks of school during the summer, and sometimes on Saturdays as well, providing children with up to 210 days of instruction per year. Less than one in 1,000 U.S. schools uses an extended-year calendar, but they’re popular among the highest-performing charter schools and one of the reforms that Harvard economist Roland Fryer found improved math scores among the lowest-performing traditional public schools in Houston, Chicago, and Denver.
But the potential effectiveness of summer learning programs and extended-year schools may have little to do with summer learning loss. It may be that these interventions don’t prevent gaps from opening during the summer. Instead, they help to shrink achievement gaps that were already there on the first day of kindergarten.
Paul T. von Hippel is an associate professor in the LBJ School of Public Affairs at the University of Texas at Austin. The research summarized here was published in two academic articles: “Do Test Score Gaps Grow Before, During, or Between the School Years?” (with Caitlin Hamrock, in Sociological Science, 2019) and “Inequality in Reading and Math Skills Forms Mainly before Kindergarten: A Replication, and Partial Correction, of ‘Are Schools the Great Equalizer?’” (with Joe Workman and Doug Downey, in Sociology of Education, 2018).
For more, please see “The Top 20 Education Next Articles of 2024.”
This article appeared in the Fall 2019 issue of Education Next. Suggested citation format:
Von Hippel, P.T. (2019). Is Summer Learning Loss Real? How I lost faith in one of education research’s classic results. Education Next, 9-14.