Calamities often disrupt the status quo. After the influenza pandemic that began during World War I and lasted two years, many Europeans turned to socialism, fascism, and Bolshevism. In the United States, the Wall Street Crash of 1929 followed by the Great Depression induced many people to reject laissez-faire capitalism in favor of Franklin Delano Roosevelt’s New Deal, with its social safety-net programs, public-works projects, and government regulations.
Yet not all such catastrophic events lead to an appetite for change. After World War I, Americans, unlike Europeans, longed for a return to what President Warren G. Harding termed “normalcy.” The immigration door slammed shut, isolationism raged, and popular fear of Communism led to the Red Scare.
The 15th annual Education Next survey investigates how Americans are responding to the worst pandemic since 1919. In the realm of education, a desire for sweeping reform might well be expected, given the pandemic’s particularly severe toll on K–12 schooling. While few children suffered serious illnesses, the effects of the pandemic on the nation’s youth were nonetheless dramatic. Schools across the country were shuttered for months, some for more than a year. State-mandated testing, a tool for holding schools accountable, was largely abandoned. Remote instruction, implemented under crisis conditions, failed to live up to the claims of virtual-learning enthusiasts. Learning loss was severe, especially among children from low-income families. According to parents, children’s friendships and social ties suffered. Even their physical fitness was put at risk. Obesity, drug abuse, mental health challenges, and teenage suicides appeared to be on the rise. In desperation, some parents shifted their children from district schools to private schools, homeschooling, and other options that provided more in-person learning.
In the political sphere, expectations for large-scale innovation are running high. Conservatives hope to restrict union power, reinstate test-based accountability, and expand school choice. Legislators in seven states have created new programs offering parents alternatives to the traditional system, making 2021 the most successful year on record for school-choice advocates (see “School Choice Advances in the States,” features, Fall 2021). Progressives are pushing for higher teacher pay, free college, and preschool for all.
What, then, is the state of public opinion as parents and school leaders nationwide transition back to in-person schooling? Is the public demanding innovation that can make up for educational losses over the past year? Or do people want a quiet return to the familiar?
This survey is a continuation of our long-standing annual poll of public attitudes on education issues. This year, we interviewed a nationally representative sample of 1,410 adults in late May and early June. Our survey repeats many questions asked in past surveys, making it possible to see how the pandemic has affected public opinion. As in previous years, the survey contains a number of experiments in which we split the sample into two or three groups at random and then ask each group a variation on the same question. These experiments allow us to gauge how different question wordings and the provision of additional information affect participants’ responses (see sidebar on survey methodology).
[td_block_image_box custom_title=”Interactive results from the 2021 Education Next survey” image_item0=”49713881″ image_title_item0=”Results from the 2021 Education Next Poll” custom_url_item0=”https://www.educationnext.org/2021-ednext-poll-interactive/” open_in_new_window_item0=”true” image_item1=”49713883″ image_title_item1=”Education Next Annual Poll: Trends Through 2021″ custom_url_item1=”https://www.educationnext.org/ednext-poll-interactive-trends-through-2021-public-opinion/” open_in_new_window_item1=”true”]
Opinion Shifts
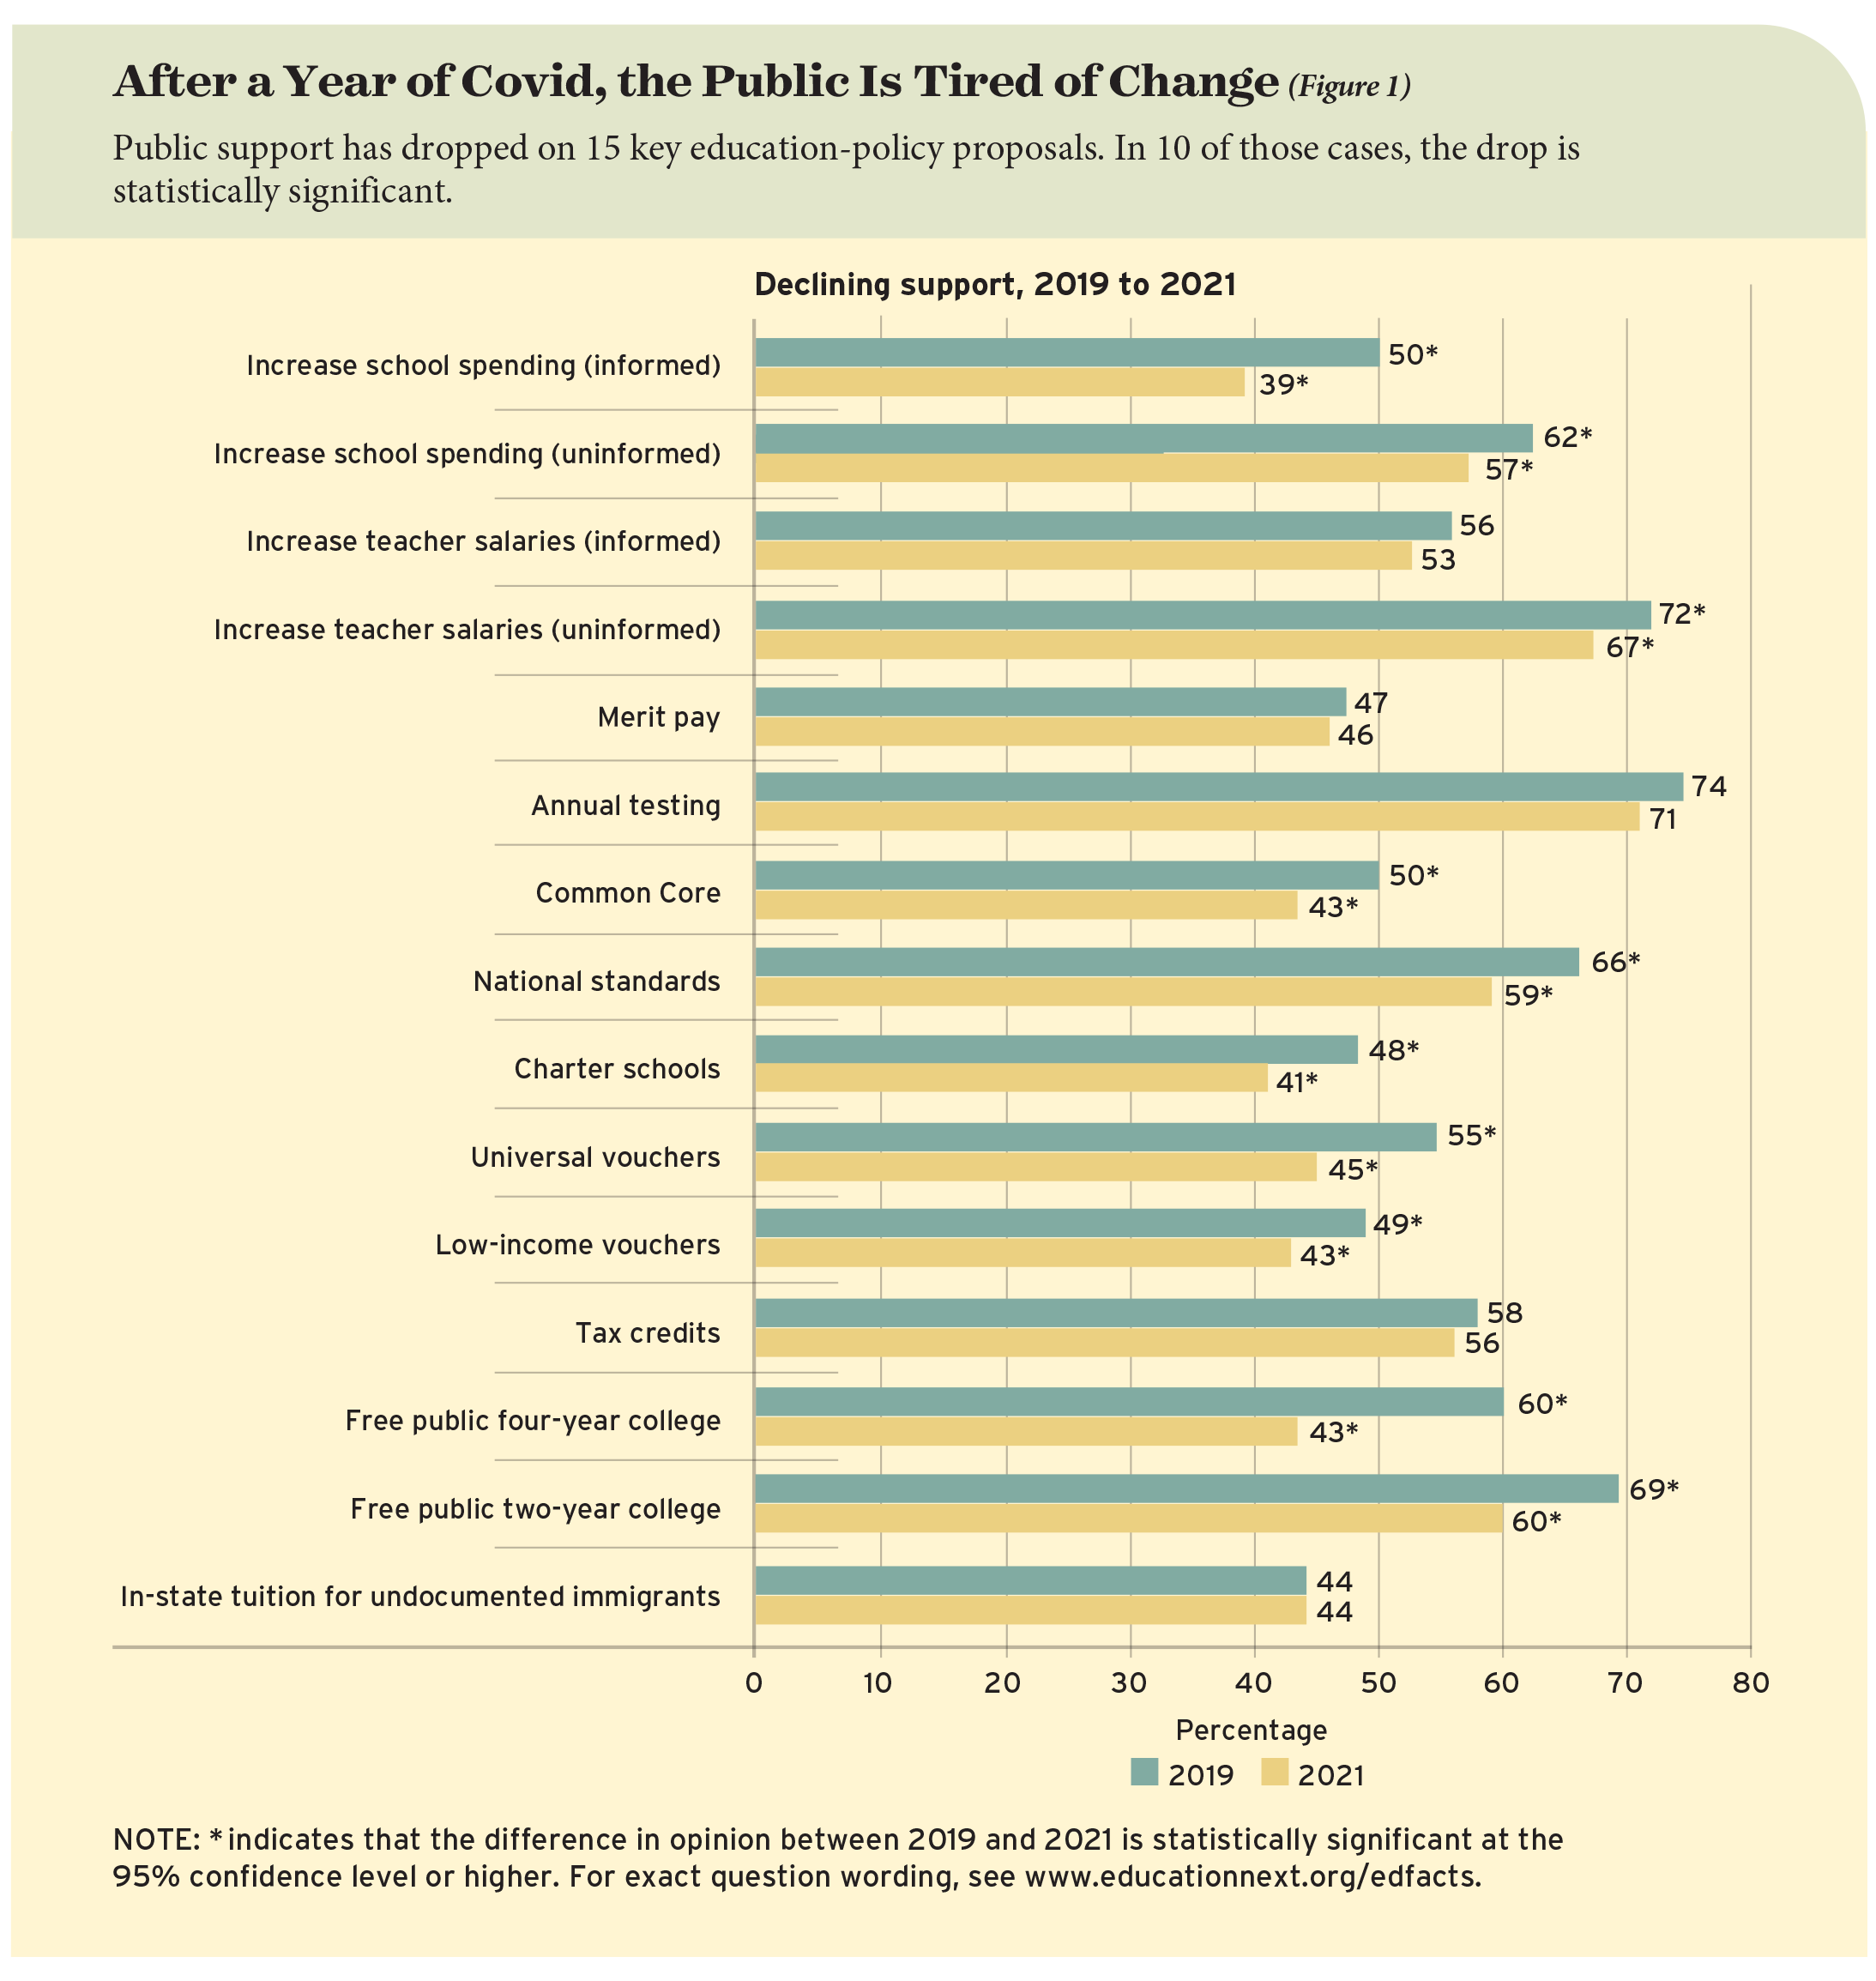
Our survey results should temper expectations for major shifts in any political direction—and perhaps post a warning to advocates of any stripe. At least when it comes to education policy, the U.S. public seems as determined to return to normalcy after Covid as it was after the flu pandemic a century ago. To find out, we compare public views on 15 policy questions in June 2021 with views on the same questions two years earlier—before anyone had heard of Covid-19 (see Figure 1). On 10 of the 15 items, support for the proposed policy declines by 5 percentage points or more—a statistically significant difference. Drops in support are evident regardless of whether the policy is backed by those on the right or those on the left. In one case—the idea of making four-year public colleges free to attend—the drop is as large as 17 percentage points. On four additional policy items, support levels fall, but the change is not statistically significant. On one item—in-state tuition for undocumented immigrants who graduate from a state high school—we find no change. On no policy item do we identify a positive shift in support between 2019 and 2021. We do show an increase in approval for universal preschool between 2014 and 2021, but in the absence of information on opinion in 2019, we are unable to say whether the upward jump took place before or during the pandemic.
While many of the policies we asked about already exist in pockets around the country, in most places they represent a change to the status quo. In the one case where the policy is now universal (maintaining the federal requirement that students take annual state tests), we do not observe a statistically significant change. The following illustrates the shifts in public opinion between 2019 and 2021 on policy items for which the same question was posed on both occasions.
Support for increasing school expenditures in respondent’s district
- Among respondents informed of current per-student expenditure level: Down 11 points (to 39% from 50%)
- Among those not informed of current per-student
expenditure level: Down 5 points (to 57% from 62%)
Support for increasing teacher salaries in respondent’s state
- Among those informed of current average teacher
salary in their state: Down 3 points (to 53% from 56%) - Among those not informed of current average state
salary: Down 5 points (to 67% from 72%)
Support for free or reduced-cost education
- Preschool programs for all four-year-olds (2014 to 2021): Up 13 points (to 67% from 54%); Caveat: Increase in support
for universal preschool may have occurred prior to 2019. - Free four-year public colleges: Down 17 points (to 43% from 60%)
- Making immigrants eligible for in-state tuition: No change (44%)
Support for school accountability measures
- Common Core Standards: Down 7 points (to 43%
from 50%) - Similar standards across states: Down 7 points
(to 59% from 66%) - Requiring testing in grades 3–8 and high school:
Down 3 points (to 71% from 74%) - Merit pay for teachers: Down 1 point (to 46% from 47%)
Support for school choice
- Charter schools: Down 7 points (to 41% from 48%)
- Universal school vouchers: Down 10 points (to 45%
from 55%) - School vouchers for low-income families only:
Down 6 points (to 43% from 49%) - Tax-credit scholarships: Down 2 points (to 56%
from 58%)
In Short: The public seems tired of disruption, change, and uncertainty. Enthusiasm for most, perhaps all, policy innovations has waned. The shifts are not large enough to be statistically significant for some items: in-state tuition for immigrant children, higher salaries for teachers when the respondent is informed of current pay levels, testing students for accountability purposes, tax-credit scholarships, and merit pay. On other items, such as preschool education, the survey does not include information on the state of opinion in both 2019 and 2021, but we find no evidence of a surge in demand for change and reform. All in all, the public appears to be calling for a return to the status quo.
Grading Schools and Other Public Services
Public institutions came under severe stress in 2020. Schools switched from in-person to online instructional modes; post offices faced ever-increasing competition from digital messaging and private-delivery systems; demonstrators and police battled across the country in the wake of reported brutalities against Black people, including the horrific murder of George Floyd.
Public-sector unions did not escape harsh criticism during the course of these controversies. Teachers’ organizations were accused of placing educators’ safety ahead of students’ educational needs. Police unions were attacked for protecting officers accused of criminal abuses. Postal unions were criticized for inefficiencies in the mail-delivery system.
How has the public responded to these events and the controversies they have spawned? Do people think schools, police, and postal officials are doing the best they can? Or have they become more critical of the public entities they count on to provide basic services in every city and town? Does the public blame public-sector unions for hampering the effective and unbiased delivery of services?
To find out, we asked survey respondents to evaluate schools, police, and post offices on the same A-to-F scale traditionally used to evaluate student performance. We asked them to assess the performance of these institutions in both their local communities and the “nation as a whole.” Some questions are identical to those posed in 2008 and again in 2018, letting us see whether intervening events have altered people’s assessments. In 2021, we also asked respondents whether they think public-sector unions in these three realms are having a “generally positive” or a “generally negative” impact on the public services provided by the relevant public agency—a question we had previously posed only about teachers unions.
We find that the public holds both public agencies and their unions harmless for any deficiencies in service delivery that have occurred either as the result of the pandemic or of deteriorating race relations. For the most part, public evaluations are at least as positive in 2021 as they have been in the past. However, Black Americans have become more critical of the police force since 2008, even as their views of schools have greatly improved.
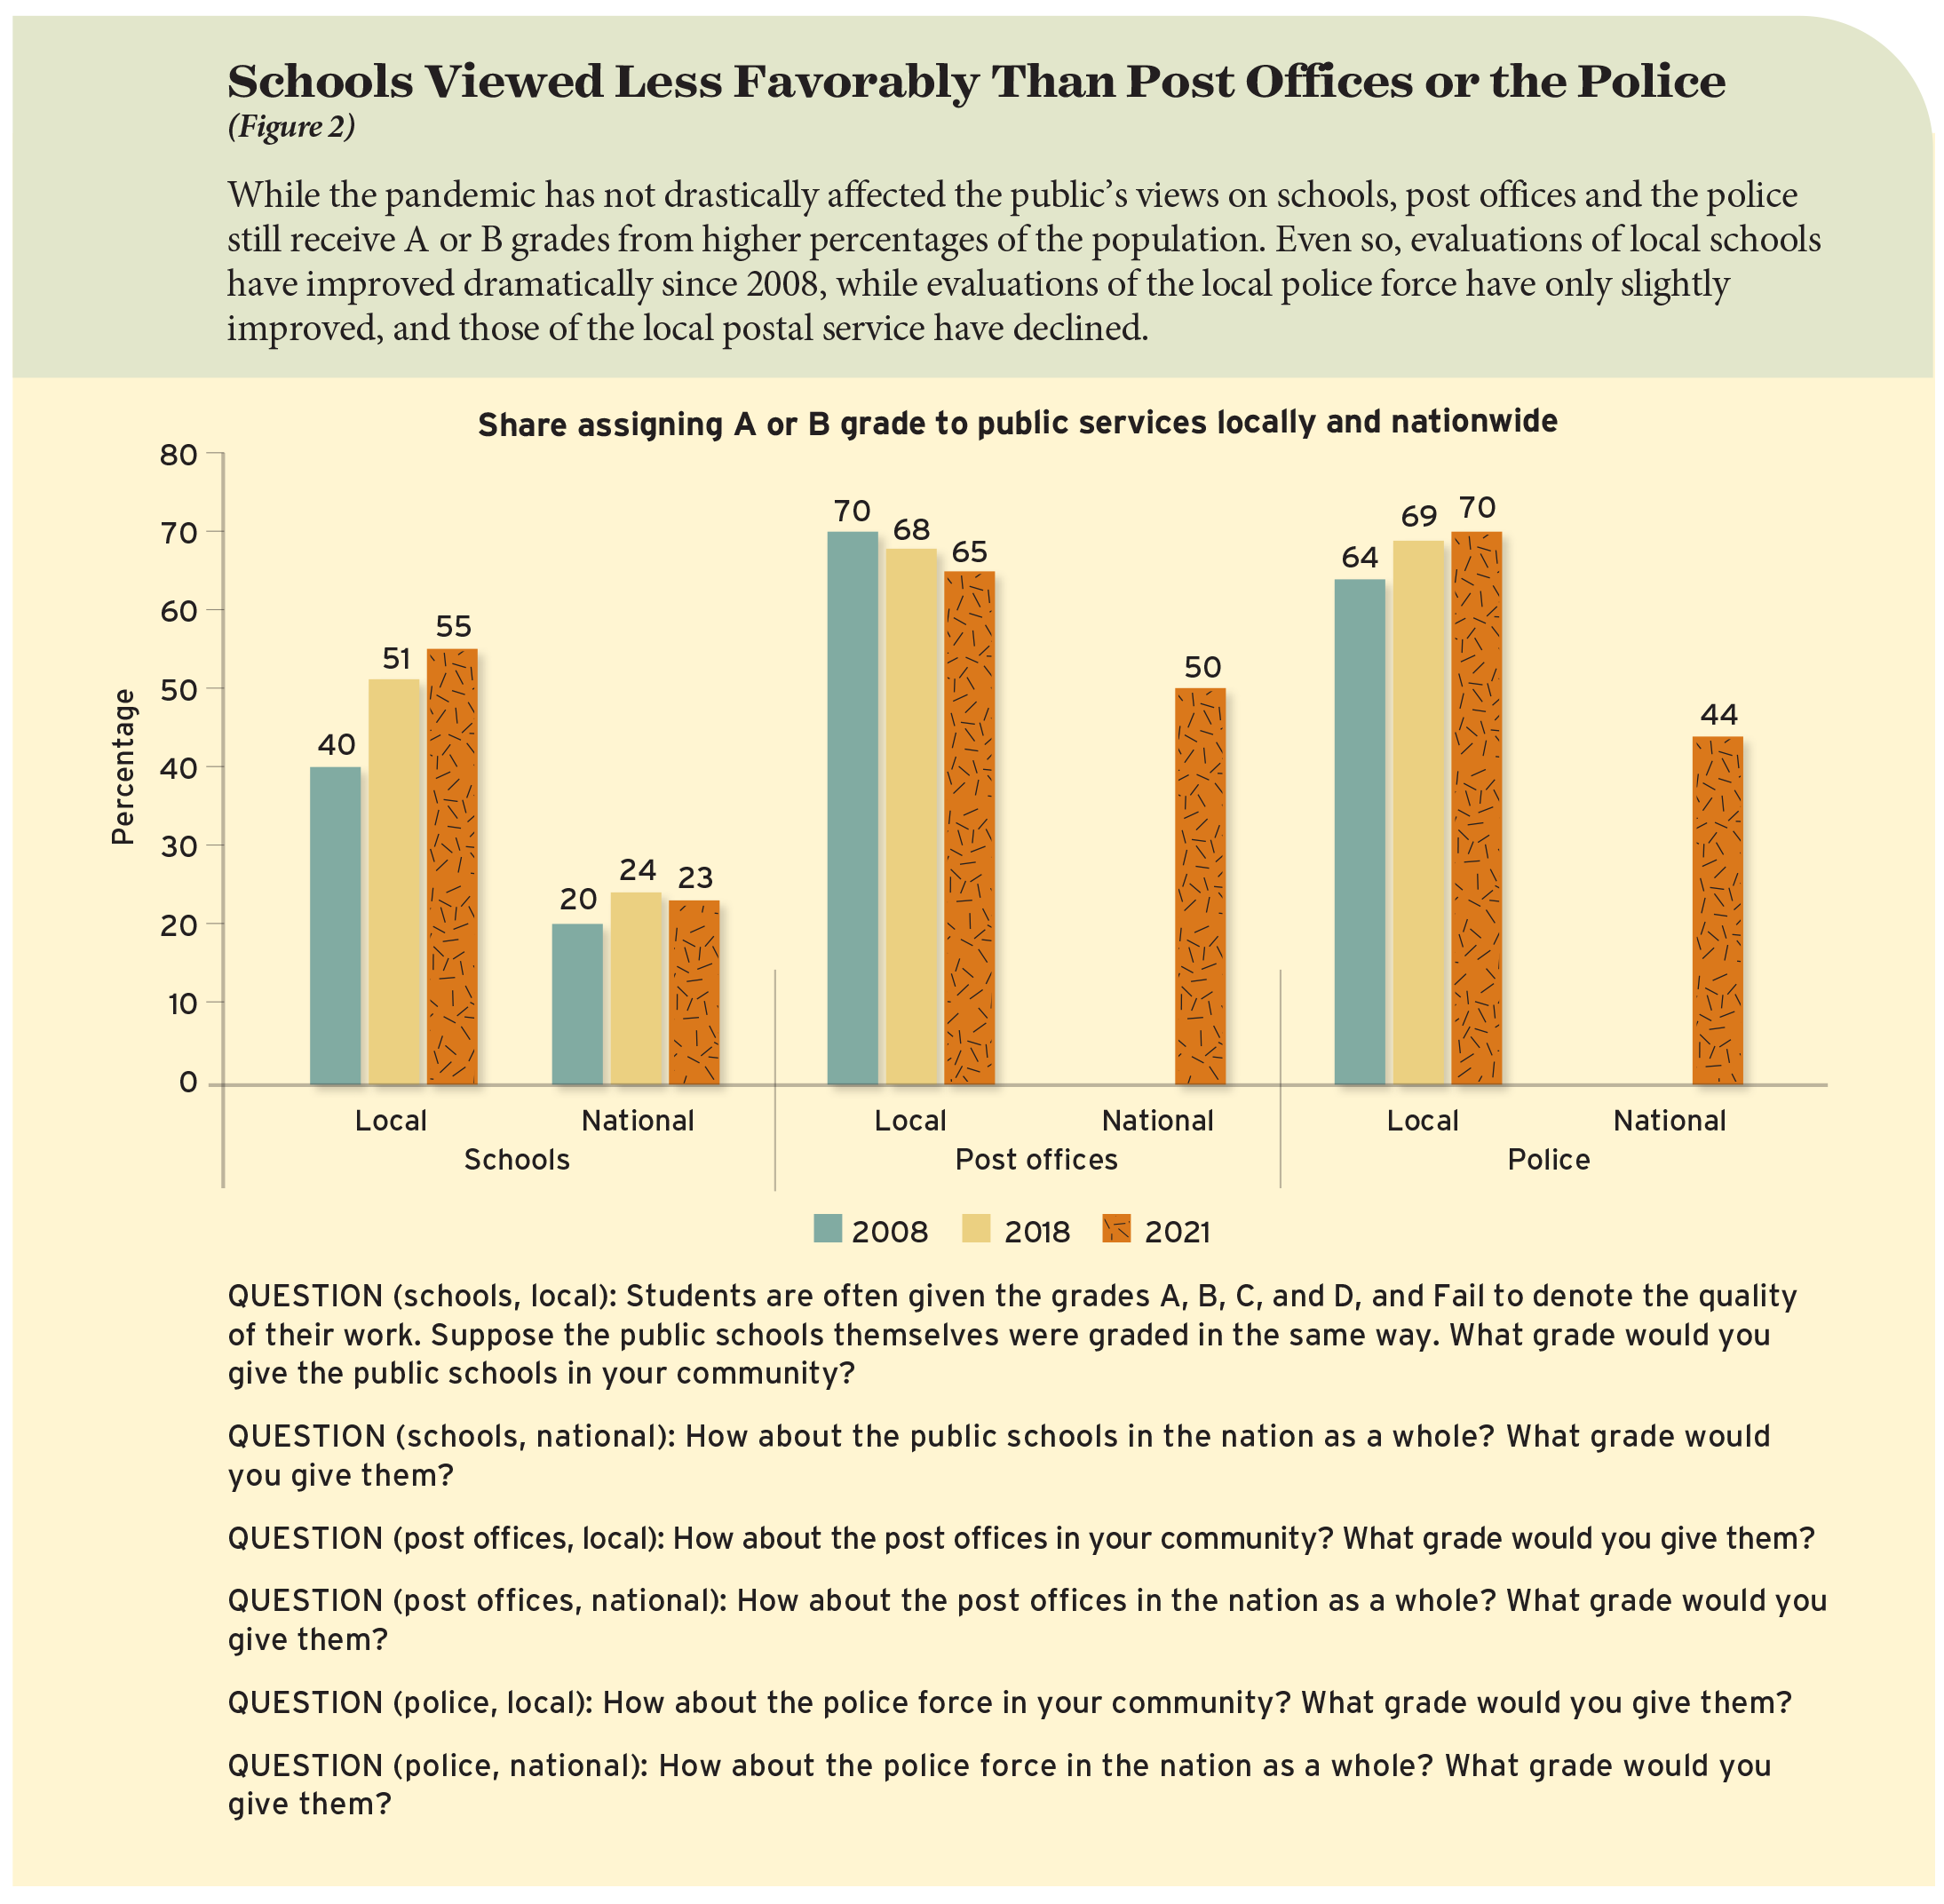
Public schools. The way American public schools have res-ponded to the Covid-19 pandemic has not yet had dramatic effects on what people think about their quality, either in their local communities or across the country. When asked to grade the quality of their local public schools, 55% of respondents give an A or a B (see Figure 2). This approval percentage falls about midway between the 2019 peak (near 60%) and the 51% who gave A or B grades in 2018. It is well above the 40% of respondents giving local schools these “honor roll” grades in 2008.
When asked to grade public schools across the country, survey participants are more critical. Twenty-three percent give an A or a B grade in spring 2021. That share is lower than the percentage giving these grades in spring 2020 (30%) but about the same as in 2018 (24%) and higher than in 2008 (20%).
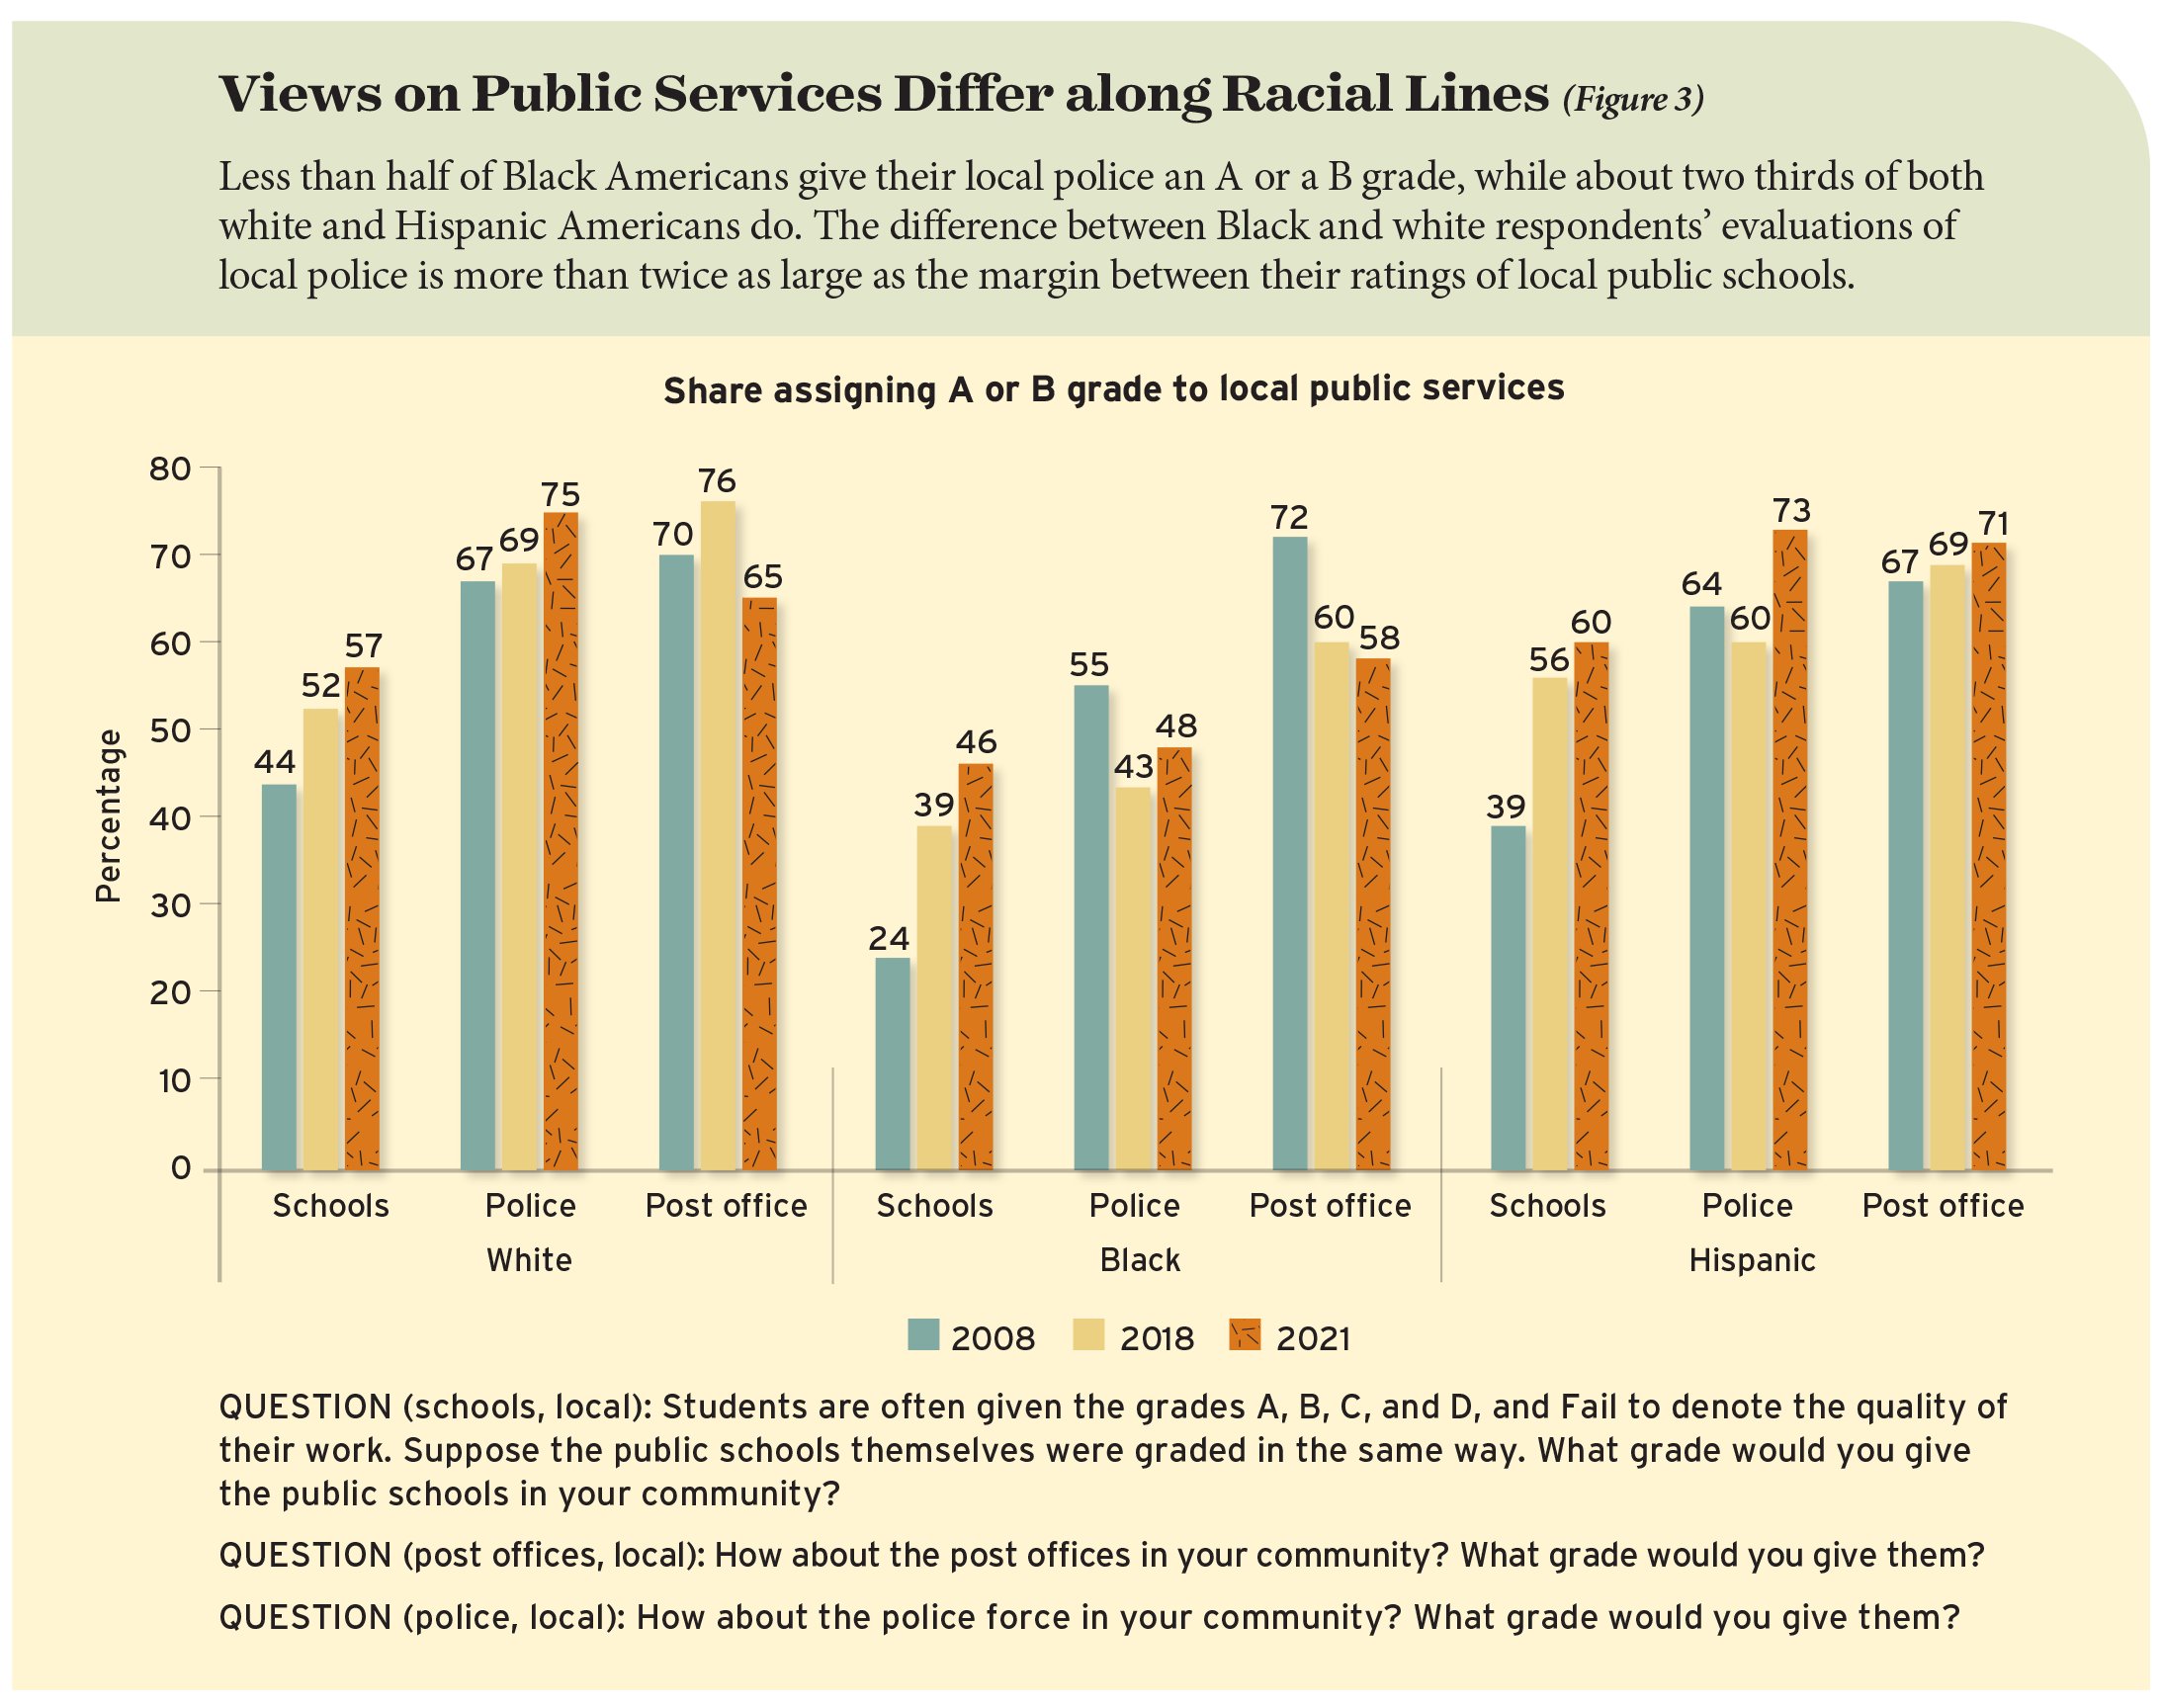
Assessments of schools within ethnic groups have changed over time (see Figure 3). Among Black respondents, the percentage giving schools in their community an A or a B increased to 46% in 2021 from 24% in 2008, registering a jump of 22 percentage points. Among Hispanic respondents, the increase is to 60% from 39%, amounting to a rise of 21 percentage points. Among white respondents, the upward climb is to 57% from 44%, representing a smaller though still sizable increment of 13 percentage points. Black Americans remain more skeptical of local schools than either Hispanic or white Americans, though this difference across groups is considerably smaller in 2021 than it was 13 years ago.
When it comes to rating schools nationally, Hispanic Americans give out the highest marks. Forty-four percent say the nation’s schools deserve either an A or a B, up from 23% in 2008. That upward jump is not matched among either of the other two major ethnic groups, who continue to assign much lower grades to the nation’s schools. Twenty-four percent of Black respondents and 18% of white respondents are willing to put the nation’s schools on the honor roll.
In Short: We see some fluctuation in public assessments over the years, but evaluations of public schools in 2021 are very close to what they were a year ago and just prior to the pandemic.
Teachers unions. Teachers unions have been actively engaged in conversations about when and how to reopen schools. What impression have their actions left on the public’s views of teachers unions, both in the context of the pandemic and more generally? We asked respondents 1) if teachers unions made it easier or harder to open schools both in their own community and across the country, and 2) whether teachers unions had a “generally positive” or “generally negative” impact on schools.
With respect to the first question, the public seems reluctant to draw strong conclusions. A plurality of Americans (50%) say unions made it neither easier nor harder to reopen schools in their community. Perhaps the respondents in this group perceive unions as neutral in this context, or maybe they are simply unaware of what the unions did locally to help or hinder reopening. Still, just 15% of survey takers say that unions made it easier for local schools to reopen, while more than twice as many (35%) think they made it harder.
Opinion looks similar when we consider parents only: 34% indicate unions made it harder for local schools to reopen; 22% say they made it easier; and 45% report they made it neither easier nor harder. Perhaps surprisingly, teachers are most likely to say that unions hindered reopening efforts in their local communities. A plurality (43%) say unions made it harder for local schools to reopen, while 18% say they made it easier.
The public sees more evidence of union resistance to reopening when viewing their actions across the country. When asked about teachers-union activity nationwide, 48% of American adults think the unions made it harder for schools to reopen and 12% say they made it easier. Parental views are similar. As for teachers themselves, 41% report that unions made reopening more difficult across the nation, though 28% think the unions made it easier.
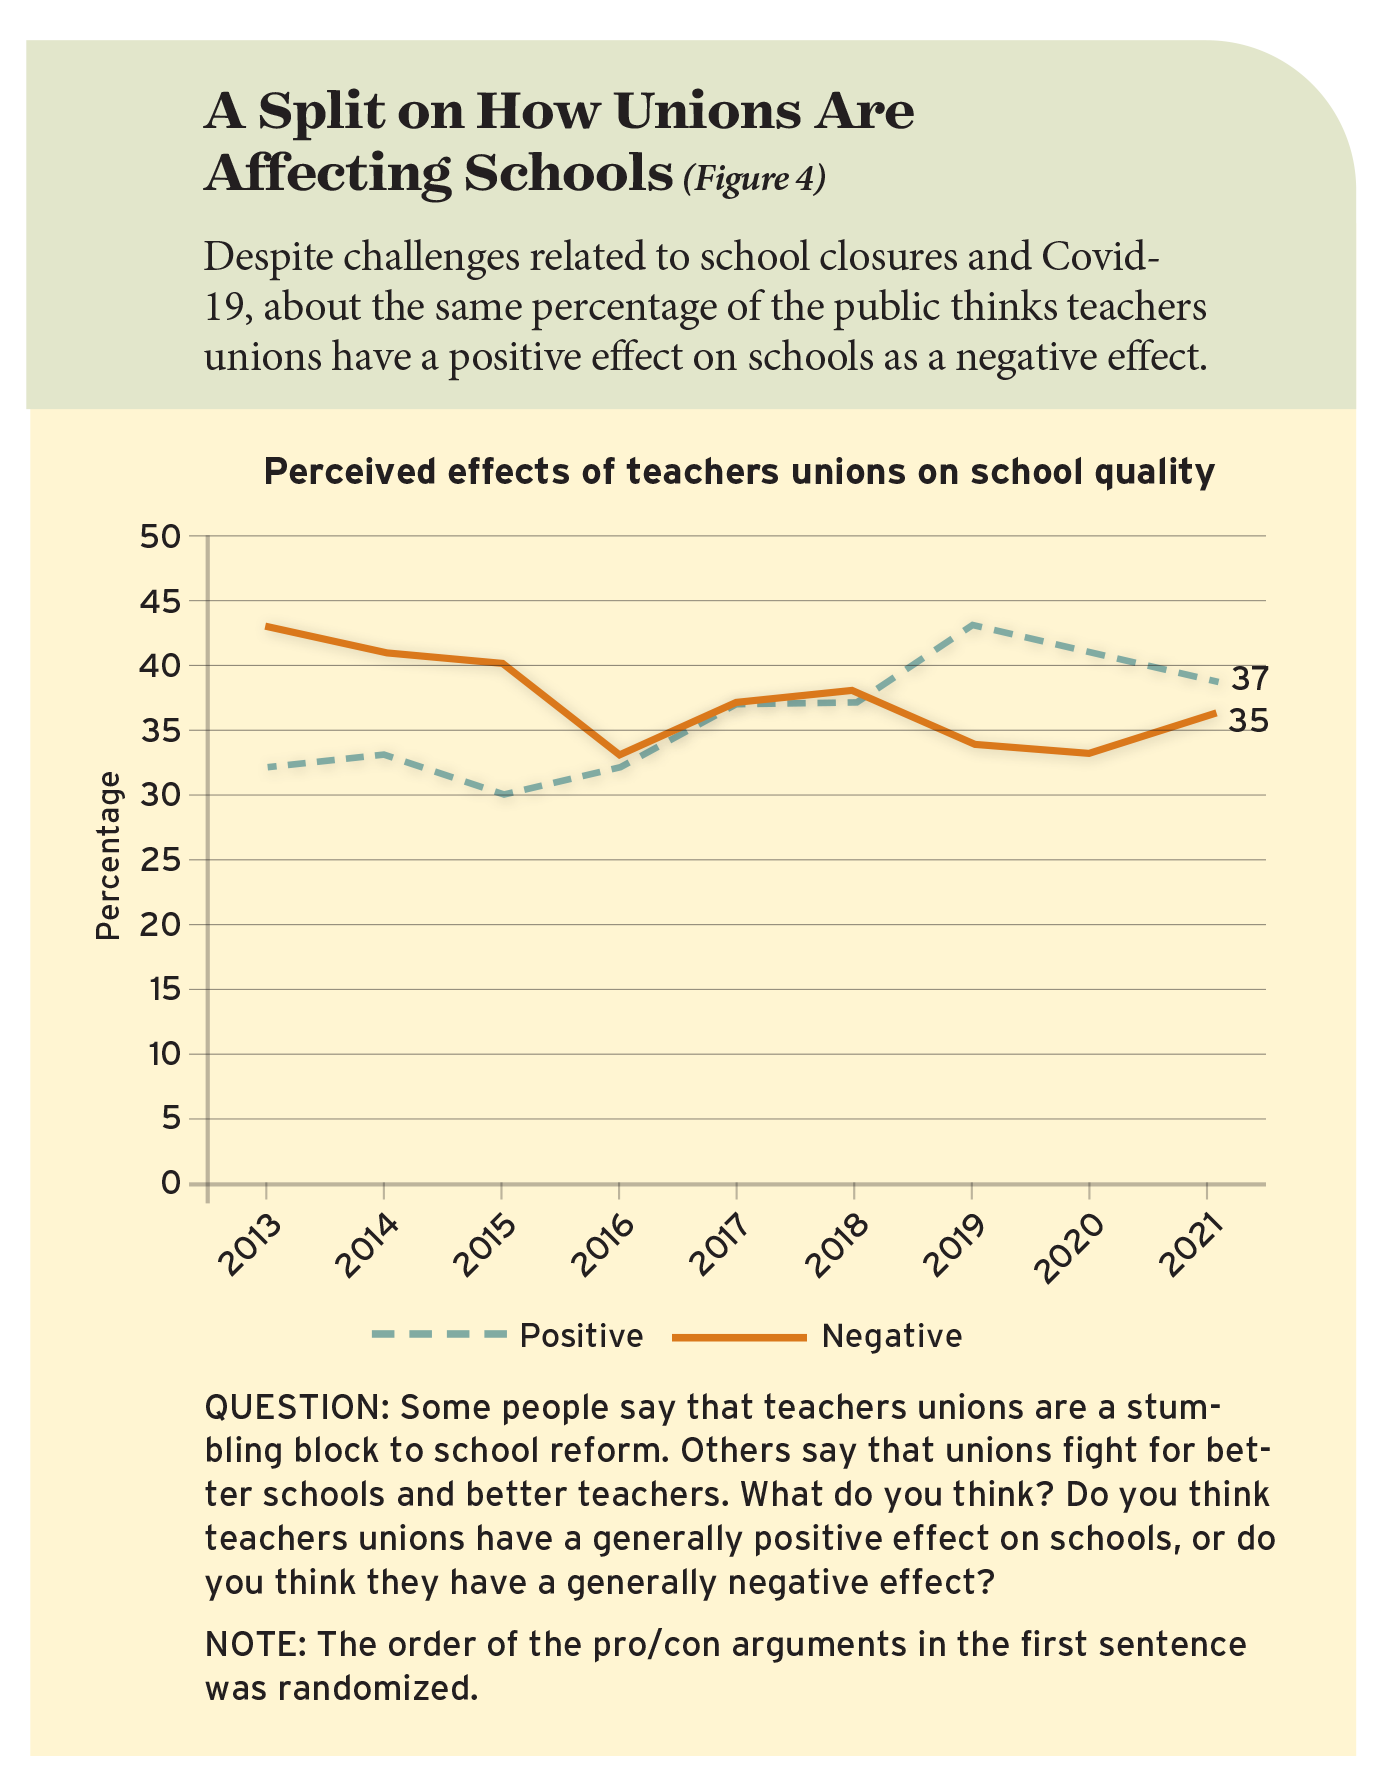
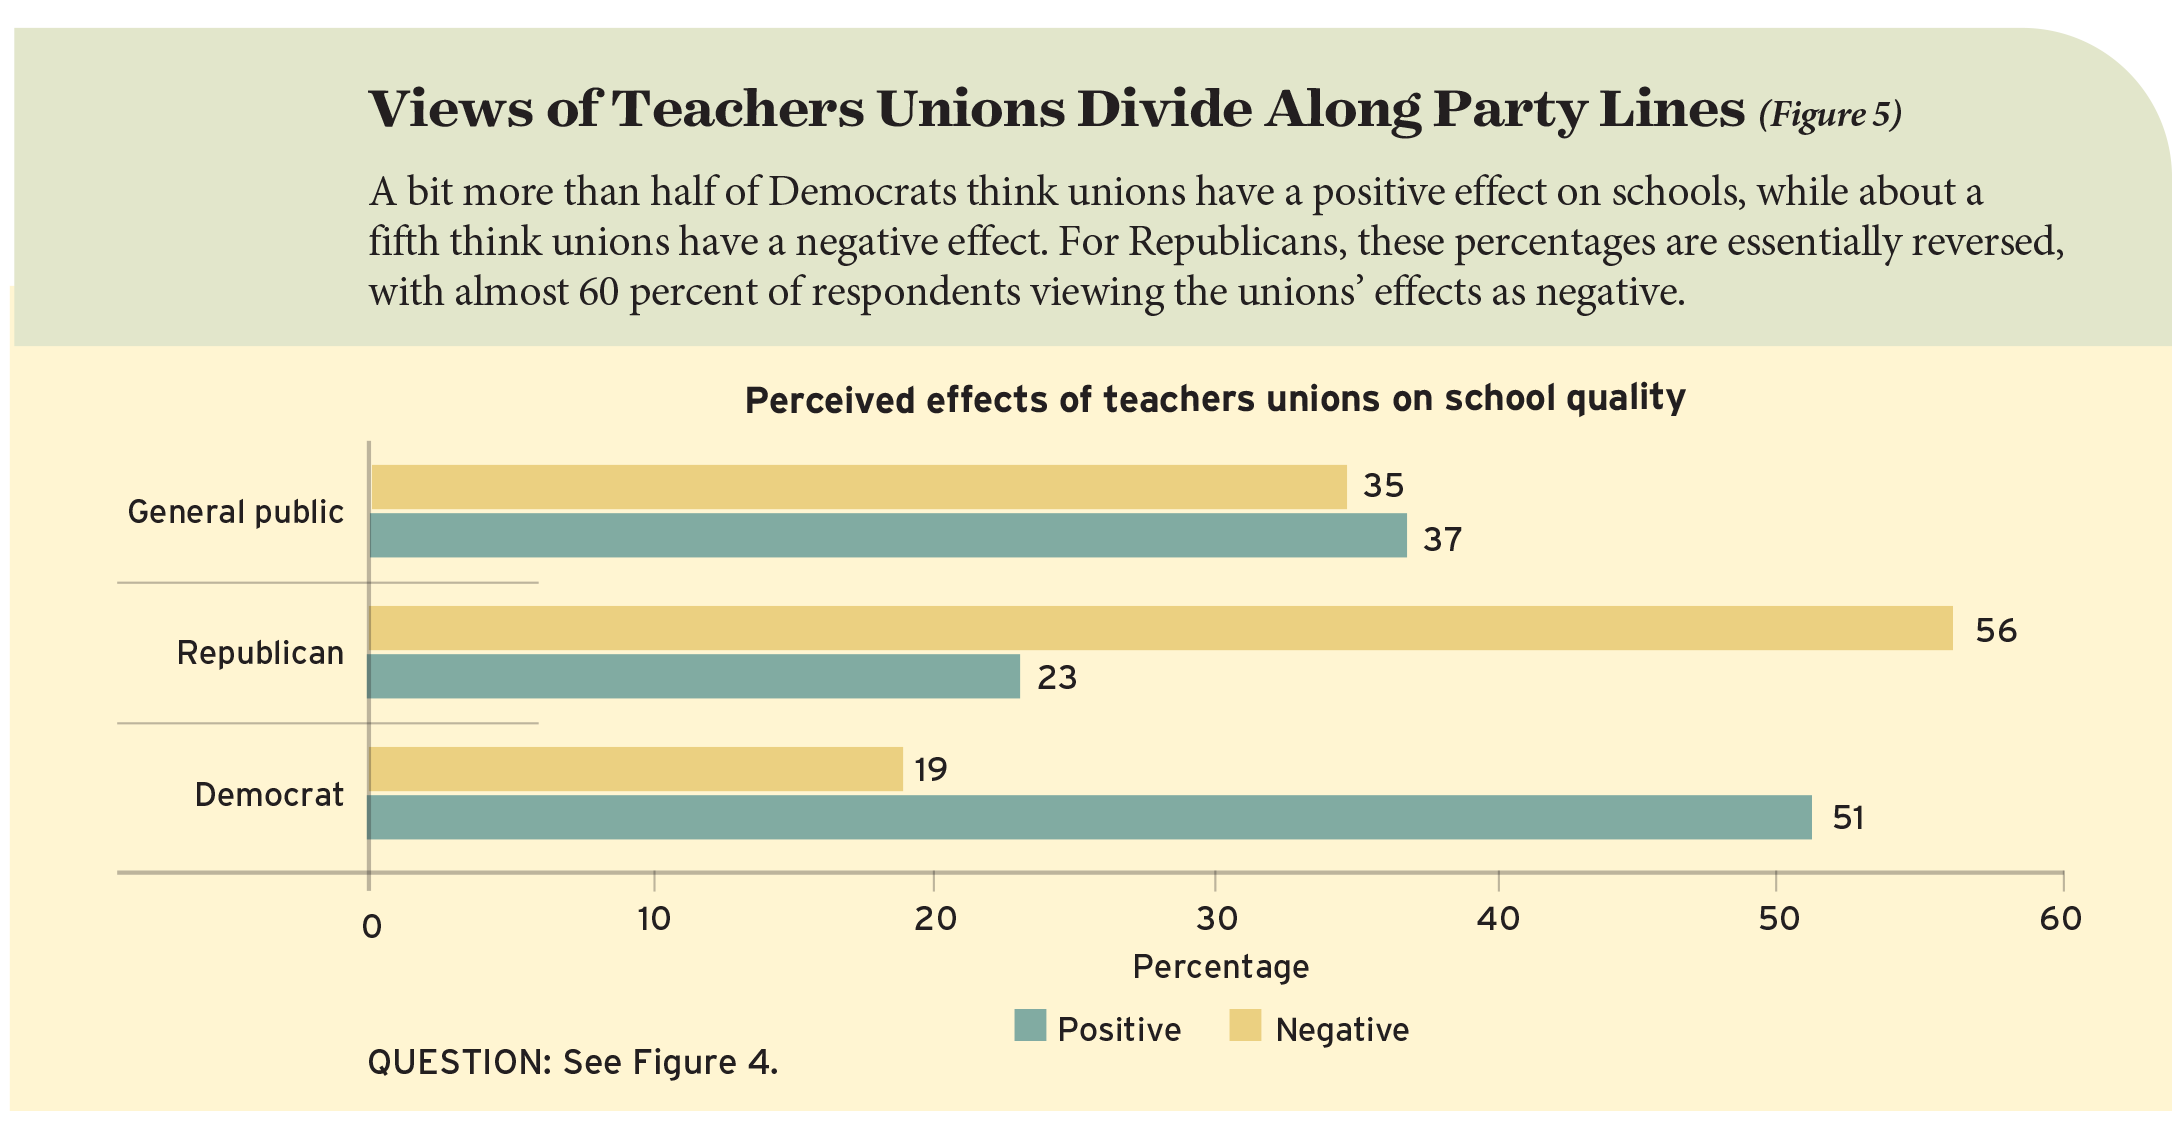
Although many Americans believe that teachers unions made it harder for the nation’s schools to reopen, overall impressions of unions’ effects on school quality have not changed by a significant amount. Respondents split almost evenly on this question. Thirty-five percent say unions have a positive effect on schools, and 37% say they have a negative effect, with the rest undecided. When asked a longer version of this question that includes arguments people often make for or against unions, these numbers are very similar: 37% positive, 35% negative (see Figure 4). Democrats’ views of teachers unions are more positive than those of Republicans (see Figure 5). Half of Democrats say teachers unions have a positive effect on school quality, and 20% say they have a negative effect. These numbers are nearly the reverse for Republicans. Fifty-eight percent of them think teachers unions have a negative effect, with 17% believing they have a positive effect.
In Short: A large share of parents and the public say unions neither hindered nor helped the reopening of local schools, with more teachers responding that unions made it more difficult for local schools to open. Both parents and the general public see teachers unions nationwide as complicating the task of reopening schools, but this has not noticeably altered views on how teachers unions influence school quality.
Postal service. As mentioned earlier, the 2021 poll asked survey participants to grade their local post office as well. Unlike the upward trend for schools between 2008 and 2021, the trend for the post office is slightly downward, from 70% in 2008 to 68% in 2018 and 65% in 2021.
In 2021 (but not in earlier years) we also asked respondents to evaluate the post office in the nation “as a whole.” Half of respondents give an A or a B to post offices across the country, 15 percentage points less than the share willing to award these honor-roll grades to the post office in their community. The national-local difference is less than half that for the grading of schools, where the margin between national and local assessments is 32 percentage points. It could be that the public receives less negative information about post offices than about schools nationwide, which could account for the smaller disparity in ratings of the postal service. But the smaller local-national gap might also reflect the generally more positive assessment of post offices than schools in both contexts. The percentages giving one of the top two grades to the community’s post office run 10 percentage points higher than for local public schools and 27 percentage points higher for postal than educational services nationwide.
Partisan differences in assessments of the post office are not as large as for the nation’s schools. Sixty-two percent of Republicans award an A or a B to local postal service, as compared to 68% of Democrats. For post offices across the country, the percentages are 46% and 54% for the two parties, respectively.
Postal-workers unions command modestly more respect among the American public than do teachers unions. A plurality (39%) say postal unions have a positive effect on the quality of postal service, while 29% say they have a negative effect.
Police. Despite the negative press coverage directed at police in recent years, evaluations of the “police force in your local community” improved somewhat between 2008 and 2021. The percentage giving an A or a B rose from 64% in 2008 to 69% in 2018 to 70% in 2021. For ratings of the police force nationwide, we are unable to make similar comparisons over time, but in 2021 we found a major gap of 26 percentage points in evaluations of the police, depending on whether the focus was on the local level or on the nation’s police. Seventy percent of Americans grade their local police force with an A or a B as compared to 44% giving these honor-roll grades to the “police force in the nation as a whole.” That is not dramatically different from the gap between assessments of local schools and schools across the country. But at both national and local levels, police receive higher evaluations than those given to schools. The share of the public giving one of the two top grades to local police is 15 percentage points higher than for local public schools and 21 percentage points higher for the police force nationwide than for schools nationwide. Yet police unions are less well respected than teachers organizations. A 40% plurality of the public thinks police unions have a negative effect on the quality of policing, while 30% believe they have a positive effect.
Further, sharp differences over policing have emerged across both ethnic and partisan divides. Among Black Americans, 48% give local police forces an A or a B grade, down from 55% in 2008. By comparison, 75% of white survey participants put police on the A–B honor roll, up from 67% in 2008. In other words, the racial divide with respect to the police increased by 15 percentage points. Meanwhile, Hispanic American evaluations of the police—73% of them give an A or a B—are little different from those of white Americans and are up 9 percentage points from their 2008 level of 64%.
The difference between Black and white respondents’ evaluations of local police (27 percentage points) is more than twice as large as the margin between their ratings of local public schools (10 percentage points). The discrepancies are even starker when considering opinions of police forces across the country. Just 15% of Black Americans award an A or a B grade to police forces nationwide, while 51% of white and 48% of Hispanic respondents do. By 9 percentage points, a smaller share of Black Americans give the nation’s police force one of the two high grades than do so for the nation’s schools, but a larger share of white Americans are willing to assign one of these honor-roll grades to the police than to the schools—by a margin of 26 percentage points. In a nutshell, Black Americans are more critical than others of the nation’s police, white Americans are more skeptical than others of the nation’s schools, and Hispanic Americans grant both schools and police quite similar evaluations, with 44% and 48% willing to award an A or a B to the nation’s schools and police forces, respectively.
In Short: Schools receive lower evaluations than do either the police force or the post office—both when survey takers offer assessments of operations in their local community and when they size up these services on the national scene. But evaluations of local schools have improved substantially since 2008, while evaluations of the local police force have barely ticked upward, and assessments of local postal service have drifted downward. In all cases, survey participants are more likely to give higher grades to public services when asked about them in a local rather than a national context. Yet the size of the local-national gap is not uniform across services. For schools, the gap in 2021 is 32 percentage points, for police it is 26 points, and for post offices it is 14 points. This variation suggests that more is involved than the tendency to favor the familiar over the distant. Very likely, differences are a function of more-extensive negative media coverage given to the nation’s schools and police forces than to the postal service. It is also possible that people simply think the post office delivers higher-quality services than either the police or the schools do, though that theory does not account for the slip in public ratings of postal services since 2008.
Colleges and universities. We also asked survey participants to grade public and private colleges and universities in their state (not every local community has a college or university) and across the country. Both public and private colleges fare better than public K–12 schools. Seventy percent of respondents give public colleges and universities in their state an A or a B grade (15 percentage points higher than for local public K–12 schools), and 57% award one of these honor-roll grades to public colleges and universities across the country (34 percentage points higher than public K–12 schools). Americans rate private colleges in their state similarly to public colleges; 74% give private institutions an A or a B (19 percentage points higher than for local K–12 public schools). When evaluating higher education on the national scene, they tend to see private colleges as better than public colleges. Sixty-five percent give private institutions nationally an A or a B (42 percentage points higher than for public K–12 schools).
Partisan Divide
Survey participants are divided along party lines in both their assessments of educational institutions and their opinions about education policy. Republicans tend to be more critical of schools and colleges on the national level. They are also likelier to embrace merit pay for teachers, charter schools, and universal-voucher programs. Democrats are more favorably inclined than Republicans toward boosting school expenditure levels, lifting teacher salaries, and offering free preschool and college. Moreover, partisan differences on several (but not all) of these topics seem to be expanding.
Evaluating schools and colleges. In assessments of local K–12 schools, for instance, a new partisan gap has emerged. In 2019, 59% of Democrats said their community’s schools deserved either an A or a B, compared to 62% of Republicans. Two years later, 51% of Republicans award honor grades to their local schools while Democrats hold steady at 59%. Assessments of schools “in the nation as a whole” are not nearly as positive and are even more divided across party lines. In 2019, 20% of Republicans and 26% of Democrats gave America’s schools one of the two high grades. In 2021, those percentages are 17% and 28%, enlarging the partisan divide by 5 percentage points.
Public evaluations of four-year institutions of higher education are considerably more positive than views of elementary and secondary schools, but a partisan divide is nonetheless apparent. In 2019, 81% of Democrats but 73% of Republicans gave four-year colleges and universities within their state an A or a B. In 2021, that division deepens. Only 62% of Republicans, as compared to 77% of Democrats, are willing to assign in-state four-year colleges a top grade, widening the assessment gap by 7 percentage points over the two years. Evaluations of four-year colleges and universities in the nation as a whole reflect even greater partisanship, with 46% of Republicans but 67% of Democrats awarding them an A or a B. However, the size of the divide did not change significantly over the past two years.
Assessments of private colleges and universities are somewhat less partisan, but when respondents are asked about these institutions “in the nation as a whole” the differences between Republicans and Democrats widens. In 2021, 74% of Democrats but 56% of Republicans give the nation’s private colleges and universities a grade of A or B, a gap 10 points larger than in 2019. When survey takers are asked about private colleges within the state, partisan differences are smaller: 78% of Democrats and 70% of Republicans hand out one of the two highest grades, leaving the gap essentially unchanged from 2019.
In Short: Evaluations of both schools and colleges are more divided along party lines when respondents are asked about institutions “in the nation as a whole” rather than their local counterparts. Partisan differences are also more dramatic when the survey taker is asked to evaluate public colleges and universities as opposed to private ones.
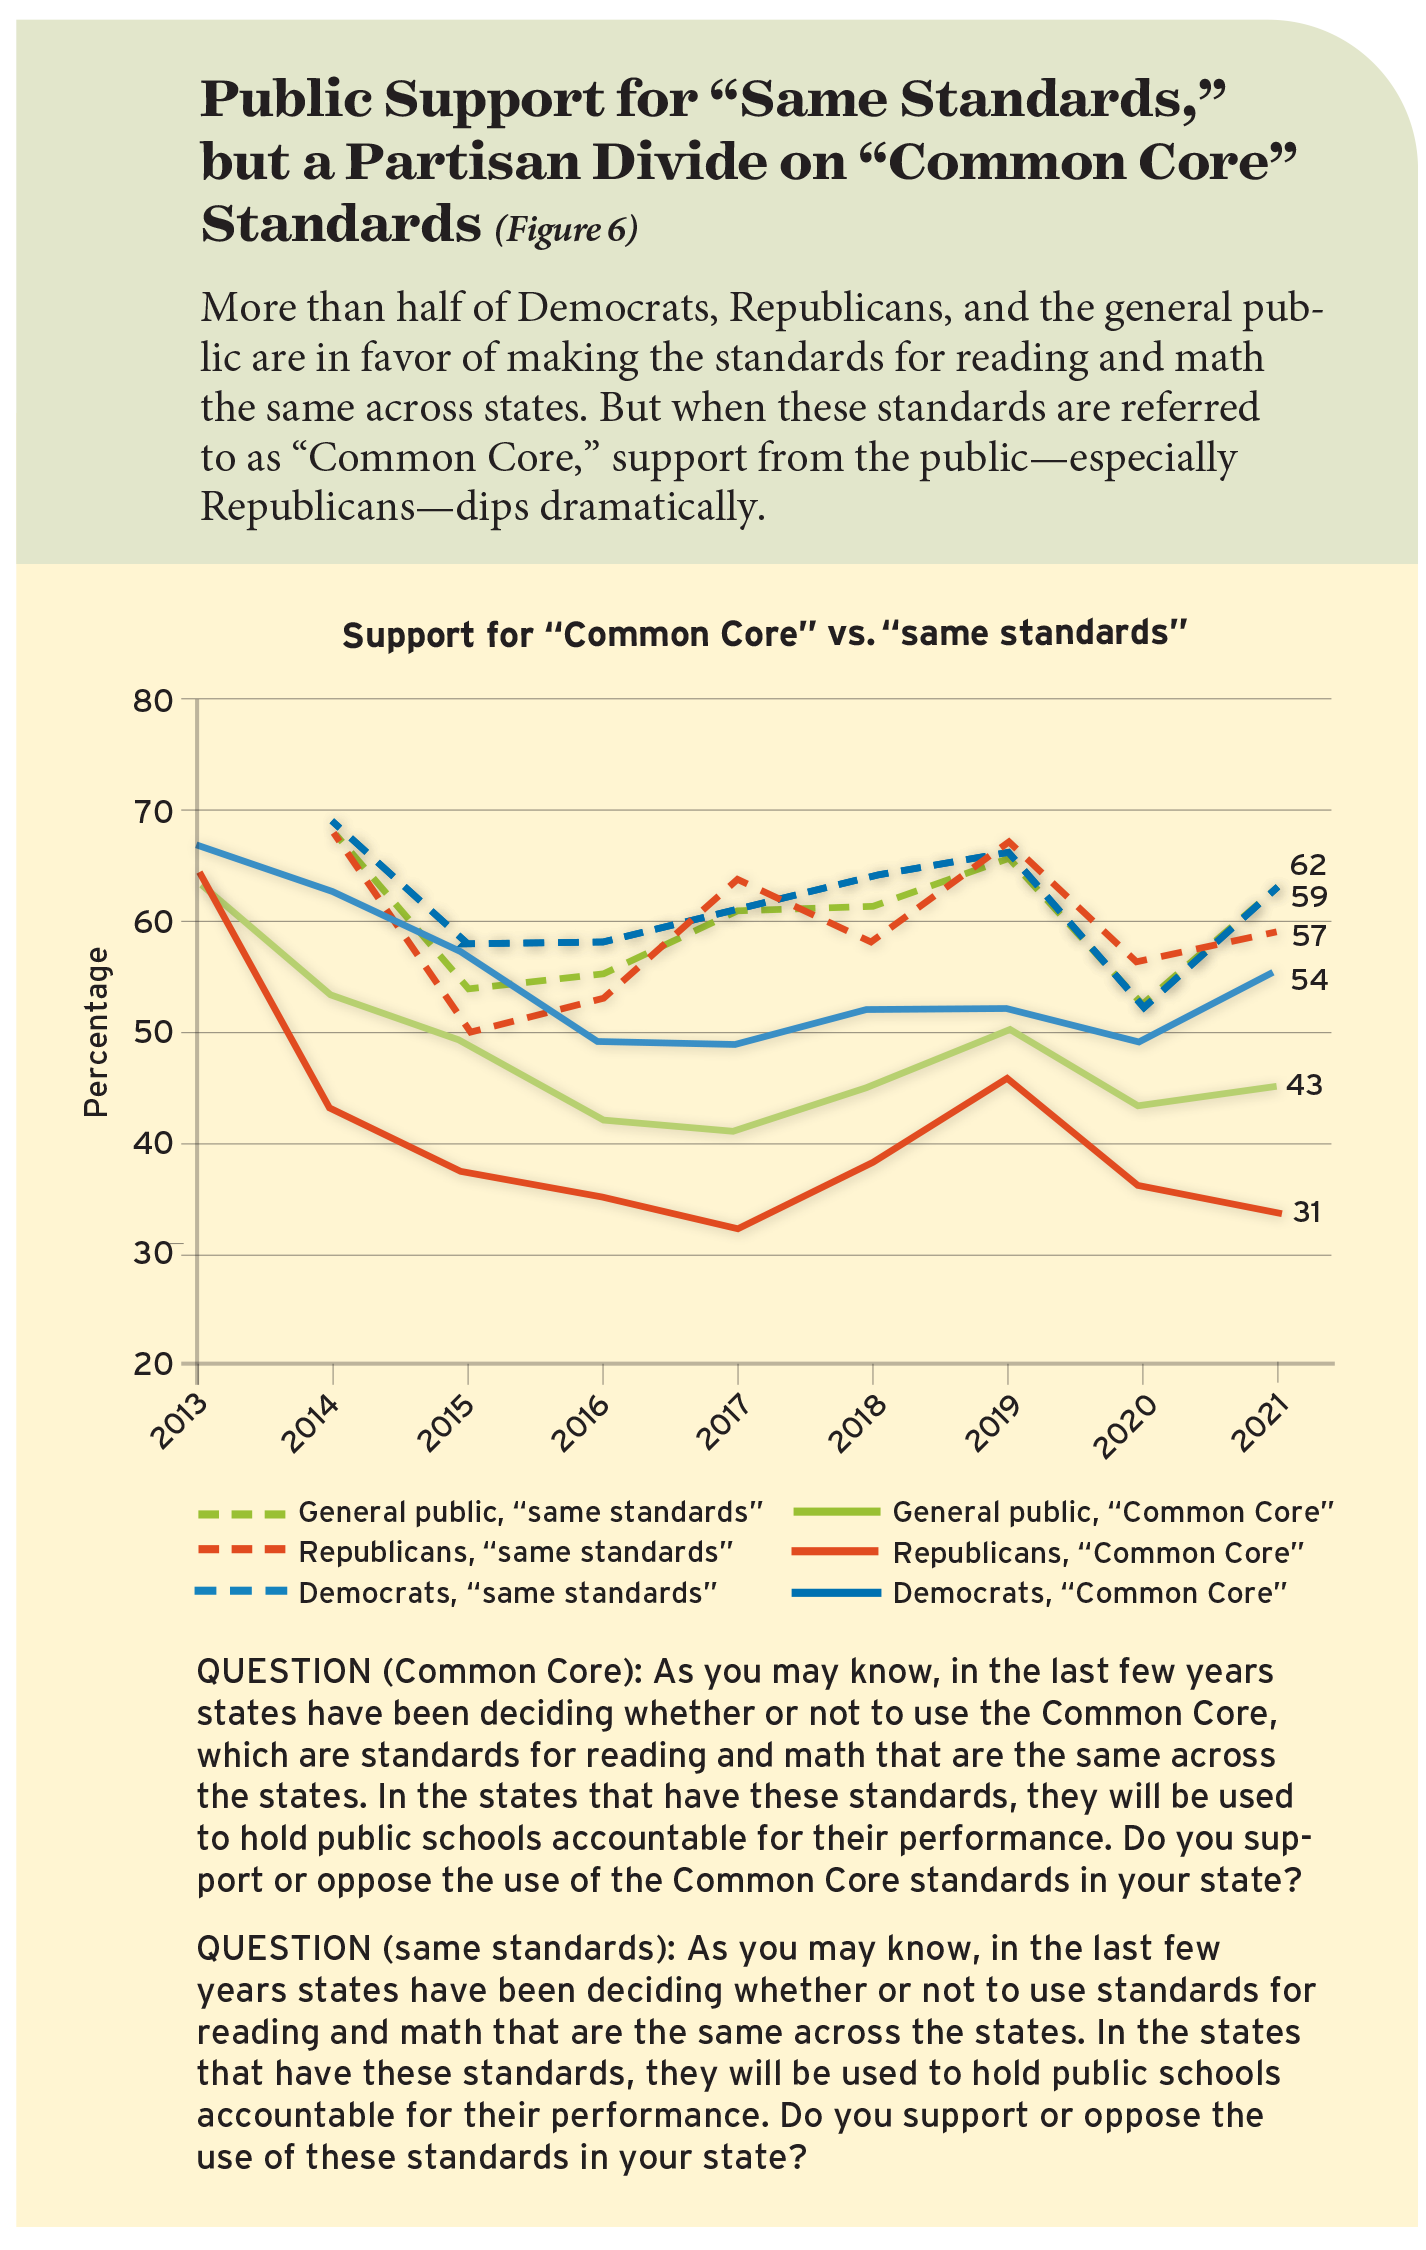
Accountability measures. When it comes to the practice of testing students to hold schools accountable, rank-and-file Democrats and Republicans are in basic agreement. Seventy-two percent of adherents to both parties back the current federal law requiring statewide testing of students in grades 3 through 8 and again in high school. There is less consensus on the Common Core State Standards, however (se Figure 6). The Common Core undertaking was originally bipartisan, and Republican support continued in some quarters even after vigorous criticism by the Trump administration. In 2019, 46% of Republicans, only a few points less than the 52% of Democrats, said they favored the “Common Core, which are standards for reading and math that are the same across the states . . . to hold public schools accountable for their performance.” But now, in 2021, partisan differences are skyrocketing. Only 31% of Republicans, as compared to 54% of Democrats, “strongly” or “somewhat” support Common Core, a 23-percentage-point divide.
The Common Core question was posed to a random half of survey respondents. The other half were asked the same question with the words “Common Core” deleted. By dropping that phrase, we are able to ascertain whether respondents are reacting to the label or to the underlying idea of “standards for reading and math that are the same across the states.” When the question is phrased without reference to Common Core itself, we observe in 2021 higher levels of support and less of a divide between Democrats and Republicans: 62% of Democrats and 57% of Republicans express strong or somewhat strong support for the policy. That level of support is only modestly down from the 66% and 67% levels registered in 2019 on the part of Democrats and Republicans, respectively.
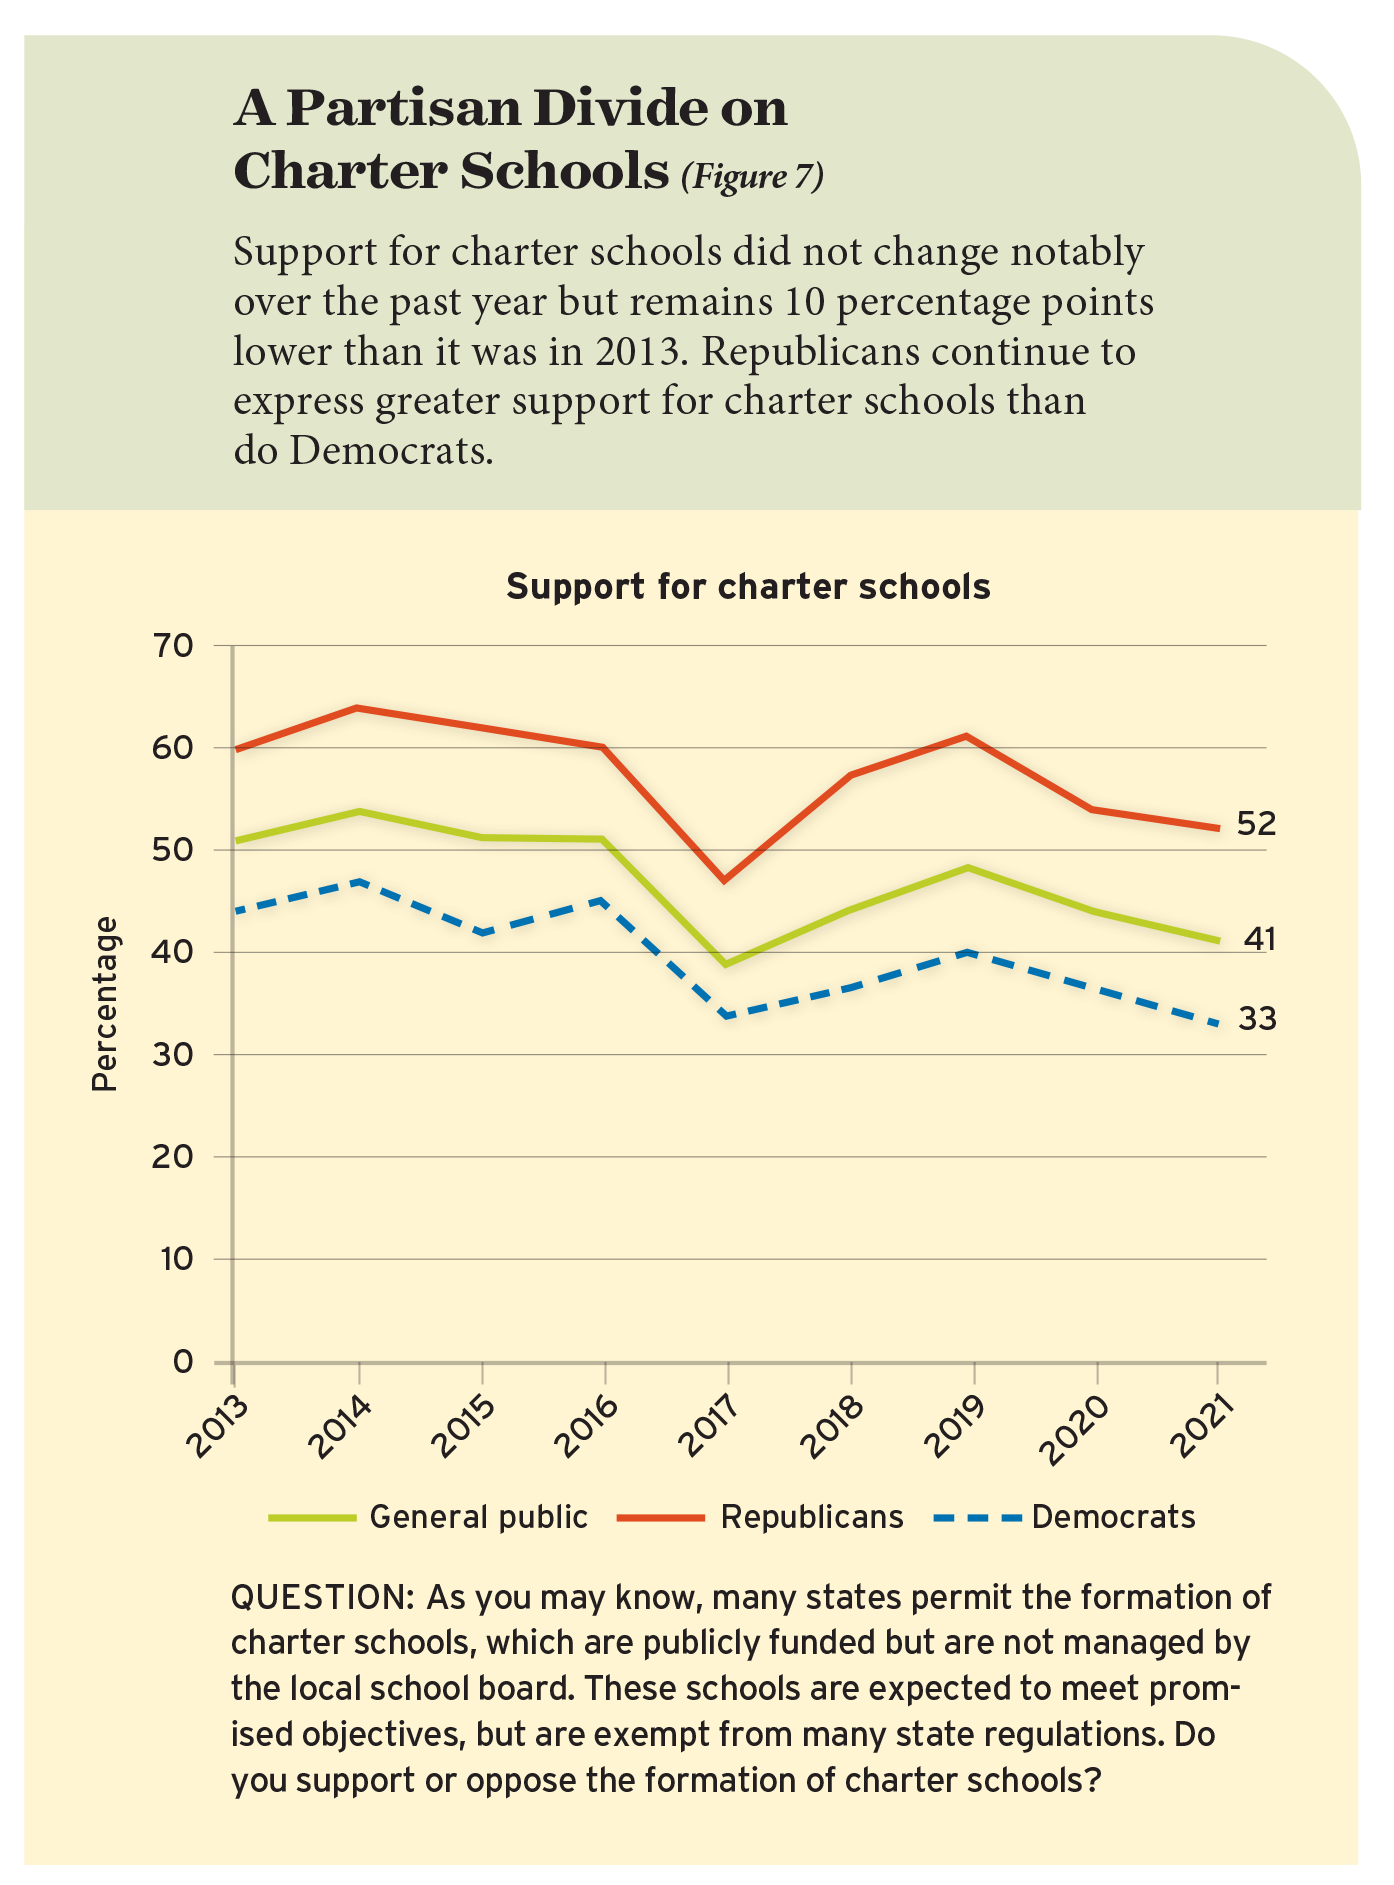
School choice. In Congress and state legislatures, school-choice policy typically evokes a strongly partisan response. Though neither party is completely united on all aspects of school-choice policy, Republican legislators are generally more likely to support choice legislation than are Democratic lawmakers. Among the public at large, the patterns are more complex. Republicans are, as expected, much more likely than Democrats to support charter schools; the tally is 52% to 33%, a difference that is about the same as it was just prior to the pandemic in 2019 and in prior years (see Figure 7). Republicans are also more likely than Democrats to support vouchers for all who wish to attend a private school, 50% to 44% (see Figure 8). But Democrats express more approval for vouchers for students from low-income families, 47% to 38%. Partisan differences have not changed significantly since 2019.
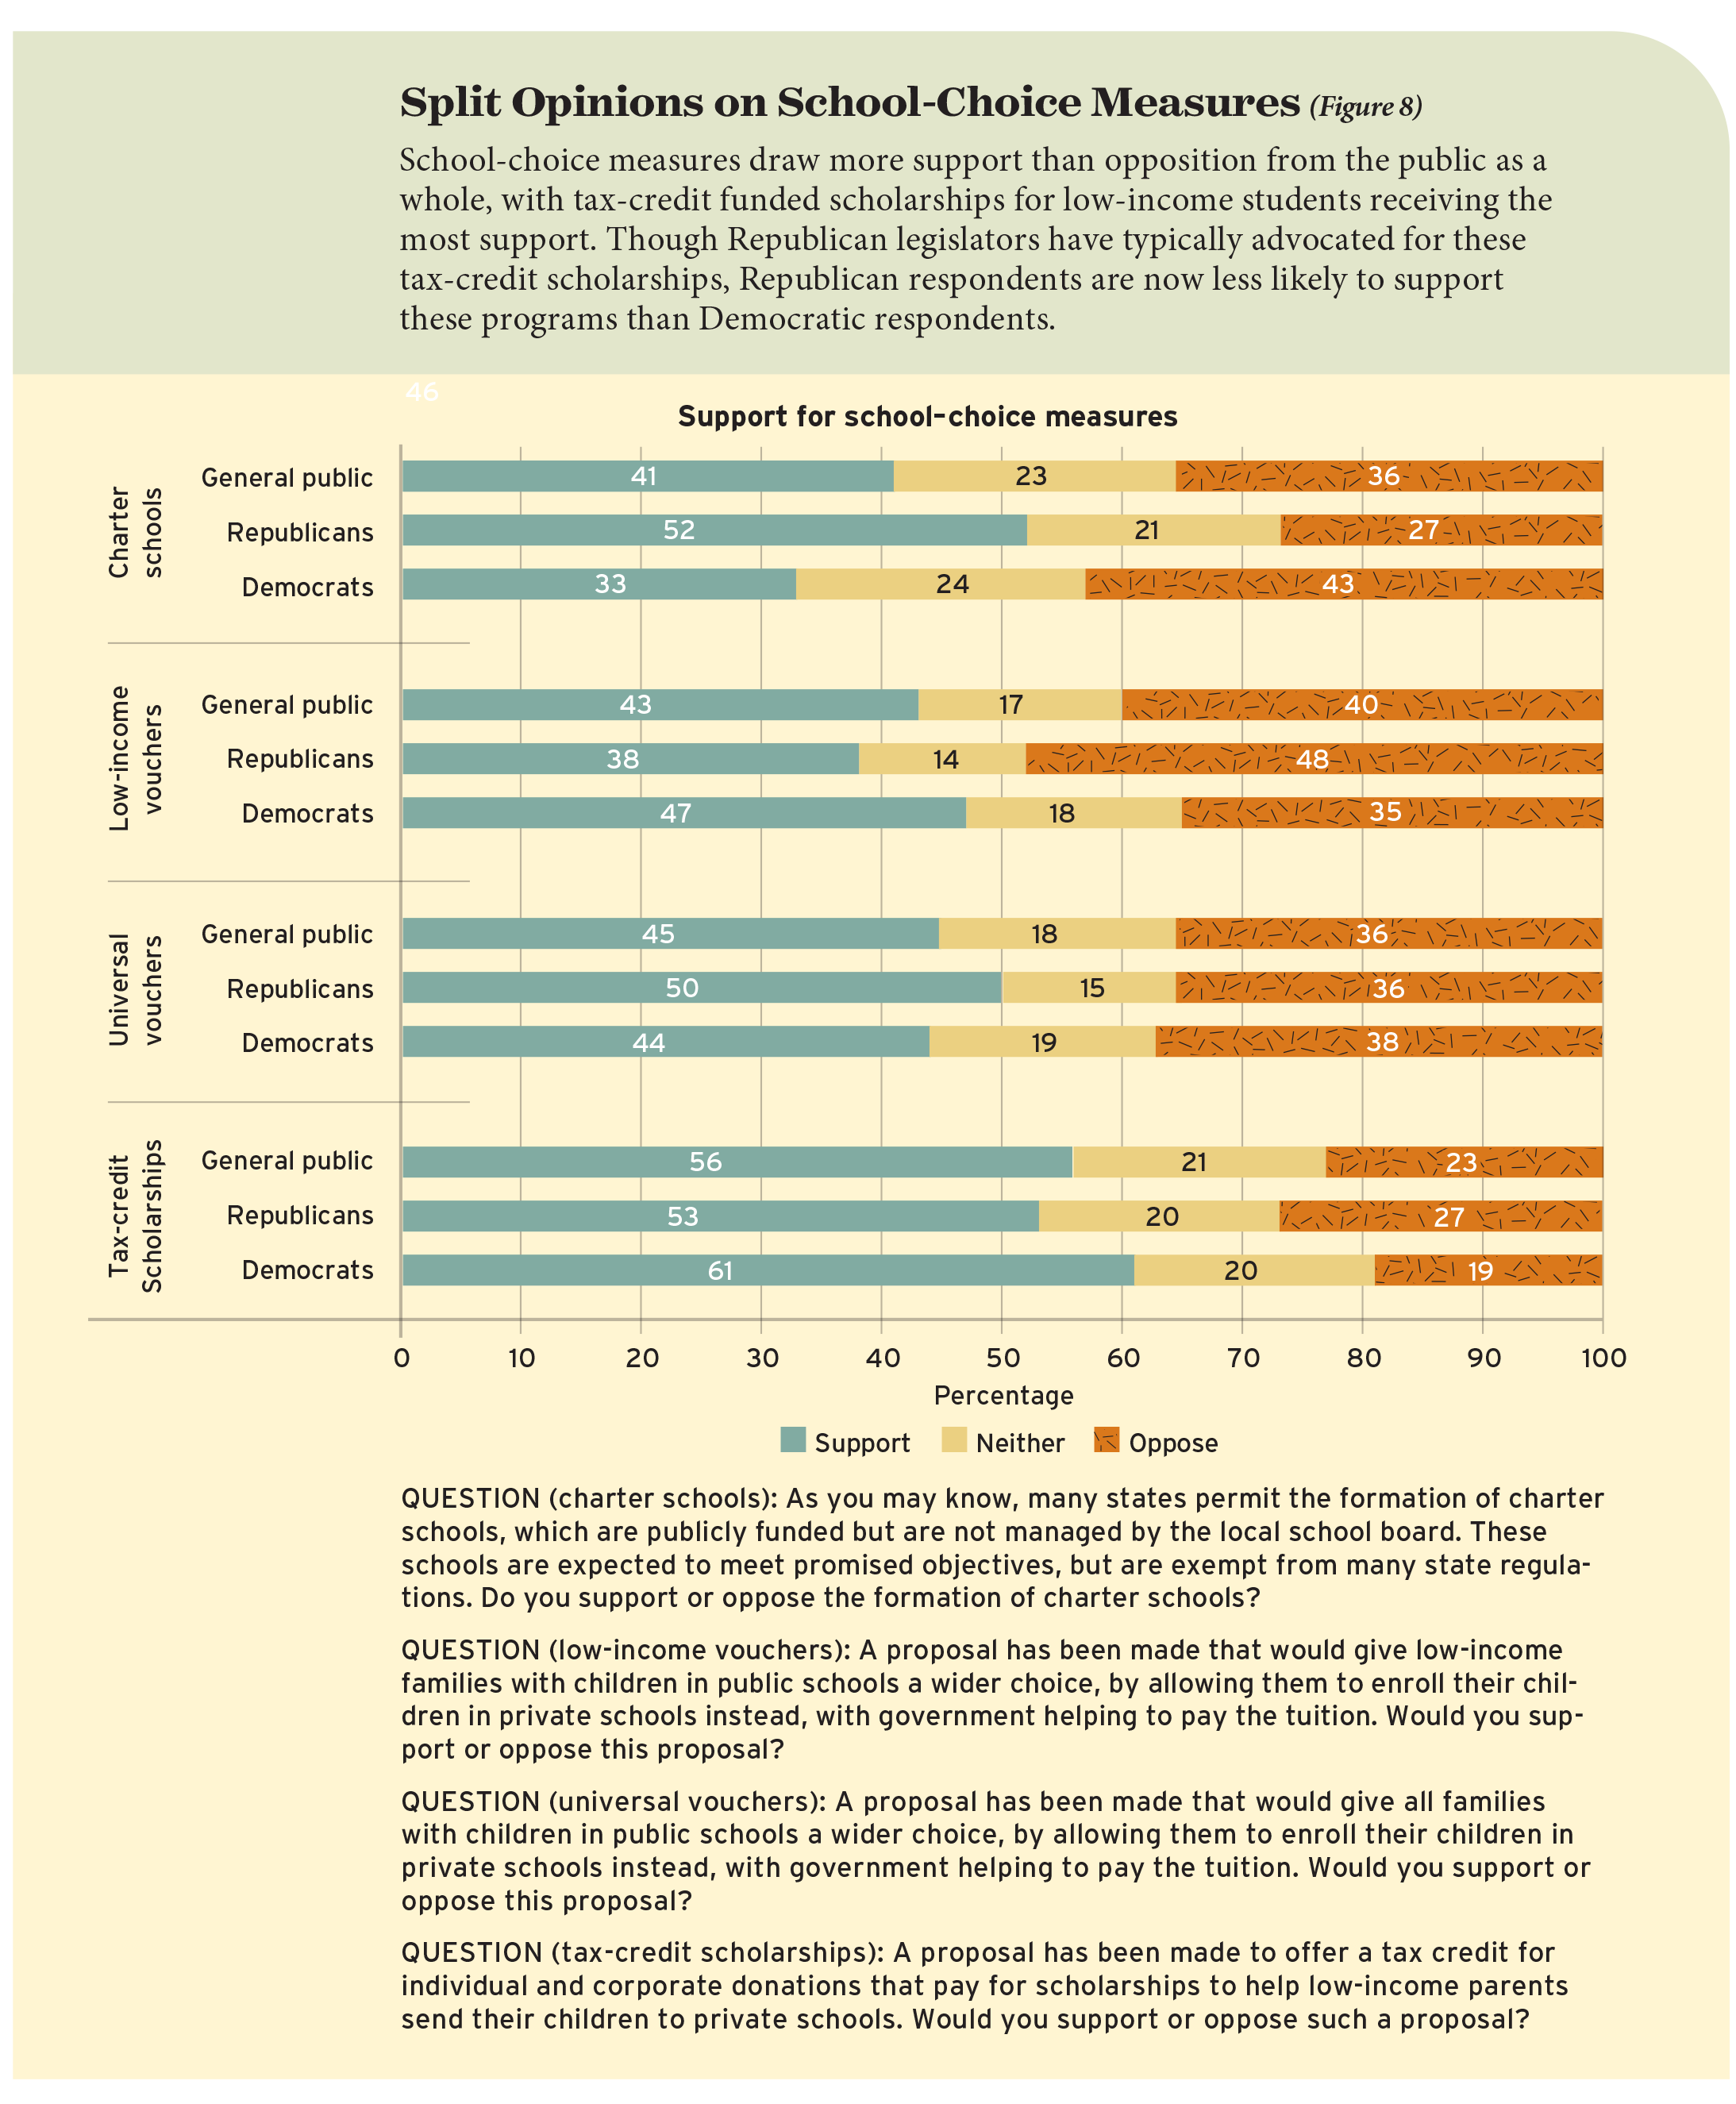
Opinions have shifted across party lines on one school-choice policy—state tax deductions for individual and corporate donations to foundations that give low-income students scholarships to attend private schools. Typically, such programs allow donors to deduct the full amount of their donation from their state tax bill. In 2021, legislatures in several states, including Indiana, Florida, Arkansas, Kansas, Iowa, and Nevada, either enacted or expanded a tax-credit scholarship program. In state legislatures, Republicans have been the most forceful advocates for such programs, yet Republican survey participants are less likely to endorse tax credits than the Democrats are. Among Democrats, support for the idea increased from 56% to 61% between 2019 and 2021, but among Republicans, backing declined from 65% to 53%. President Joe Biden, a Democrat, signed into law congressional bills expanding tax credits for families with children, which could help explain this surprising partisan reversal in partisanship on this topic. Whatever the cause, shifts in public opinion are quite the opposite of legislative trends in state capitals.
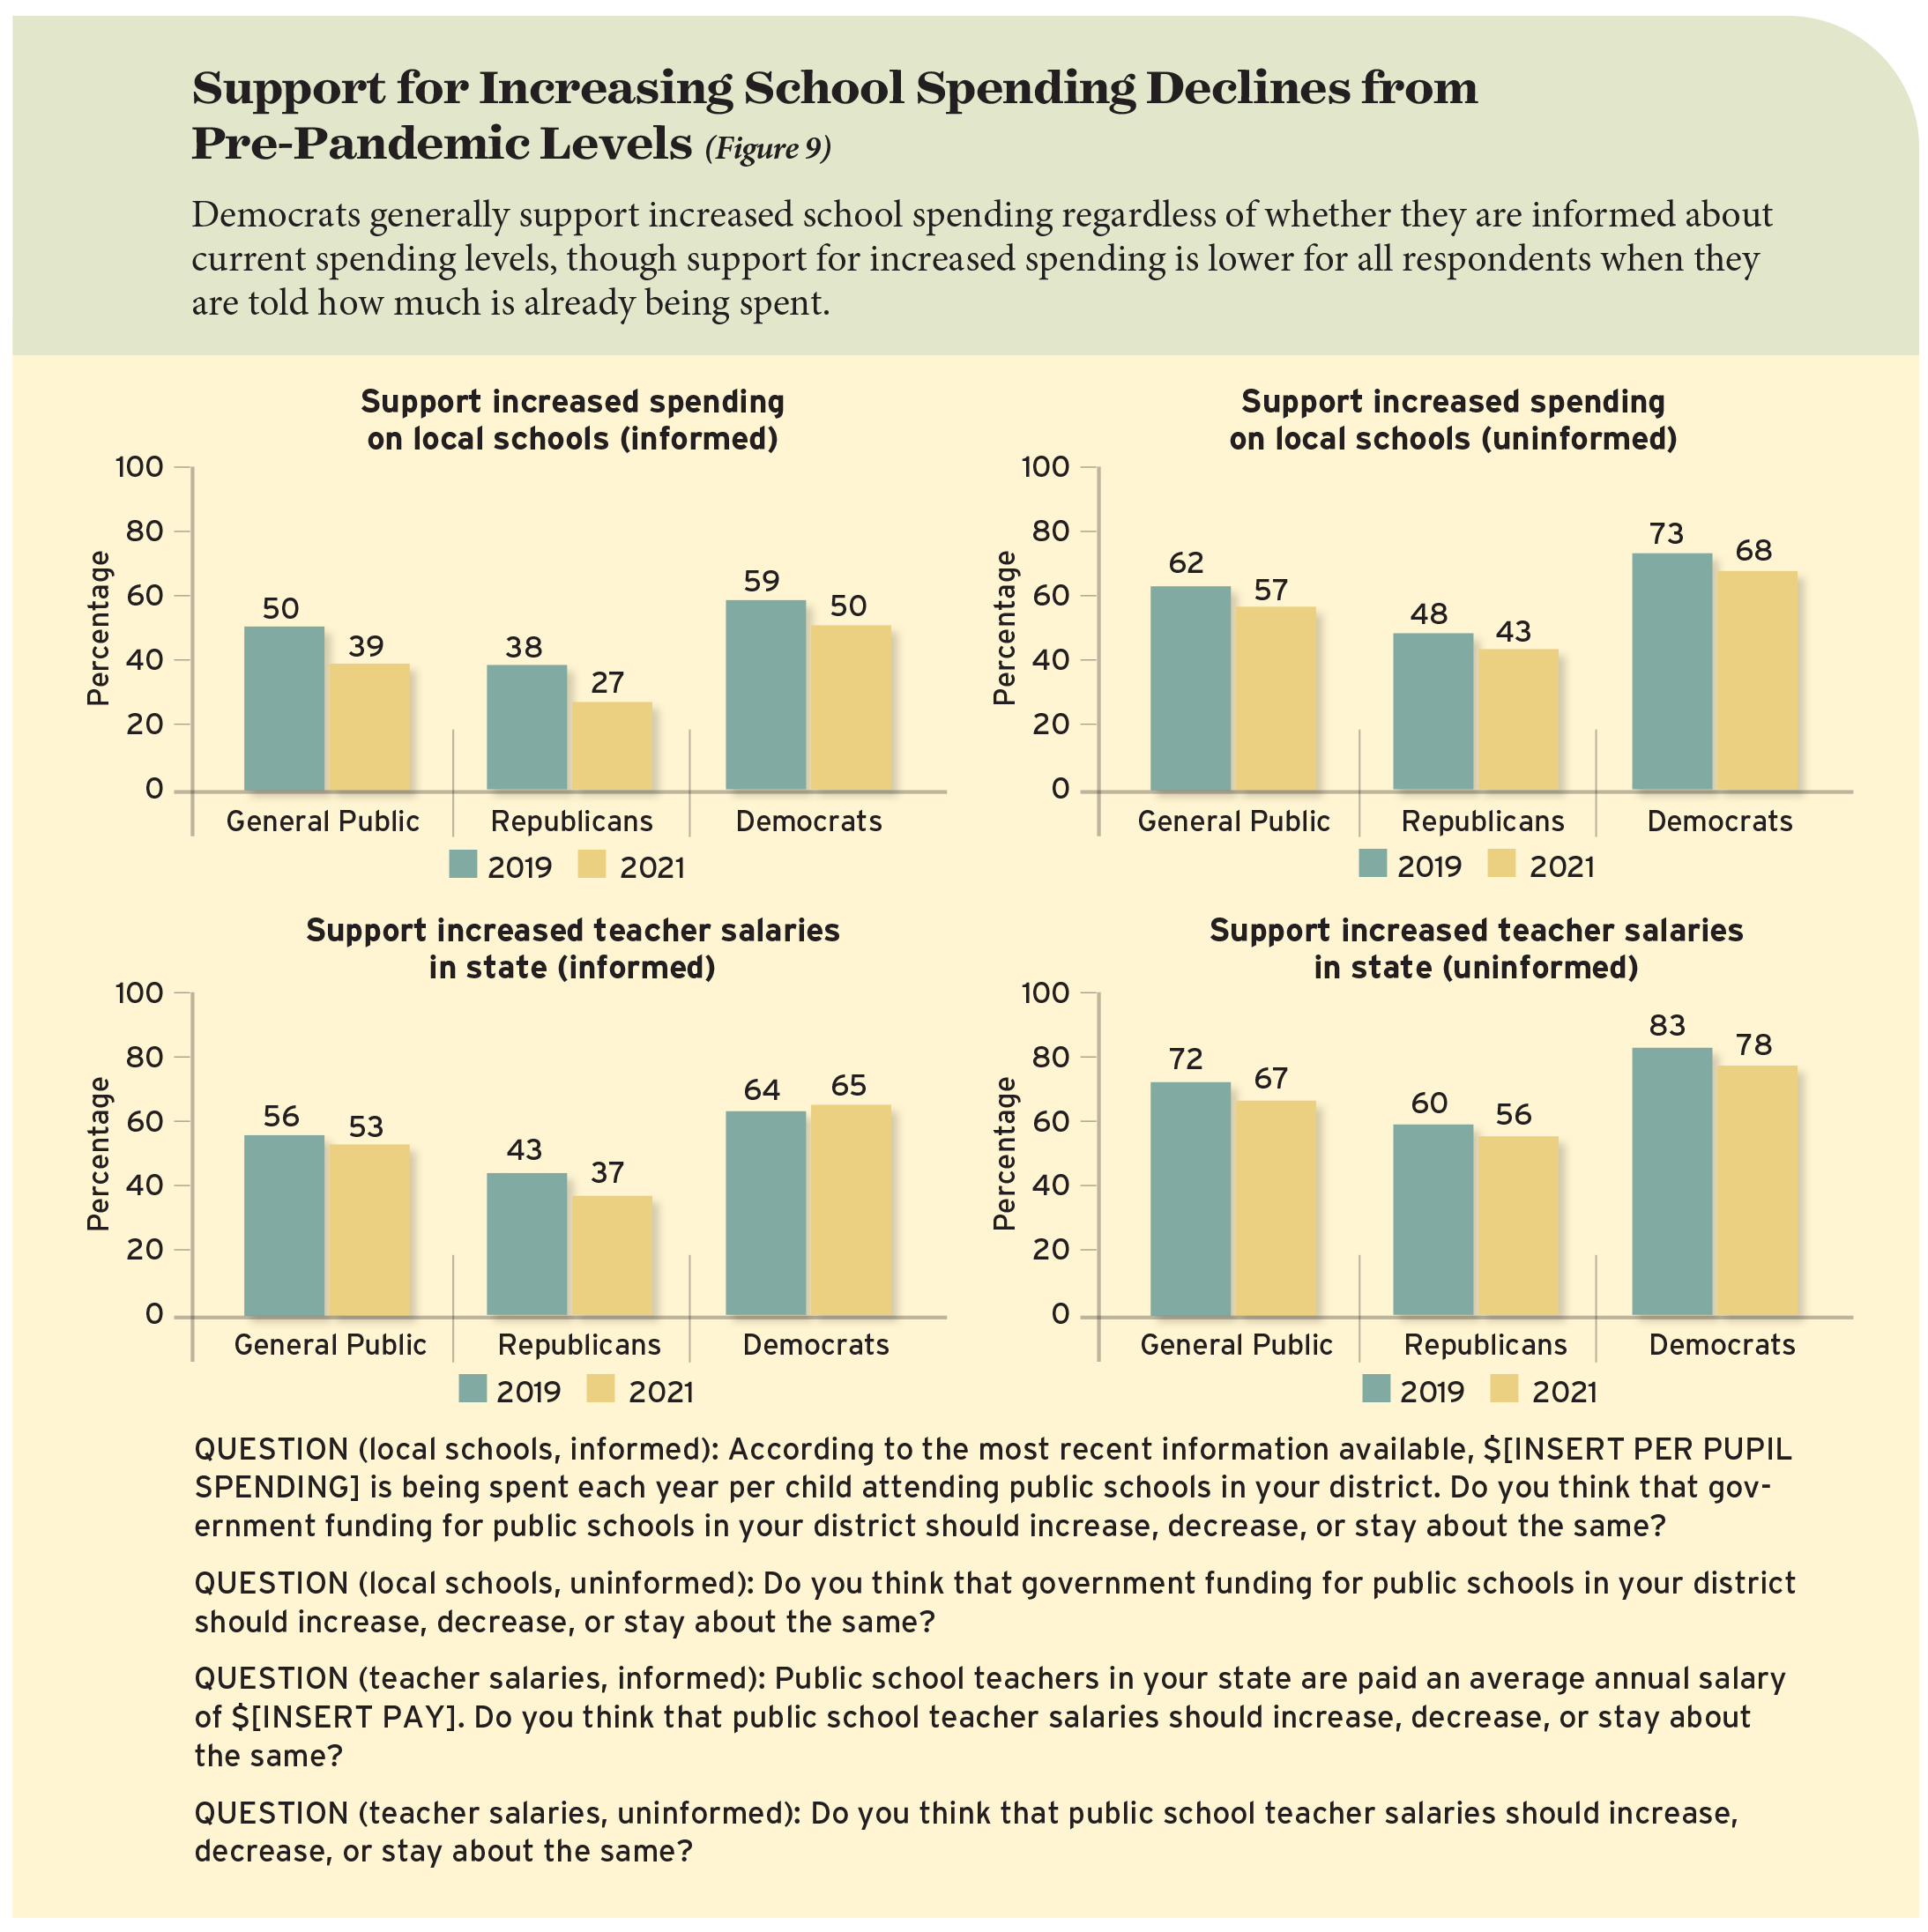
School spending. Respondents were split into two equally sized, randomly selected groups when asked about their views on school expenditures. One half was given no information about current spending while the other was told the level of per-student expenditures in the district in which they lived. In both groups, support for higher school spending fell between 2019 and 2021, but the downward shift did not significantly alter the partisanship gap (see Figure 9). Within the group given no information, Democrats continue to be 25 percentage points more in favor of increased spending in their local district than Republicans are (68% to 43%). Among those given information on per-student expenditures in their district, half the Democrats favor increased spending, down from 59% in 2019. Among Republicans in that group, 27% back more spending, down from 38% in 2019. In other words, information about current levels of spending reduces an inclination to spend more on schools among both Democrats and Republicans, and enthusiasm for spending has declined over the past two years, but partisan difference remains essentially unchanged from 2019.
To find out whether information had similar effects on opinions about teacher salaries, we again split the sample into two randomly selected groups. Among those not told average teacher salary levels in their state, support for teacher pay hikes remains nearly as high in 2021 as in 2019, with 78% of Democrats and 56% of Republicans favoring increases. When respondents are informed of current teacher salaries, Democratic support falls to 65%, and Republican approval to 37%, enlarging the partisan gap evident in 2019 by six percentage points.
Merit pay for teachers, in-state college tuition for immigrants, free college, and universal preschool. Partisan gaps have remained generally consistent in the level of support for merit-based pay for teachers, in-state tuition rates for undocumented immigrants, and free public college (both two-year and four-year). Fifty-three percent of Republicans but only 41% of Democrats support “basing part of the salaries of teachers on how much their students learn.” For Republicans and Democrats alike, the favorability level for this idea has not shifted since 2019. Nor has opinion by adherents to either party moved much between 2019 and 2021 on the question of “allowing undocumented immigrants to be eligible for the in-state college tuition rate” (21% among Republicans and 64% among Democrats in 2021).
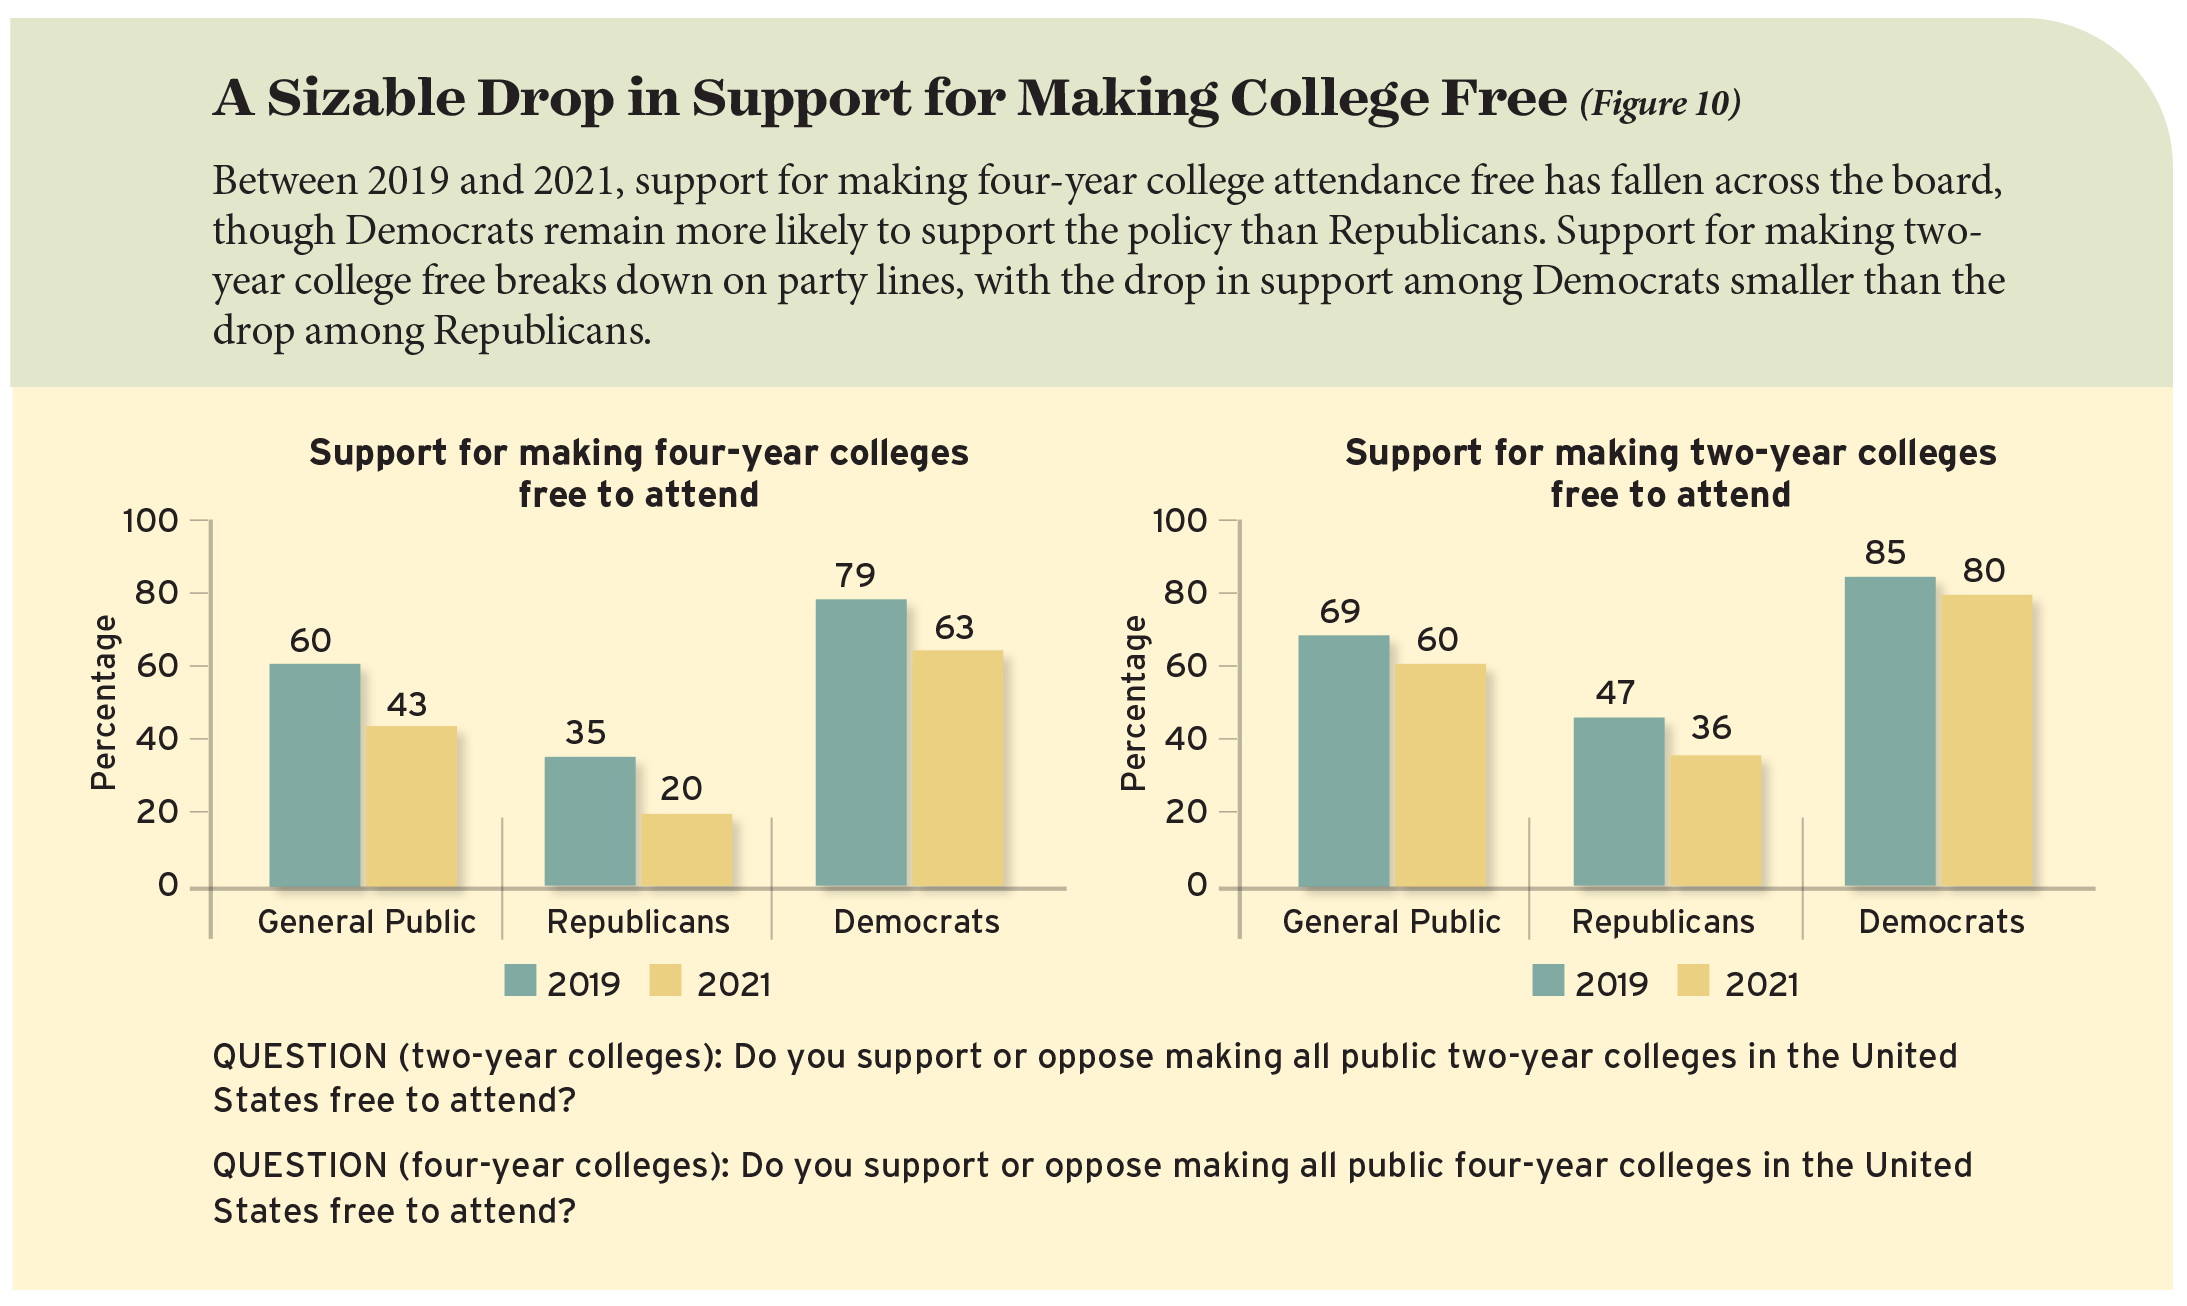
Attitudes toward making all public two-year colleges free to attend have bifurcated somewhat: Republican support declined to 36% from 47%, while Democratic support saw a smaller drop to 80% from 85% (see Figure 10). Enthusiasm for “making all public four-year colleges in the United States free to attend,” by contrast, took a major tumble across the board. Among Democrats, the percentage favoring the policy dropped to 63% from 79% between 2019 and 2021; among Republicans, the decline was to 20% from 35%.
We also see large partisan differences on universal pre-kindergarten, for which we lack trend data between 2019 and 2021. Eighty-five percent of Democrats support government funding for all four-year-olds to attend preschool, compared to 44% of Republicans.
In Short: Partisan differences on education policy are as vivid as ever and, in some cases, appear to have intensified since the start of the pandemic. But the degree of partisanship varies with the issue. On topics such as school spending, teacher salaries, merit pay, Common Core, free college, and college tuition for undocumented immigrants, partisanship reigns. On student testing for school accountability and on school choice, partisanship is less intense among the rank-and-file members of the two political parties than among many representatives active in state legislatures and in Congress.
A New President’s Influence
The pandemic wasn’t the only new factor in the national political landscape over the last year. We also elected and inaugurated a new president. In prior surveys, Education Next has measured how much a president’s views sway public opinion by dividing the sample into two randomly chosen segments, only one of which is told the position the president has taken on the issue. By comparing the stances of those told the president’s position with the views of the uninformed group, we can estimate that president’s power to influence opinion on that issue. In 2009 and 2010, we gave a random half of survey participants Barack Obama’s positions on charter schools, merit-based pay for teachers, and a variety of other issues. In 2017 and 2020, they were told Donald Trump’s positions on many of the same issues. The results were remarkably consistent. Participants who shared a partisan identity with the president tended to become more supportive of policies that the president endorsed, while participants from the other party tended to become less supportive of those policies. The one partial exception was the first year of the Obama presidency, when this president, particularly popular at the time the survey was administered, seemed to influence opinion in the same direction across the political spectrum.
In this year’s poll, we repeat this experiment on presidential power by asking participants to indicate their support or opposition with respect to two issues on which President Joe Biden has taken a clear public stance. Although Biden has generally remained silent or ambivalent on many of the more controversial questions in education policy, preventing us from making direct comparisons with prior presidents on some issues, the administration has taken a strong position on two large contemporary issues: government funding for universal preschool and free tuition at public two-year colleges. To estimate the influence of the president, we assigned participants to two randomly chosen segments, only one of which was told Biden’s position on these two policy questions.
The impact of Biden’s endorsements is more muted than those of the two prior presidents, perhaps because Republicans and Democrats already disagree sharply about both preschool education and free community college. Among Democrats, support for government funding for preschool and community college is a robust 85% and 80%, respectively. But those percentages do not differ significantly between those informed of Biden’s views and those left uninformed. Perhaps Democrats already knew Biden’s position and therefore the information did not convey anything new to the survey respondents, or maybe the percentage favoring the policy is already so high that it is difficult to shift it higher. But it is also possible that Biden is not a particularly influential president with respect to public opinion—even among his own partisans.
The picture is much the same for Republicans, who are generally opposed to both policy proposals. Among Republicans, 44% favor universal preschool and 36% endorse the idea of free community colleges. Their views do not shift in a more negative direction once they have been told Biden’s position on the issue. Once again, it is possible that Republicans already know the president’s views, and the survey does not convey new information. In prior experiments, respondents to the survey were told presidential positions on certain issues—charter schools and merit pay for teachers—that matter a lot to activists but are relatively invisible to many Americans. Universal preschool and free community college may be more salient topics for the public in general.
Or it may be the case that Biden is a less polarizing president, or that partisanship is less potent in the post-pandemic era, though other survey data contradict that interpretation. In the end, we are unable to interpret definitely the difference between the impact of the Biden presidency and that of his predecessors.
In Short: Informing the public about President Biden’s position on the two education issues on which he has been most vocal—universal preschool and free community college—does not notably affect the balance of opinion or the already yawning partisan divide on those issues.
Rethinking School Board Elections
As a result of municipal reforms at the beginning of the 20th century, school board elections are often held “off-cycle”—that is, at a time other than the “on-cycle” elections in November of even-numbered years. Advocates of off-cycle elections argue that separating school board elections and general elections keeps politics out of education, potentially creating the conditions for more stable and expert-driven governance of schools. Critics of off-cycle elections contend that the unusual timing of school board elections results in low voter turnout, an unrepresentative electorate, and outsized influence of special interests.
We wanted to know what the American public thinks about the merits of off-cycle versus on-cycle school board elections. We divided our sample into three equally sized sections and asked the first group whether they think school board elections should be held on the same day as national elections or on a different day. Fully two-thirds support holding school board elections on the same day as national elections. When we offer a rationale for on-cycle elections (“Some people argue that holding school board elections on the same day as national elections would increase the number of people who turn out to vote for the school board”), the results are unchanged. When we offer a rationale for off-cycle elections (“Some people argue that holding school board elections on a different day than national elections helps keep politics out of education”), support for holding school board elections on the same day as national elections falls to 57%
In Short: Even among those who receive an argument in favor of off-cycle elections, a majority still supports on-cycle school board elections. School board election timing is the rare instance in this year’s survey where the public would seem to favor a departure from the status quo rather than a return to normalcy.
Michael B. Henderson is associate professor of political communication and director of the Public Policy Research Lab at Louisiana State University’s Manship School of Mass Communication. David M. Houston is assistant professor at the College of Education and Human Development at George Mason University. Paul E. Peterson is the Henry Lee Shattuck Professor of Government at Harvard University, director of Harvard’s Program on Education Policy and Governance, and senior editor of Education Next. Martin West is academic dean and Henry Lee Shattuck Professor of Education at the Harvard Graduate School of Education and editor-in-chief of Education Next.
Survey Methods
The survey was conducted from May 28 to June 21, 2021, by the polling firm Ipsos Public Affairs via its KnowledgePanel®. The KnowledgePanel® is a nationally representative panel of American adults (obtained via address-based sampling techniques) who agree to participate in a limited number of online surveys. Ipsos provides internet access and/or an appropriate device to KnowledgePanel® members who lack the necessary technology to participate. For individual surveys, Ipsos samples respondents from the KnowledgePanel®. Respondents could elect to complete this survey in English or Spanish.
The total sample for the survey (3,156 respondents) consists of two overlapping samples. The first is a nationally representative, stratified general-population sample of adults in the United States (1,410 respondents). The second consists of American parents, stepparents, or foster parents of at least one child living in the respondent’s household who is in a grade from kindergarten through 12th (2,022 respondents). The parent sample includes oversamples of parents with at least one child in a charter school (232 respondents), parents with at least one child in a private school (325 respondents), Black parents (288 respondents), and Hispanic parents (472 respondents). The completion rate for this survey is 54%.
For parents, after initially screening for qualification, we created a roster of the children in kindergarten through 12th grade who live in their household by asking for the grade, gender, race, ethnicity, school type (traditional public school, charter school, private school, or home school), and age for each child. We also allowed parents to label each child in the roster with a name or initials if they chose to do so. In all, the parent sample provided information on 3,443 K–12 students. We asked a series of questions about the school- ing experiences for each of these children. After completing these questions about each child individually, parents proceeded to the remainder of the survey.
In this report, we analyze responses to questions about individual children at the child level. We analyze all other questions at the respondent level. For both student-level and parent-level analyses, we use survey weights designed for representativeness of the national population of parents of school-age children. For analysis of the general-population sample, we use survey weights designed for representative- ness of the national population of adults.
The exact wording of each question is available at www.educationnext.org/edfacts. Percentages reported in the figures and online tables do not always sum to 100, as a result of rounding to the nearest percentage point.
Information used in the experiments involving school- district spending and revenue were taken from the 2017–18 National Center for Education Statistics (NCES) Common Core of Data’s Local Education Agency Finance Survey for fiscal year 2018, version 1a, the most recent one available at the time the survey was prepared. Information used in the experiments involving state teacher salaries were drawn from Table 211.6 of the NCES Digest of Education Statistics, 2020 (2019–2020 school year), the most recent data available at the time the survey was prepared.
More from the 2021 Education Next Survey: “Parent Poll Reveals Support for School Covid-Safety Measures Despite Vaccine Hesitancy, Partisan Polarization“
This article appeared in the Winter 2022 issue of Education Next. Suggested citation format:
Henderson, M.B., Houston, D.M., Peterson, P.E., West, M.R. (2022). Hunger for Stability Quells Appetite for Change: Results of the 2021 Education Next Survey of Public Opinion. Education Next, 22(1), 8-24.