
Has the achievement of U.S. students improved over the past half century? Have gaps between racial, ethnic, and socioeconomic groups widened or narrowed?
These and similar questions provoke near-constant conversation. But answers are uncertain, partly because research to date has yielded inconsistent findings. Here we bring together information from every nationally representative testing program consistently administered in the United States over the past 50 years to document trends in student achievement from 1971 to 2017, the last year for which detailed information is currently available.
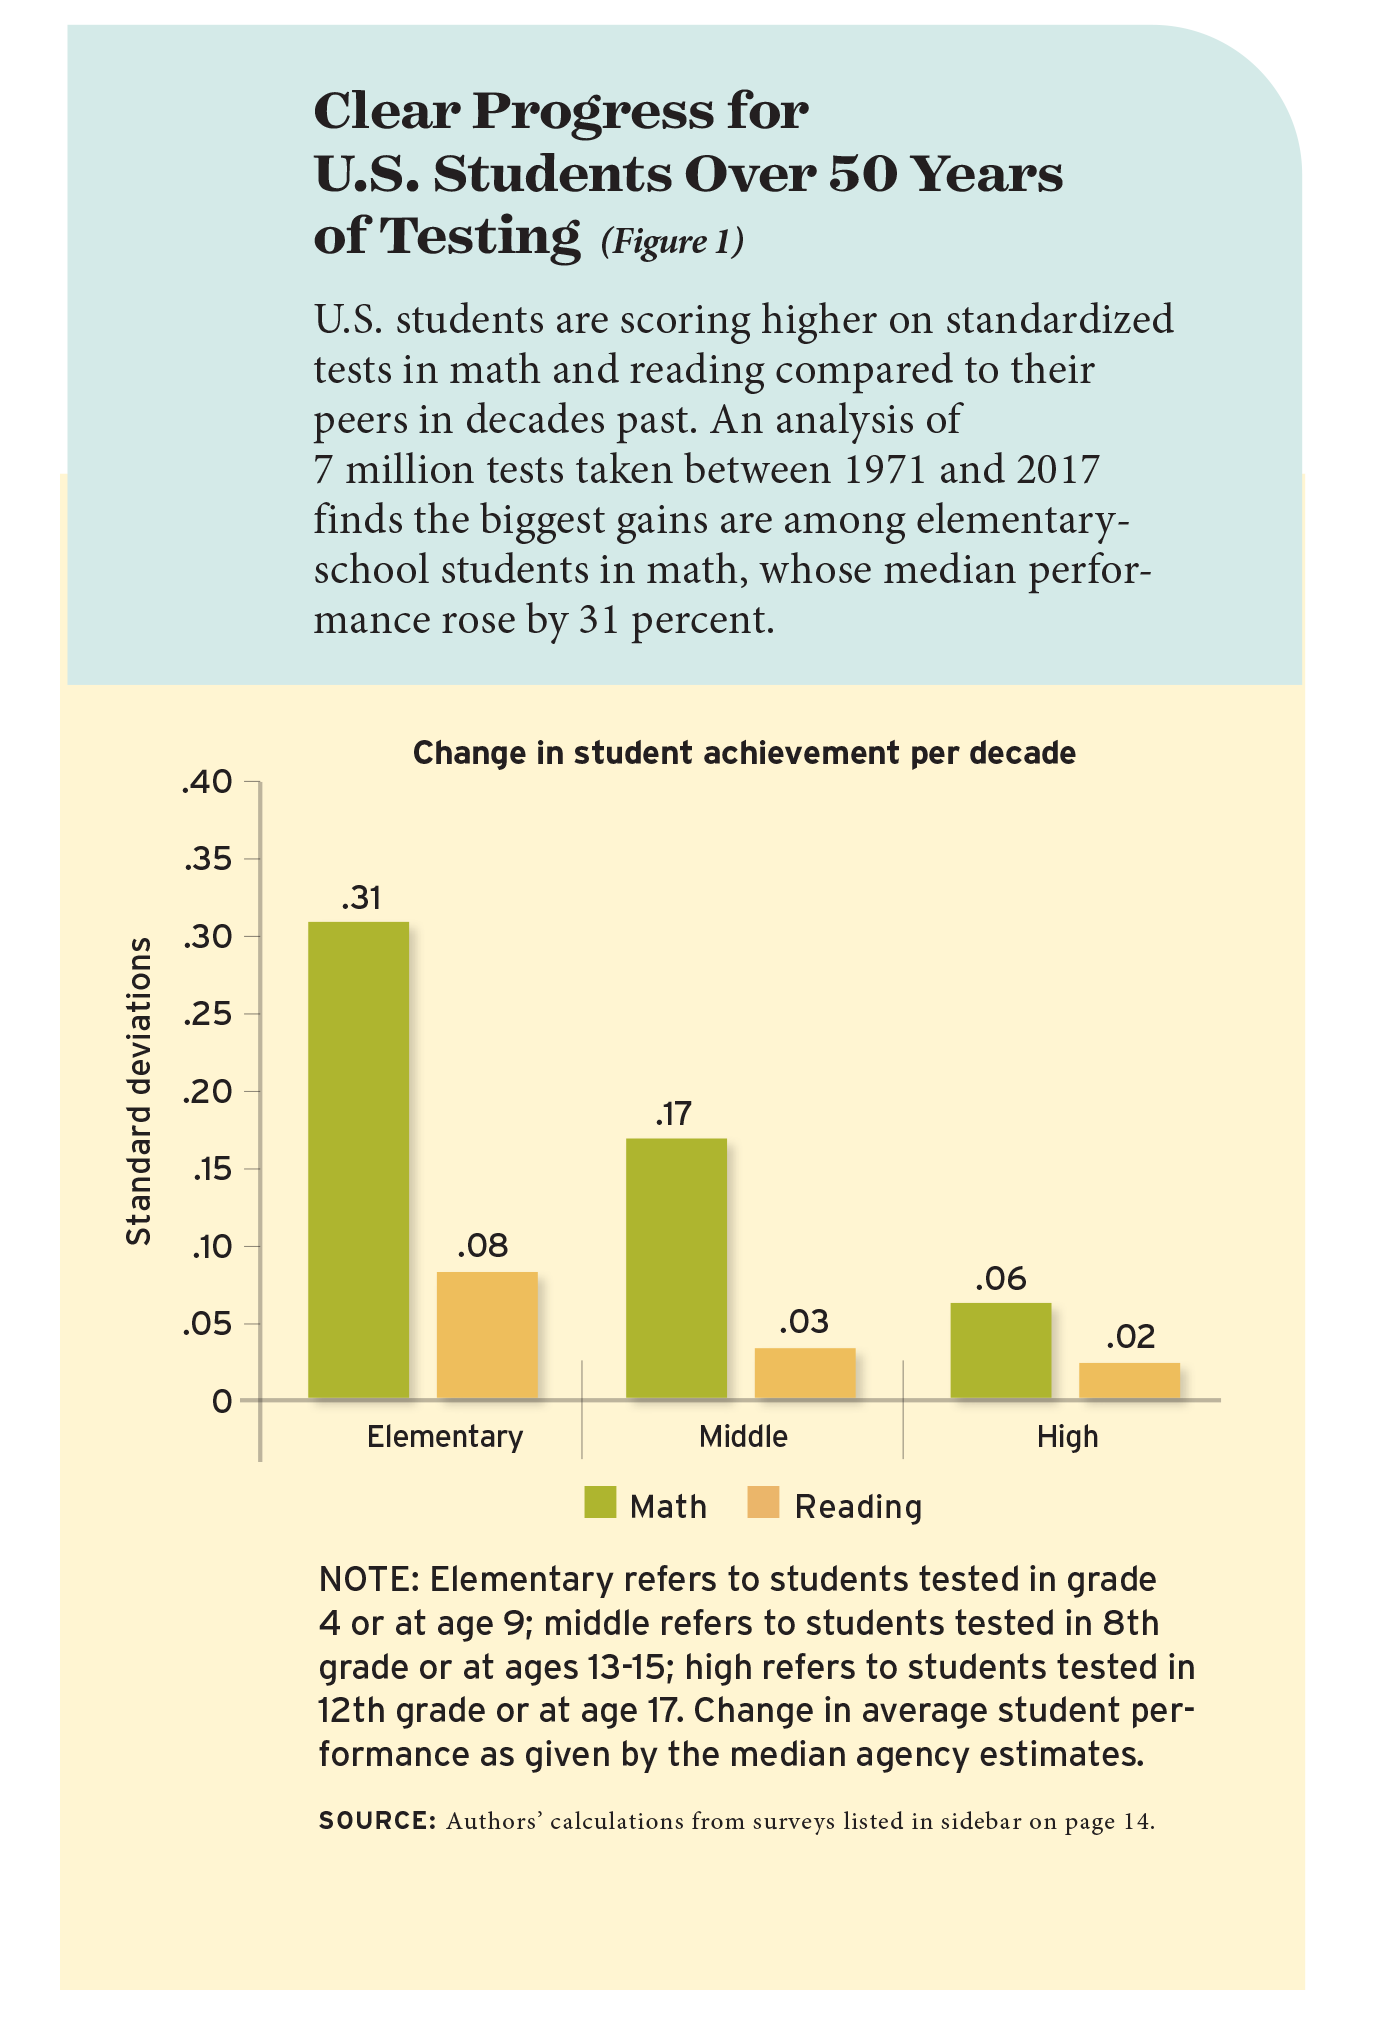
Contrary to what you may have heard, average student achievement has been increasing for half a century. Across 7 million tests taken by U.S. students born between 1954 and 2007, math scores have grown by 95 percent of a standard deviation, or nearly four years’ worth of learning. Reading scores have grown by 20 percent of a standard deviation during that time, nearly one year’s worth of learning.
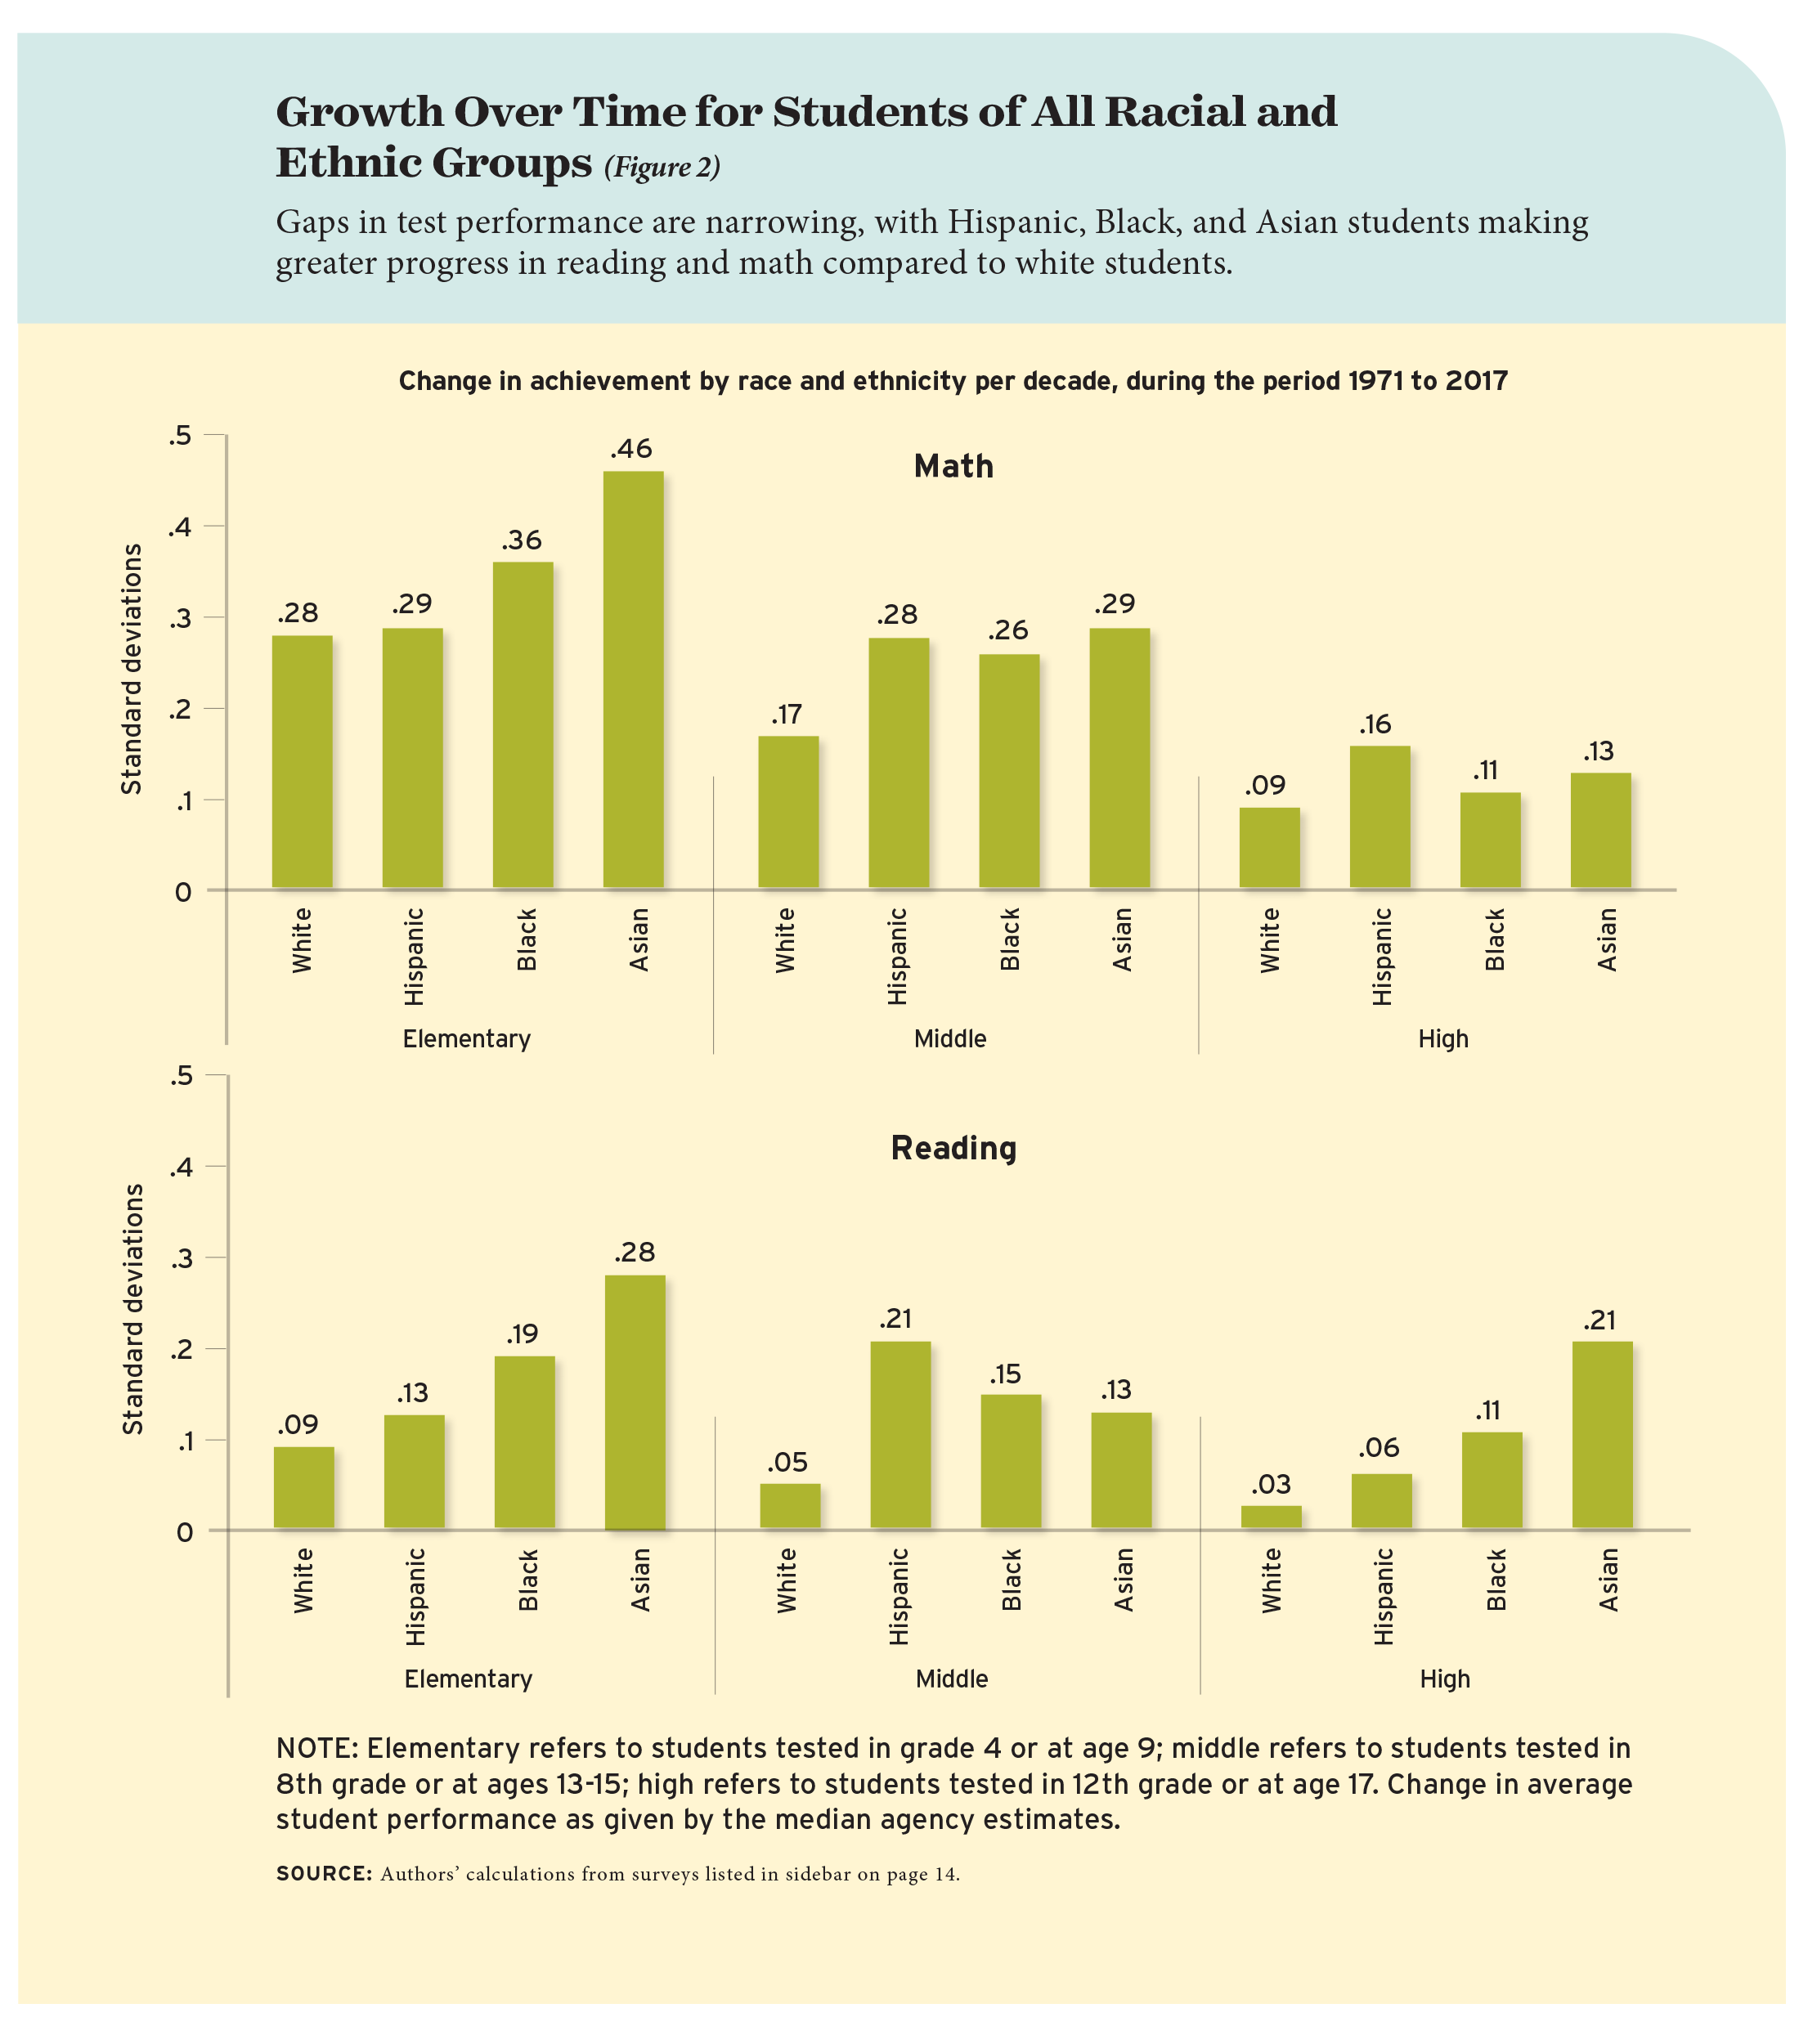
When we examine differences by student race, ethnicity, and socioeconomic status, longstanding assumptions about educational inequality start to falter. Black, Hispanic, and Asian students are improving far more quickly than their white classmates in elementary, middle, and high school. In elementary school, for example, reading scores for white students have grown by 9 percent of a standard deviation each decade, compared to 28 percent for Asian students, 19 percent for Black students, and 13 percent for Hispanic students. Students from low socioeconomic backgrounds also are progressing more quickly than their more advantaged peers in elementary and middle school. And for the most part, growth rates have remained steady throughout the past five decades.
Conventional wisdom downplays student progress and laments increasing achievement gaps between the have and have-nots. But as of 2017, steady growth was evident in reading and especially in math. While the seismic disruptions to young people’s development and education due to the Covid-19 pandemic have placed schools and communities in distress, the successes of the past may give educators confidence that today’s challenges can be overcome.
Bypassing Conventional Wisdom
Scholars and public intellectuals from all sides of the political spectrum have consistently made the opposite case. Dating back to 1983’s A Nation at Risk, debate over the state of public education in the United States often has portrayed schools as failing and American students as falling behind. Books like 2009’s The Dumbest Generation and 1994’s The Decline of Intelligence in America argued that young people were so entranced by technology that they failed to develop basic knowledge and skills.
Public understanding of inequality also has assumed that racial, ethnic, and socioeconomic gaps in student achievement are universal and growing. In 2011, research by Stanford sociologist Sean Reardon appeared to show a widening of the socioeconomic achievement gap over the past 70 years. In 2012, conservative Charles Murray argued that “the United States is stuck with a . . . growing lower class that is able to care for itself only sporadically and inconsistently” even as the “new upper class has continued to prosper as the dollar value of [its] talents . . . has continued to grow.” In 2015, Harvard political scientist Robert Putnam wrote “rich Americans and poor Americans are living, learning, and raising children in increasingly separate and unequal worlds.” More recently, critiques by organizations like Black Lives Matter have identified racial inequality both inside and outside the classroom as a defining characteristic of American life.
But no study of student achievement over time has brought all the relevant data together in a systematic manner and assessed how these assumed trends are playing out. Our analysis does just that.
Our data consist of more than 7 million student test scores on 160 intertemporally linked math and reading tests administered to nationally representative samples of U.S. student cohorts born between 1954 and 2007 (see “Put to the Test“). By “intertemporally linked,” we mean that researchers in each of the testing programs have designed their tests to be comparable over time, by doing things such as repeating some of the same questions across different waves.
We estimate trends separately by testing program, subject, and grade level and report the median rather than average result to avoid giving undue importance to outliers, much as consensus projections of future economic growth typically use the median of predictions made by alternative economic models. We report changes in student achievement over time in standard deviation units. This statistic is best understood by noting that average performance differences between 4th- and 8th-grade students on the same test are roughly one standard deviation. Accordingly, we interpret a difference of 25 percent of a standard deviation as equivalent to one year of learning.
Achievement and the Flynn Effect
The surveys show a much steeper rise in math than reading performance (see Figure 1). In math, overall student performance rose by 19 percent of a standard deviation per decade, or 95 percent of a standard deviation over the course of 50 years—nearly four additional years’ worth of learning. In reading, however, the gains are only 4 percent of a standard deviation per decade, or 20 percent of a standard deviation over the same period.
The difference between the two subjects is puzzling. Mathematical knowledge and reasoning skills in the U.S. teaching force has long been a matter of concern. And mainstream math instruction in U.S. schools generally is considered inadequate relative to other developed countries, despite recent attempts to focus on developing mathematical understanding. Why is math achievement accelerating far more quickly than reading?
The answer, we believe, is found in recent research on human intelligence. Not long ago, intelligence quotient, or IQ, was considered a genetically determined constant that shifted only over the course of eons, as more intellectually and physically fit homo sapiens survived and procreated at higher rates. Then in the mid-1980s, James Flynn, a New Zealand political scientist, examined raw IQ data and found that scores were increasing by 3 points, or about 21 percent of a standard deviation, per decade. Though Flynn’s work was initially dismissed as an over-interpretation of limited information, his finding was replicated by many others.
In 2015, Jakob Pietschnig and Martin Voracek conducted a meta-analysis of 271 studies of IQ, involving 4 million people in 31 countries around the world over the course of more than a century. As Flynn did, they found growth in overall IQ scores. But they also distinguished between types of intelligence. This included crystallized knowledge, or the ability to synthesize and interpret observed relationships in the environment, which is rooted in facts, knowledge, and skills that can be recalled as needed. And it included fluid reasoning, or the ability to analyze abstract relationships, which is associated with recognizing patterns and applying logic to novel situations. In industrialized societies, for a period similar to the one covered by our study, they found that fluid reasoning grew by 15 percent of a standard deviation per decade compared to 3 percent for crystallized knowledge. This difference resembles what we observe in the achievement data: growth of 19 percent of a standard deviation per decade for math and 4 percent for reading.
That the growth rates for the two types of achievement and IQ parallel one another may be more than a coincidence. Reading draws heavily on crystallized knowledge of the observable world, and skillful readers can give meaning to words that denote features of their physical and social environment. In math, this type of knowledge is necessary to understand symbols such as 1, 2, and 3 or +, -, and =, but analyzing and manipulating relationships among symbols is more a function of fluid reasoning. Several studies have shown math performance to be more strongly associated than reading performance with higher levels of fluid reasoning. In addition, a longitudinal study of preschool children found emergent school vocabulary to be associated with gains in verbal intelligence, a form of crystallized knowledge, but not with gains in fluid reasoning.
In the meta-analysis, Pietschnig and Voracek point to the factors that affect brain development as the most likely explanation for differential growth in these types of intelligence. Studies in neurobiology and brain imaging have found that when environmental factors like nutrition, infections, air pollution, or lead poisoning damage the brain’s prefrontal cortex, it affects fluid reasoning, but not crystallized knowledge. The negative impact on brain development of, for example, growing up amid famine or war would appear to have the biggest impact on fluid reasoning intelligence, used for math, rather than crystalized knowledge, used for reading.
Over the past 100 years, mothers and babies from all social backgrounds across the world have enjoyed increasingly higher quality nutrition and less exposure to contagious diseases and other environmental risks. Pietschnig and Voracek find substantial growth in fluid reasoning and less growth in crystallized knowledge on every continent, with particularly large gains in Asia and Africa. If students’ performance on math tests depends more on fluid reasoning than crystallized knowledge, then the greater progress in math than reading may be due to environmental conditions when the brain is most malleable—in early childhood, or even before students are born.
Put to the Test
Our data come from approximately 7 million U.S. student observations, as well as 4.5 million international student observations, on math and reading assessments in five psychometrically linked surveys administered by governmental agencies. The surveys have administered 160 waves of 17 temporally linked tests of achievement to nationally representative cohorts of U.S. students for various portions of the past half century.
Together, these data provide information on student race and ethnicity, gender, and socioeconomic status (an index based upon student reports of parents’ education and the number of possessions in the home). Within each subject, age/grade, and assessment, we normalize each subsequent cohort’s test score distribution with respect to the mean of test scores in its initial year of administration. With a quadratic fit, we calculate the distance in standard deviations of the change in student performance for survey per decade.
1971-2012
National Assessment of Educational Progress, Long-Term Trend (LTT) Assessment
● Math and Reading – ages 9, 13, 17
1990-2017
National Assessment of Educational Progress, main NAEP
● Math and Reading – grades 4, 8, 12
1995-2015
Trends in International Math and Science Study (TIMSS)
● Math – grades 4, 8
2000-2015
Program for International Student Assessment (PISA)
● Math and Reading – age 15
2001-2016
Progress in International Reading Literacy Study (PIRLS)
● Reading – grade 4
The PISA Exception
The main exception to this pattern comes from the Program for International Student Assessment (PISA) given since 2000 to high-school students at age 15. On this test, and only on this test, both the overall trend and the math-reading comparison are the reverse of what we observe on all the other surveys. U.S. student performance declines over time, with steeper drops in math scores than in reading. In math, scores decline by 10 percent of a standard deviation per decade; in reading, they fall by 2 percent of a standard deviation per decade. This stands in sharp contradiction to student performance on the National Assessment of Educational Progress (NAEP). There, we see large gains of 27 percent of a standard deviation per decade in math among middle-school students, who take the test in 8th grade. In addition, student performance improves by 19 percent of a standard deviation per decade on another math exam, the Trends in International Math and Science Study (TIMSS). How can PISA obtain results so dramatically different from what other tests show? Is the PISA exam fundamentally flawed? Or is it measuring something different?
We cannot account for all differences among tests, but in our opinion, PISA math is as much a reading test as a math test. The goal of PISA is to measure a person’s preparation for life at age 15. It does not ask test-takers to merely solve mathematical problems, as do NAEP and TIMSS, but instead provides opportunities to apply mathematical skills to real-world situations. A 2018 analysis found that “more than two-thirds of the PISA mathematics items are independent of both mathematical results (theorems) and formulas.” A 2001 review found that 97 percent of PISA math items deal with real-life situations compared to only 48 percent of items in NAEP and 44 percent in TIMSS. Another analysis comparing the exams found that PISA questions often have more text, including extraneous information students should ignore, than NAEP questions. In addition, a 2009 study found “there is a very high correlation between PISA mathematics and PISA reading scores” and that “The overlap between document reading (e.g., graphs, charts, and tables) and data interpretation in mathematics becomes blurred.”
We do not pretend to know which testing program is administering the best exam. But we are quite certain that PISA is administering a decidedly different kind of math test, one that requires much more crystallized knowledge than other math tests.
Results by Social Group
Every test in our study shows a forward stride toward equality in student performance across race, ethnicity, and socioeconomic lines over the past half century (see Figure 2). The median rate of progress made by the average Black student exceeds that of the average white student by about 10 percent of a standard deviation per decade in both reading and math. Over 50 years, that amounts to about two years’ worth of learning, or about half the original learning gap between white and Black students. The disproportionate gains are largest for students in elementary school. They persist in middle school and, in diminished form, through the end of high school.
We don’t think this is due to outsized improvements in nutrition and medical care for Black children, because the gains are as great in reading as in math. It could be due to educationally beneficial changes in family income, parental education, and family size within the Black community. Other factors may also be at play, such as school desegregation, civil rights laws, early interventions like Head Start and other preschool programs, and compensatory education for low-income students. Regardless, the equity story is clearly positive, if still incomplete.
Hispanic student performance in math is similar: a steeper upward trend as compared to white students. However, gains in reading by Hispanic students, though still greater than the progress made by white students, are less pronounced than the math gains. This may be due to language barriers; about 78 percent of English language learners in the U.S. are Hispanic.
Overall, Asian students are making the most rapid gains in both subjects. Asian students have advanced by nearly two more years’ worth of learning in math and three more years’ worth of learning in reading than white students.
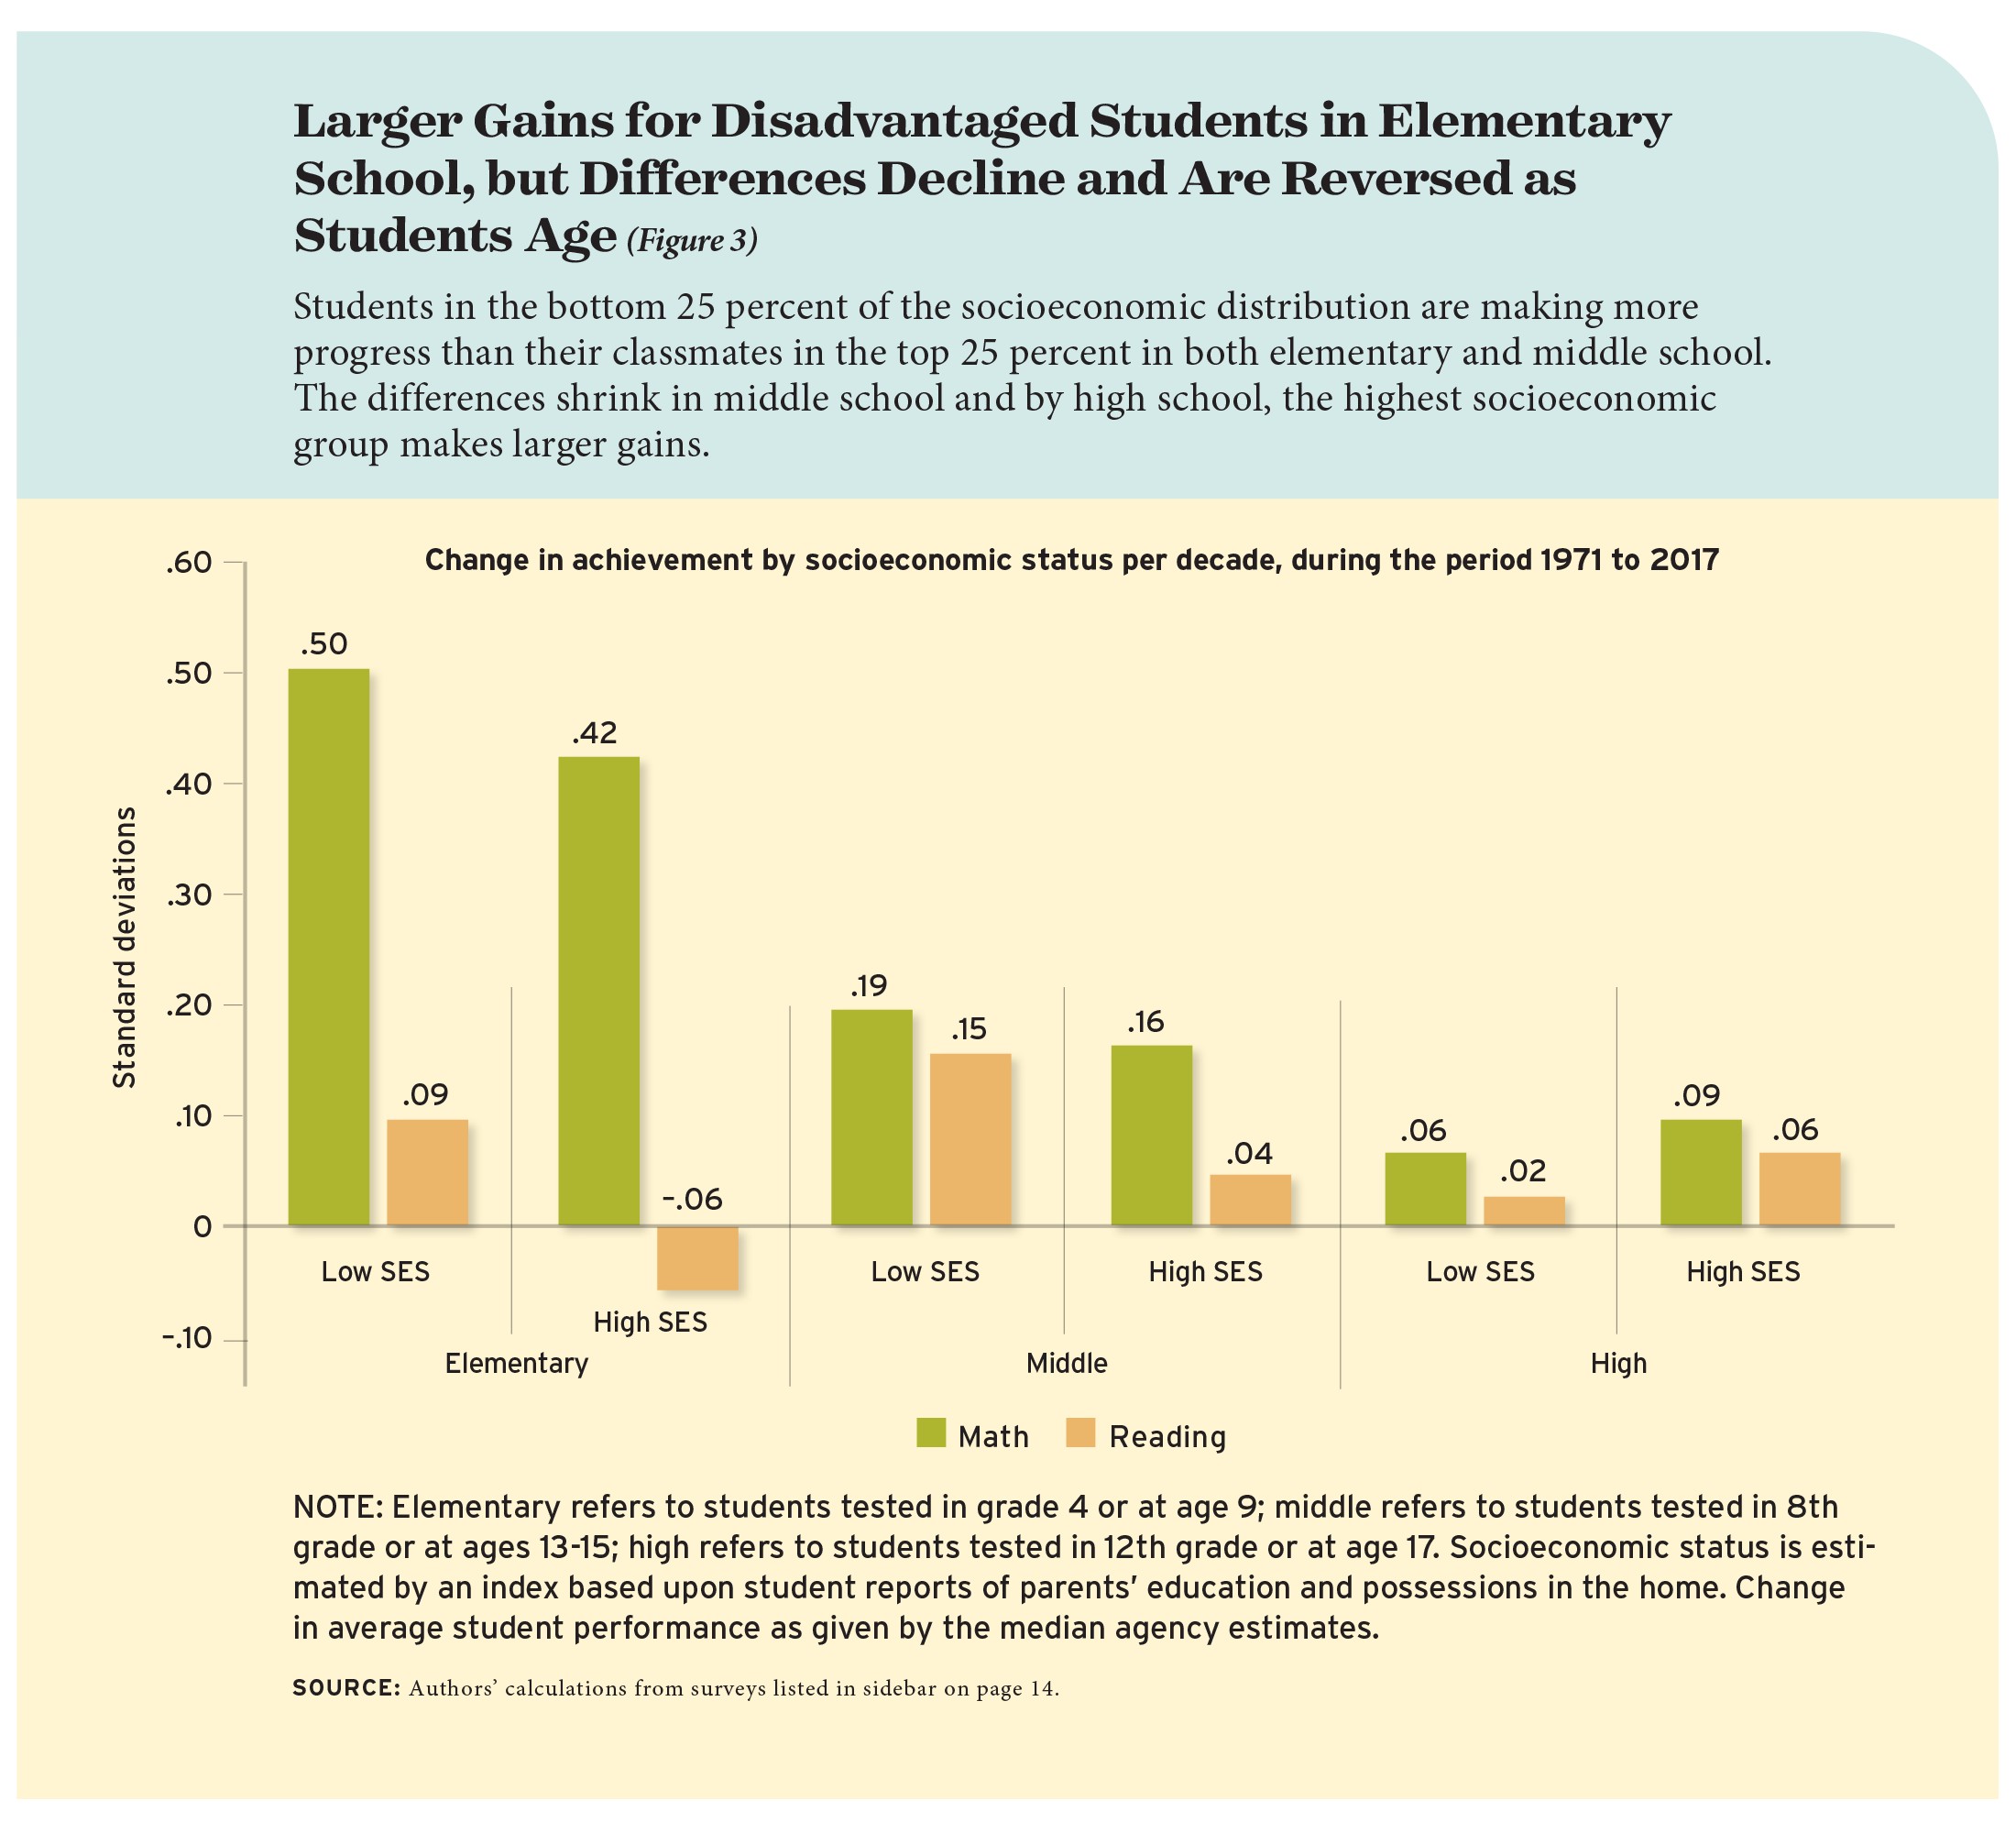
We also compare trends by socioeconomic status by building an index based on student reports of parents’ education as well as the number of possessions in the home. We compare achievement made by students coming from households in the top 25 percent and lowest 25 percent of the socioeconomic distribution. For all students, the achievement gap based on socioeconomic status closes by 3 percent of a standard deviation per decade in both reading and math.
The biggest gains occur in elementary school, where the gap closes over the 50-year period by 1.5 years’ worth of learning in math and three years’ worth in reading (see Figure 3). The differences shrink in middle school and are reversed in high school, where rates of progress by students in the top 25 percent modestly exceed those of students with the lowest socioeconomic status. The increase in the gap among the oldest students is 3 percent of a standard deviation per decade in math and 4 percent in reading.
In looking at low- and high-socioeconomic students within racial and ethnic groups, we see similar patterns for Black students in both subjects and for Hispanic students in math: achievement differences by socioeconomic background closing when students are tested at a younger age, but widening when students are tested toward the end of high school. Among Asian students, low-socioeconomic students continue to make greater progress than high-socioeconomic students in both subjects at all age levels.
What about income-based gaps in student achievement? In a widely circulated 2011 study, Stanford sociologist Sean Reardon found the income-achievement gap had increased dramatically over the past half century and more. However, the data upon which this claim rests are fragile, in that he relies for his conclusion upon results from disparate tests that are not linked and therefore are not necessarily comparable. To see whether trends from linked surveys support Reardon’s findings, we explore trends in achievement by the number and type of possessions students report as being in their homes, a plausible indicator of family income.
Overall, the evidence points in a direction opposite to Reardon’s findings, and results are qualitatively similar to the ones observed when estimated by the socioeconomic index. We find disproportionately larger gains for students in the lowest income quartile in both math and reading at younger ages. The difference is 5 percent of a standard deviation per decade in math and 6 percent in reading. However, we find that among students tested at the end of high school, the students from the highest quartile of the income distribution make greater progress than those from the lowest quartile by 6 percent of a standard deviation in math and 9 percent of a standard deviation in reading.
In sum, inferences about whether the size of the income gap, or the socioeconomic gap more generally, has increased or decreased depend largely on whether one places greater weight on tests administered to students in earlier grades or on trends for students tested as they reach the end of high school. For some, the high-school trend is most relevant, as it measures performance as students are finishing their schooling. For others, it is the least informative trend, as it could be subject to error if some older students are taking standardized tests less seriously in recent years or if rising graduation rates have broadened the pool of older students participating in the test.
But it is worth mentioning again that PISA stands out as an exception. It is the only test that shows much larger gains for U.S. high-school students from families in the lowest socioeconomic quartile than for those in the highest one. In math, the performance of the most advantaged 15-year-old students slid each decade by no less than 20 percent of a standard deviation in math and 14 percent in reading. Meanwhile, students in the bottom quartile showed notable gains of 4 percent of a standard deviation in math and 15 percent in reading. That amounts to closing the socioeconomic achievement gap by a full year’s worth of learning each passing decade. If PISA is to be believed, we are well on the way to equality of achievement outcomes.
Recent History
Critical assessments of America’s schools have a long history. But criticism grew sharper after the passage of the federal No Child Left Behind Act of 2001, which required annual testing and score reporting and set deadlines for improvement. In the past two decades, public opinion has been split widely between those who say the law enhanced student achievement and those who claim it made matters worse.
We split the sample into students born before and after 1990 to determine whether gains in median test scores were greater or lesser after the law was passed. Reading scores grew by 8 percent of a standard deviation more per decade among students born between 1991 and 2007 compared to students born between 1954 and 1990. In math, scores of more recent test-takers grew by 8 percent of a standard deviation per decade less than their predecessors.
Why would progress in math have slowed when progress in reading speeded up? The first half of the question is more easily explained than the second half. Trends in math achievement, as we have seen, are sensitive to changes in fluid reasoning ability. Factors that drive broad growth of that type of intelligence, such as better nutrition and decreased vulnerability to environmental contaminants, may have been changing more rapidly 30, 40, and 50 years ago compared to the past two decades. But why, then, have reading scores climbed more quickly? Did schools operating under No Child Left Behind have a more positive impact on reading performances? Or are families more capable of helping their children to read? Or both? Our data cannot say.
Recently, school closings in response to the Covid-19 pandemic seem to have had a negative impact on learning for an entire generation of students and exacerbated achievement gaps. This recalls similar educational setbacks from school closures during wars and strikes, reduced instructional time due to budget cuts (see “The Shrinking School Week,” research, Summer 2021), and broad absenteeism during weather events (see “In Defense of Snow Days,” research, Summer 2015). Indeed, Pietschnig and Voracek detect a slowdown in intellectual growth during World War II, a likely byproduct of both school closures and worldwide disruptions of economic and social progress.
But on the whole, families and schools both appear to have played a key role in reducing achievement gaps by race, ethnicity, and socioeconomic status over time. They also may have facilitated more rapid gains in reading among students born after 1990. Parental educational attainment and family incomes, both of which are strong correlates of student achievement, have risen in this more recent period. In addition, school reforms—desegregation, accountability measures, more equitable financing, improved services for students learning English, and school choice—have had their greatest impact on more recent cohorts of students.
Still, a research focus on families and schools may distract attention away from broader social forces that could be at least as important. For example, diminished progress in math for those born later than 1990 could be due to a decline in returns from improved health and nutrition in advanced industrialized societies. In addition, the greater gains of students at an early age and the recent flattening of growth in math performance all suggest that broader social, economic, and physical environments are no less important than schools and families. It is reasonable to infer from our research that policies benefiting children from the very beginning of life could have as much impact on academic achievement, especially in math, as focused interventions attempted when students are older.
Paul E. Peterson is a professor and director of the Program on Education Policy and Governance at Harvard University and a senior fellow at the Hoover Institution, Stanford University.
M. Danish Shakeel is a professor and director of the E. G. West Centre for Education Policy at University of Buckingham, U. K. This essay is drawn from an article just released by Educational Psychology Review.
This article appeared in the Fall 2022 issue of Education Next. Suggested citation format:
Shakeel, M.D., and Peterson, P.E. (2022). A Half Century of Student Progress Nationwide: First comprehensive analysis finds broad gains in test scores, with larger gains for students of color than white students. Education Next, 22(4), 50-58.
For more, please see “The Top 20 Education Next Articles of 2022.”