
In Maryland, several school districts have recently begun talking about redistricting—that is, redrawing boundaries to reduce overcrowding in schools and enhance racial and economic integration. Much of the coverage has focused, rightfully so, on the current demographics of schools in Howard and Montgomery Counties.
But the historical context can be informative, too, and with this week’s launch of version 1.0 of the Urban Institute’s Education Data Explorer, it’s easier than ever to find.
The explorer provides easy access to education data as far back as 1986. Nearly 30 years of K–12 and higher education data are now accessible to everyone, from education policy analysts to journalists, school leaders, and PTA presidents leading the charge on important local issues.
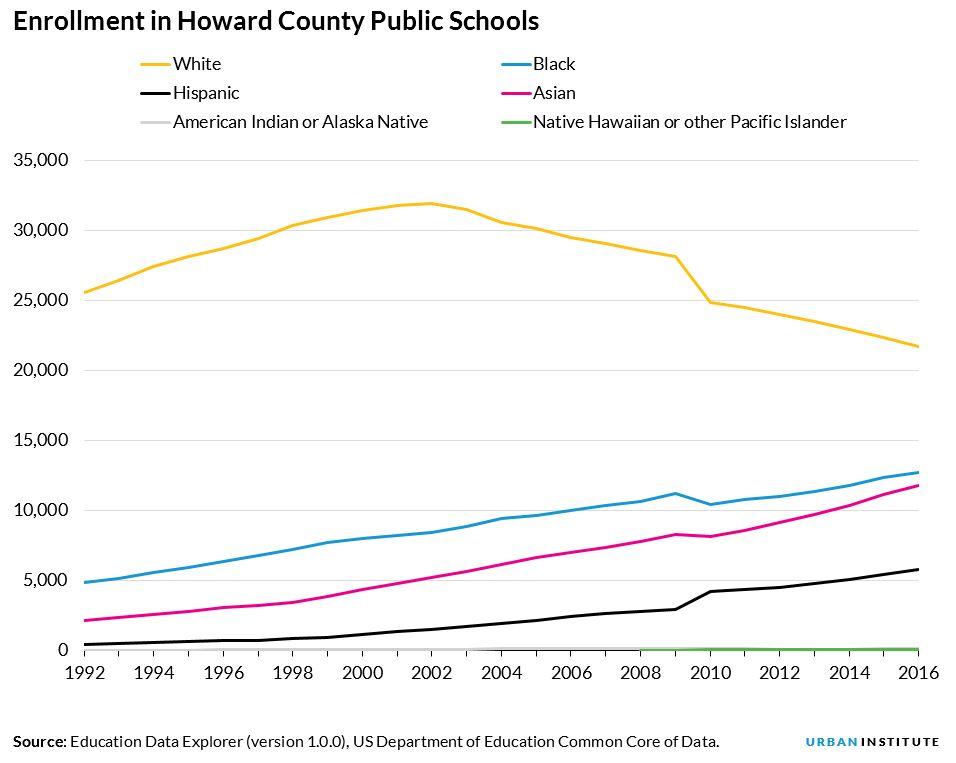
As a quick example: in 10 minutes, we were able to chart enrollment trends in Howard County, one of the communities talking about redistricting, over the past 25 years. The data show a steep decline in the number of white students, with steady increases in the number of Black, Asian, and Hispanic students.
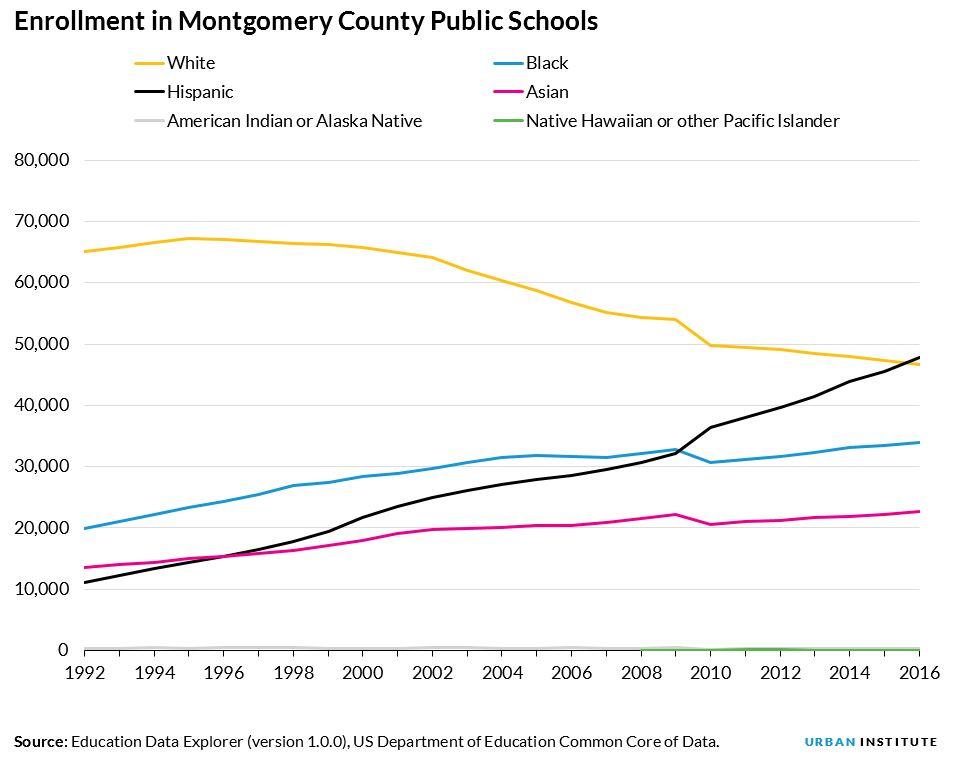
But it’s also interesting to compare enrollment patterns with nearby Montgomery County, another community in the midst of redistricting conversations. There, the number of Hispanic students has actually surpassed the number of white students.
Both these districts face difficult decisions around school boundaries and racial and socioeconomic integration. Although the historical data alone can’t solve the problem, they can provide the backdrop for understanding tensions, as well as a basis for looking toward the future.
Beyond the district trends reported above, local stakeholders can use the Data Explorer to dive deeper into school-level data to see how demographics and segregation patterns have evolved over the past 25 years.
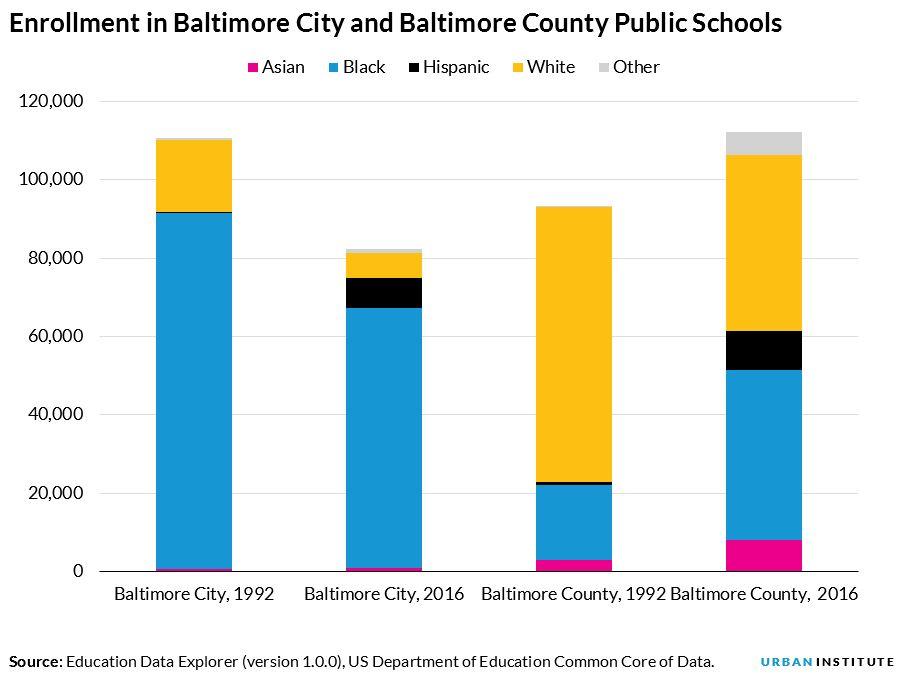
And even in districts where redistricting is not on the docket, these data can tell important stories. The chart below shows enrollment at Baltimore City and Baltimore County Public Schools in 1992 and 2016.
In that time period, we see that overall enrollment decreased in Baltimore City but increased in Baltimore County. The number of Hispanic students increased by similar amounts in both districts, but the number of Black students decreased in Baltimore City while growing in Baltimore County.
Exploring these trends could provide journalists with new questions to ask or stories to tell; district leaders with a better understanding of their districts and neighborhoods; and advocates with a starting point to understand where the most vulnerable students are and whether they’re getting the resources they need.
Patterns in higher education
We can also look at the demographics of colleges in Baltimore City and Baltimore County over the same 24-year span. We find that in Baltimore County’s four-year university, the number of students younger than 24 has increased, while the number of older students has decreased.
In Baltimore City’s community college, meanwhile, enrollment has decreased pretty evenly, and there are close to even numbers of younger and older students.
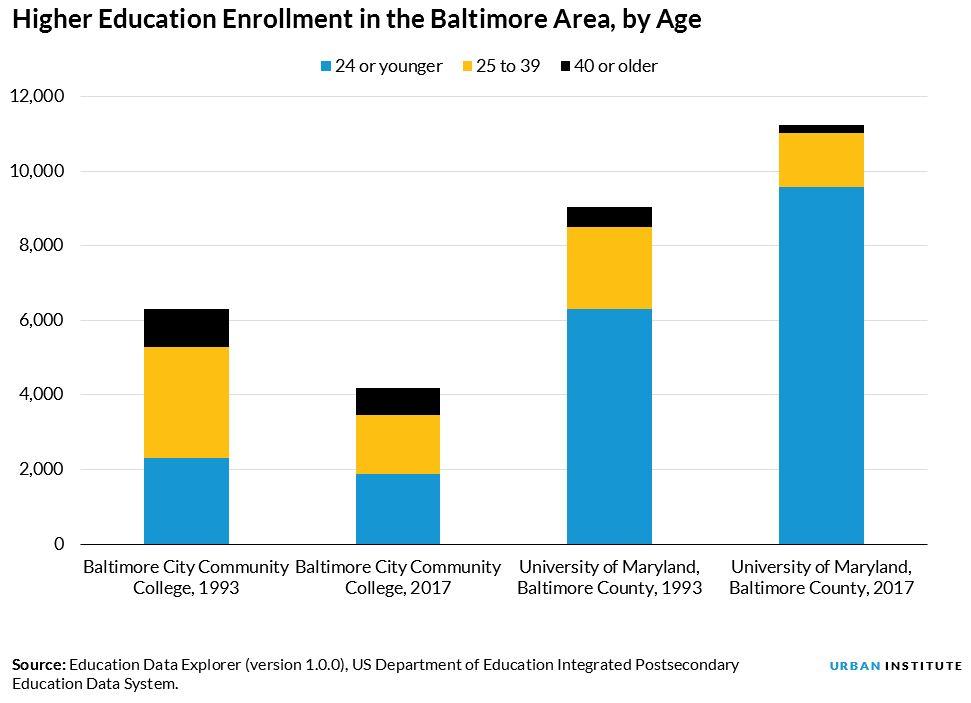
These data pretty clearly show that Baltimore City Community College and the University of Maryland, Baltimore County, are supporting different populations and likely need different resources. As a state policymaker, understanding these trends is important to figuring out how to make decisions that best support students.
Historical education data have always existed, but they have been hard to find and even harder to put into a clean format to draw insights from.
The Education Data Explorer puts those historical data—and a whole lot of other data on school, districts, and colleges—in the hands of the people who need them, so everyone, regardless of statistical training, can make evidence-based decisions that ultimately improve outcomes for students.
Alexandra Tilsley manages communications and outreach for the Urban Institute’s Center on Education Data and Policy. Matthew M. Chingos directs the Center on Education Data and Policy at the Urban Institute.
This post originally appeared on Urban Wire.