
More than a decade since Arizona adopted the nation’s first education savings account program, there’s been a decisive shift towards policies with expansive eligibility. With 2023 dubbed the year of universal choice, six states now have programs that nearly all students can participate in. To fully realize the potential of ESAs, state policymakers must now turn their attention to reforming K-12 funding systems.
Those funding systems weren’t originally designed to accommodate school choice. Every state is unique, but virtually all have revenue streams that aren’t connected to enrollment levels. As a result, school districts retain a portion of a student’s education dollars when the students leave. That creates a tension between ESA dollar amounts and state budgets: Funding participants on par with public schools creates additional new costs, but failing to provide that level of funding could discourage participation and undermine the goal of growing a robust marketplace of education providers.
As ESA programs grow in popularity, some states will incur additional costs for students who switch away from “off-formula” school districts. These districts are primarily supported by local dollars that don’t follow students when they choose to attend other schools. In other words, states don’t contribute formula aid for these students when they’re enrolled in public schools but pick up the tab when they switch to ESAs. The magnitude of these problems will vary by state but are increasingly important with the rise of universal eligibility provisions giving non-public school students access to state funding for the first time.
State policymakers should strive for a unified K-12 funding system where dollars flow seamlessly to ESA participants without breaking the bank.
ESA Funding Approaches Across States
To begin, it’s important to understand how states currently structure ESA funding. Twelve states have statewide ESA policies, four of which exclusively serve students with disabilities. Of the other eight states, all but New Hampshire and South Carolina—which limit participation to lower-income students—have universal or near universal eligibility once fully implemented. Table 1 summarizes the key funding design elements for these states.
Table 1: ESA Key Funding Design Features
| Program | Description | Differentiated Aid | Amount Per Student | Estimated Share of State and Local Funding |
| Arizona’s Empowerment Scholarship Accounts | 90% of the state’s base amount per student plus differentiated aid. | Yes | $6,966 estimated average for students with no disabilities (2023) Range for students with no disabilities is $6,000-$9,000 (2023) Various disability categories are eligible for additional funding. | 74% |
| Arkansas Children’s Educational Freedom Account Program | 90% of the state’s prior year base amount per student. | No | $6,614 (2024) | 63% |
| Florida’s Family Empowerment Scholarship | State’s base amount per student plus a share of other categorical grants. | Yes | $8,942 estimated average (2024) $7,775 estimated average for students with no disabilities (2024) Funding amounts vary considerably by county, grade level, and disability status. | 87% |
| Iowa’s Education Savings Account Program | State’s base amount per student. | No | $7,635 (2024) | 57% |
| New Hampshire’s Education Freedom Account Program | State’s base amount per student plus differentiated aid. | Yes | $4,857 average (2023) $3,787 base plus $1,893 for low income, $2,037 for special education, $741 for ELL, and $741 for non-duplicated 3rd grade students who are below proficient in reading. (2023) | 25% |
| South Carolina’s Education Scholarship Trust Fund Program | Per student amount set by statute, subject to annual adjustment in general appropriations act. | No | $6,000 (2025) | 46% |
| Utah Fits All Scholarship | Per student amount with total funding subject to legislative appropriation, which is initially set at $42.5 million. | No | $8,000 (2025) | 86% |
| West Virginia’s Hope Scholarship Program | Prior year’s statewide average net state aid per student. | No | $4,300 (2023) | 34% |
ESA funding shares calculated based on 2019-2020 U.S. Census Bureau revenue data. ESA amounts were obtained from state sources and EdChoice.org. Note, that the average funding amount for all ESA participants was not available for Arizona and the figure represented is for non-disabled students only. As such, Arizona’s ESA share is likely understated. Since state policymakers have little say over federal dollars, the estimated shares of funding exclude these dollars.
There are three key takeaways from this comparison. First, the per-student amounts ESA students receive—and the share of public education funding this represents—vary considerably. Average ESA amounts range from less than $5,000 in West Virginia and New Hampshire to more than $8,000 per student in Florida and Utah. In all cases, this is less than the per-student funding public schools received in 2019-2020, the most recent year federal data are available. The percentages are likely low estimates, because education funding has generally risen across states since that time.
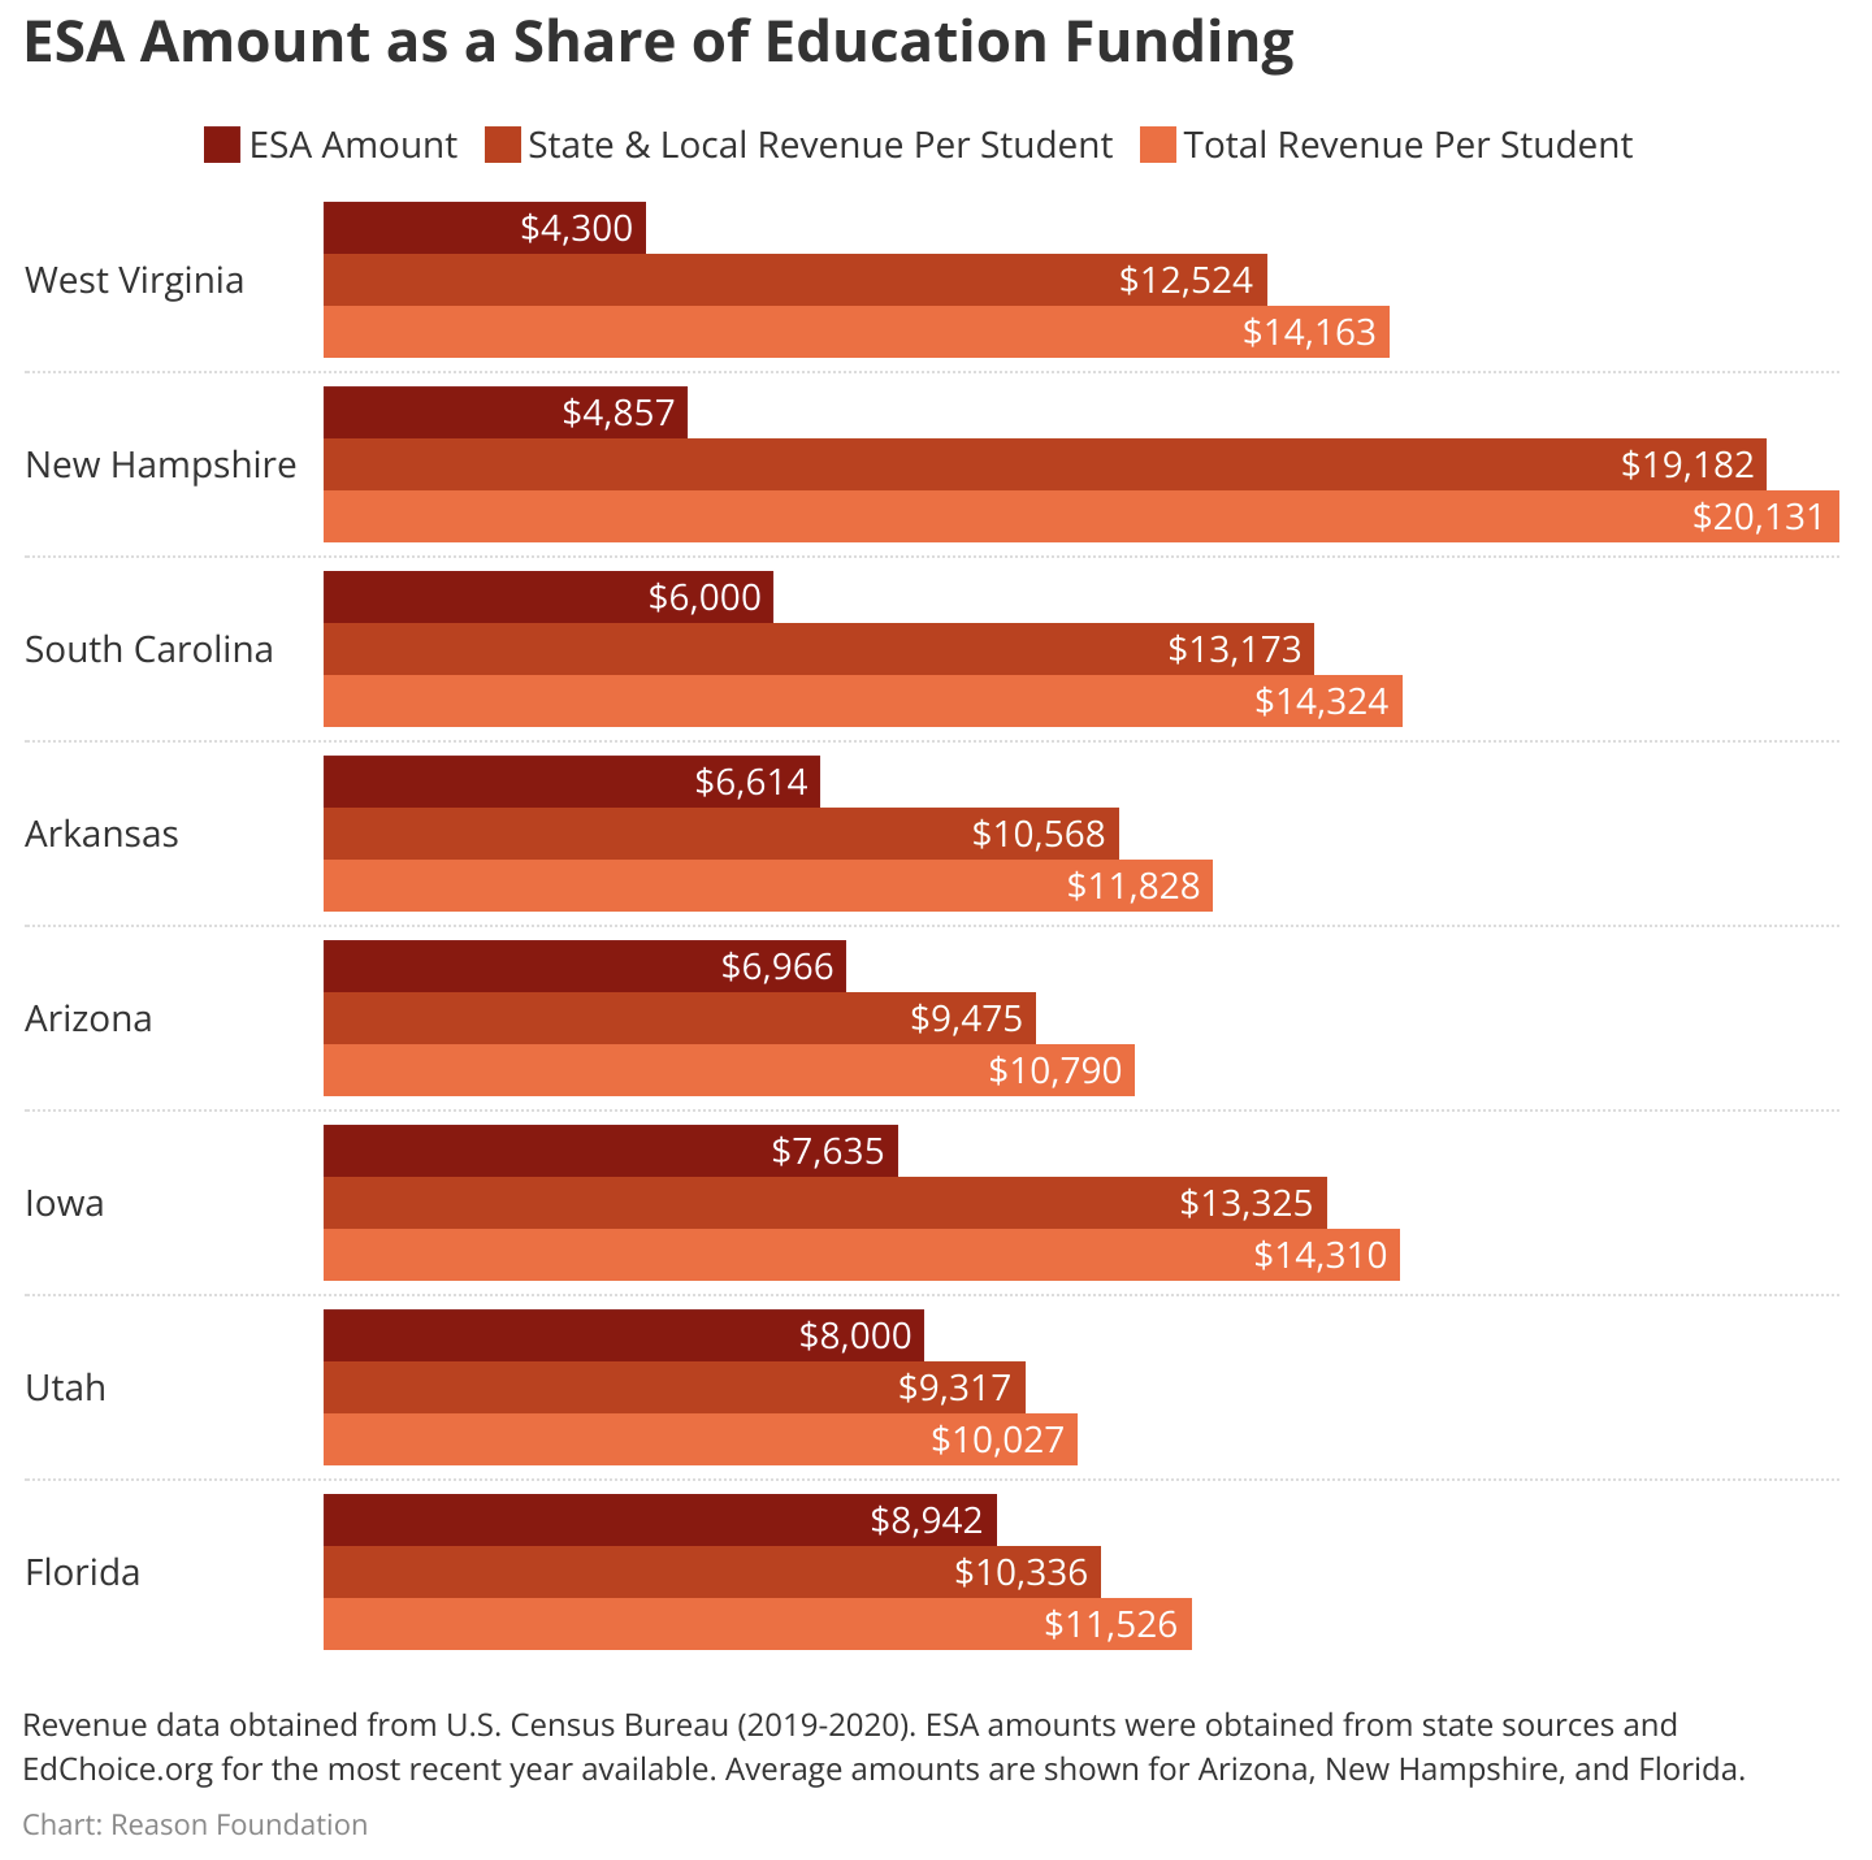
Excluding federal dollars, estimated ESA shares range from 25% in New Hampshire to 87% in Florida. Utah and South Carolina are the only states where ESA dollars aren’t tied to the base funding amounts (West Virginia doesn’t have a base allotment). While Utah provides the highest dollar amount for non-disabled students, it also caps the number of participants based on appropriations. Florida’s ESA program is unique in that it is partially funded by tax credit donations, caps the number of participants eligible for differentiated funding, and establishes funding amounts that vary considerably across school districts.
Five states don’t provide differentiated funding for high-need ESA participants, although four of these states—Arkansas, Iowa, South Carolina and Utah—have separate school choice programs serving disadvantaged students. In contrast, Arizona, New Hampshire, and Florida target additional dollars to ESA participants in a way that mirrors their respective funding formulas. For example, participating students in Arizona with a speech language impairment or emotional disability receive up to an estimated $10,000 while students with disabilities in New Hampshire generate an additional $2,037—the same per pupil amounts students receive in public schools. While differentiated funding is costlier, it gives students access to the resources they would’ve received had they attended public schools and could provide greater access to specialized services.
Finally, West Virginia’s approach to ESA funding highlights the shortcomings of its resource-based school finance formula in an era of robust choice. Rather than using a base amount to deploy dollars, the Mountain State funds inputs such as staff salaries, transportation, and other operating expenses. As a result, it lacks a clear mechanism for setting ESA amounts. To get around this problem, the prior year’s average state aid per student is used. But this figure isn’t tied to the state’s formula, which delivers more dollars per student on average since it is funded with both state and local revenue. If West Virginia’s ESA funding were instead tied to formula amounts—which is possible but more complicated with a resource-based funding formula— ESA students would receive a greater share of per student education dollars.
A Closer Look at ESA Funding Amounts
Comparing New Hampshire and Arizona illustrates how school finance systems interact with school-choice funding. Both states employ funding formulas that allocate dollars based on student characteristics, including additional amounts for various categories of student disadvantage. They also have similar approaches to ESA funding, since program amounts are tied to their respective formulas. Yet, despite New Hampshire spending nearly twice as much per student as Arizona on K-12 education, its ESA participants receive far fewer dollars than Arizona’s participants on average.
New Hampshire delivers only 23.5% of state and local education dollars through its primary funding formula. Outside of the formula, school districts are heavily reliant on local funds, which are based on local tax rates and property wealth. As a result, the state’s base funding allotment—which largely determines what ESA participants receive—is a paltry $3,787 per student, even though school districts receive $19,182 per student on average. New Hampshire’s public schools are well-funded, but only a fraction of these dollars is delivered through its formula.
The Granite State’s reliance on local dollars has another important implication: About 16% of its school districts operate off-formula, meaning they raise their entire funding entitlement with property tax dollars. Because these districts’ revenue is unaffected by marginal enrollment changes, they retain all funding when students leave for the ESA program—even though the state incurs an additional per student expense. It’s easy to see how using state funds for ESAs could also be costly in a state like Nebraska, where nearly two-thirds of its school districts operate off-formula.
In comparison, 67.8% of Arizona’s education dollars are allocated through its formula, with outside-the-formula dollars contributing less to overall funding. This is why its base funding allotment, which ranges from $6,000 per student to $9,000 per student, is more robust.
A state’s school finance system can affect ESA policy design. A streamlined school finance system yields an ESA amount that’s close to parity with per-student funding in public schools. Meanwhile, a funding system with a sizeable share of non-formula dollars can place a low ceiling on ESA values and create additional burdens for taxpayers.
Modernizing K-12 Funding Systems
School choice will be an enduring part of the K-12 ecosystem, and funding systems must be modernized to reflect this. Absent reform, ESA amounts will likely remain well below parity with public school funding, and large shares of education dollars will stay in school districts for students the districts no longer serve. Reasonable people can disagree on what share of K-12 funding should follow school-choice participants, but ESA amounts should be determined by intentional policy design rather than as byproducts of antiquated school finance systems. Policymakers can focus on three steps to make the funding systems more amenable to ESAs.
First, states should adopt a student-centered funding formula that allocates dollars based on student characteristics. Without a clear and consistent dollar amount attached to each student determining ESA amounts can be unnecessarily complex. The vast majority of states already have this type of mechanism in place, but others—such as Idaho, North Carolina, and Alabama—lag behind. While this alone doesn’t ensure funding portability, it’s the cornerstone of a unified funding system.
Next, policymakers must maximize the share of education dollars flowing through their state’s formula. This addresses the issue faced in New Hampshire where, despite having student-centered allocation, outside-the-formula dollars keep the state’s ESA values low. This is probably the most critical yet underappreciated component of funding portability. There isn’t just one way to do this, with much depending on a state’s existing tax policy, constitutional restrictions, and other political and economic considerations. But potential solutions range from Indiana’s full-state funding model to Texas’s recapture mechanism, as well as California’s strict limits on local operating dollars. While reforms of this magnitude are challenging, the basic idea is simple: limit outside-the-formula dollars.
Finally, ESA funding amounts should include differentiated funding. Just as school finance systems target additional state dollars to higher-need students, ESA programs should adopt the same principle to ensure accessibility for all students and ensure the right incentives are in place for providers. Fortunately, as Arizona and New Hampshire illustrate, this is easy to do once a student-centered funding formula is in place and funding is already delivered based on student characteristics.
Reforms of this magnitude can be a big lift. As an alternative, state legislators can find other ways to ensure more dollars follow ESA students even within a disjointed funding system, but these fixes will depend largely on local context and could still present political and even constitutional hurdles in some states.
Conclusion
Unless K-12 funding systems are modernized, ESA funding amounts and state budgets will continue to be at odds in many states. While overhauling school funding systems is difficult work, school-choice advocates could find an unlikely bedfellow in funding-equity advocates in state legislatures. Both coalitions want transparent, fair systems that attach greater resources to higher-need students. In many ways, funding equity and portability are two-sides of the same coin. Short of comprehensive funding reform, policymakers can pursue targeted fixes that increase the share of dollars following ESA students. Regardless, any discussion of school finance reform must recognize the role of school choice in public education. Only a unified funding system can provide policymakers, and parents, with the levers needed to match strategic priorities with dollars.
Aaron Smith is director of education reform at the Reason Foundation, where Christian Barnard is a senior policy analyst.