When the Covid-19 pandemic started in March 2020, schools in the United States closed immediately and remained closed for the rest of that school year. When school was set to start again the following fall, many school districts decided to continue online virtual education as a mitigation measure. Other districts decided to resume in-person schooling, many with masking and social distancing in place. Schooling mode decisions varied throughout the school year, and it took until the spring of 2021, a full year after the initial closures, for in-person schooling to be available to all students in the United States.
We’re now nearly four years out from that period of educational disruption, but the impacts persist. Recovery is lagging, and students are struggling on a variety of dimensions, including academically. Public school enrollments are down, and many teachers have left education due to the stressors of teaching during a pandemic. Covid-19 changed the landscape of education in the U.S.
With all the discussion about the impacts of the pandemic, it’s especially important to be clear about who was impacted the most. The United States was an outlier in school closures compared to other countries throughout the world (see Figure 1). Allowing kids back into school was heavily debated here while it was prioritized in other countries. Although the United States as a whole experienced some of the longest school closures during the pandemic, they were not uniform across the country. Some students returned to school in person on the first day of Fall 2020, while others spent almost an entire additional school year without setting foot in their school building.
Figure 1: Average number of days with school closed, by region, January 2020 – December 2021.
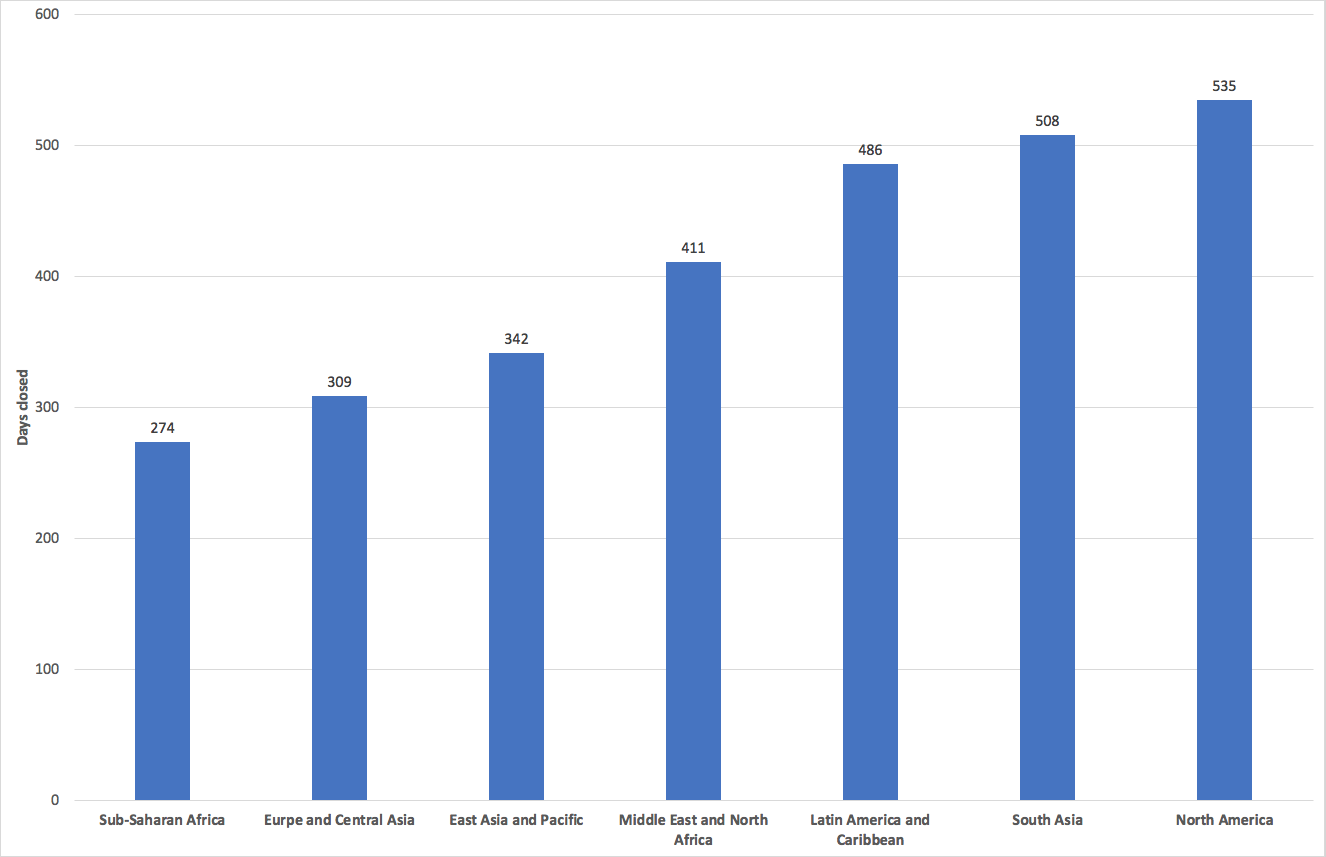
Source: Regional closures aggregated from country-level closures using data from the Oxford Covid-19 Policy Tracker (Hale, et al. 2021).
In a recent article, we look at the data on school closures. Perhaps surprisingly, schools in areas with higher Covid case rates were neither more nor less likely to have virtual schooling compared to those with lower case rates. Districts with high rates of Covid-19 cases used virtual education for an average of 48 days during the 2020–21 school year. In comparison, those with low rates of Covid-19 used virtual education for an average of 51 days. Areas that were hit harder by the pandemic were not more likely to close in-person school, and less in-person school did not correlate with lower case rates.
Differences in virtual schooling depended more on the political leanings of the area. More right-leaning areas that have a higher Republican vote share were far less likely to switch to virtual school. Districts in those areas spent on average 39 days with virtual schooling, while left-leaning areas spent 54 days on average. Beyond politics, areas with more Black students spent 56 days in virtual school on average (compared to 36 days for areas with a lower share of Black students) and districts with a higher share of Hispanic students were also more likely to switch to virtual schooling (53 vs 43 days).
Virtual schooling was also more common in areas with less broadband internet usage, even though internet access would have been essential for using Zoom and online classroom platforms to participate in school each day. During the pandemic, there were reports of students using mobile devices and seeking Wi-Fi hotspots in public places in order to complete their school work, and many students fell behind due to lack of consistent access to the internet and, therefore, school.
Finally, places with higher rates of unemployment also had more time spent in virtual schooling. On average, these areas spent 57 days in virtual schooling while places with lower rates of unemployment only spent 40 days in virtual schooling.
All of these pieces taken together emphasize the fact that school closures exacerbated existing inequalities. Access to in-person schooling was not equal for all children, and those with more access to in-person schooling were typically the same students who already had more access to other academic resources. The Covid-disrupted school year widened existing gaps in access to education.
We’ve also seen some of the results of a year of academic disruption. Test scores fell for all students after the pandemic and scores have still not returned to pre-pandemic levels for many districts. However, these overall trends mask an important part of the story. Test scores dropped much more for students who had less access to in-person schooling (see Figure 2). In fact, average test-score pass rates in math fell by nearly twice the amount in the areas that had the most virtual schooling compared to those that had the least virtual schooling. Similarly for ELA scores, the largest drops in proficiency rates occurred in school districts that had the most virtual schooling. Because more disadvantaged areas had more virtual schooling, these areas also saw larger declines in test scores. It is clear that virtual schooling was not a good substitute for time spent at school in-person.
Figure 2: Average change in pass rates on state standardized assessments in Spring 2021 versus Spring 2018–2019
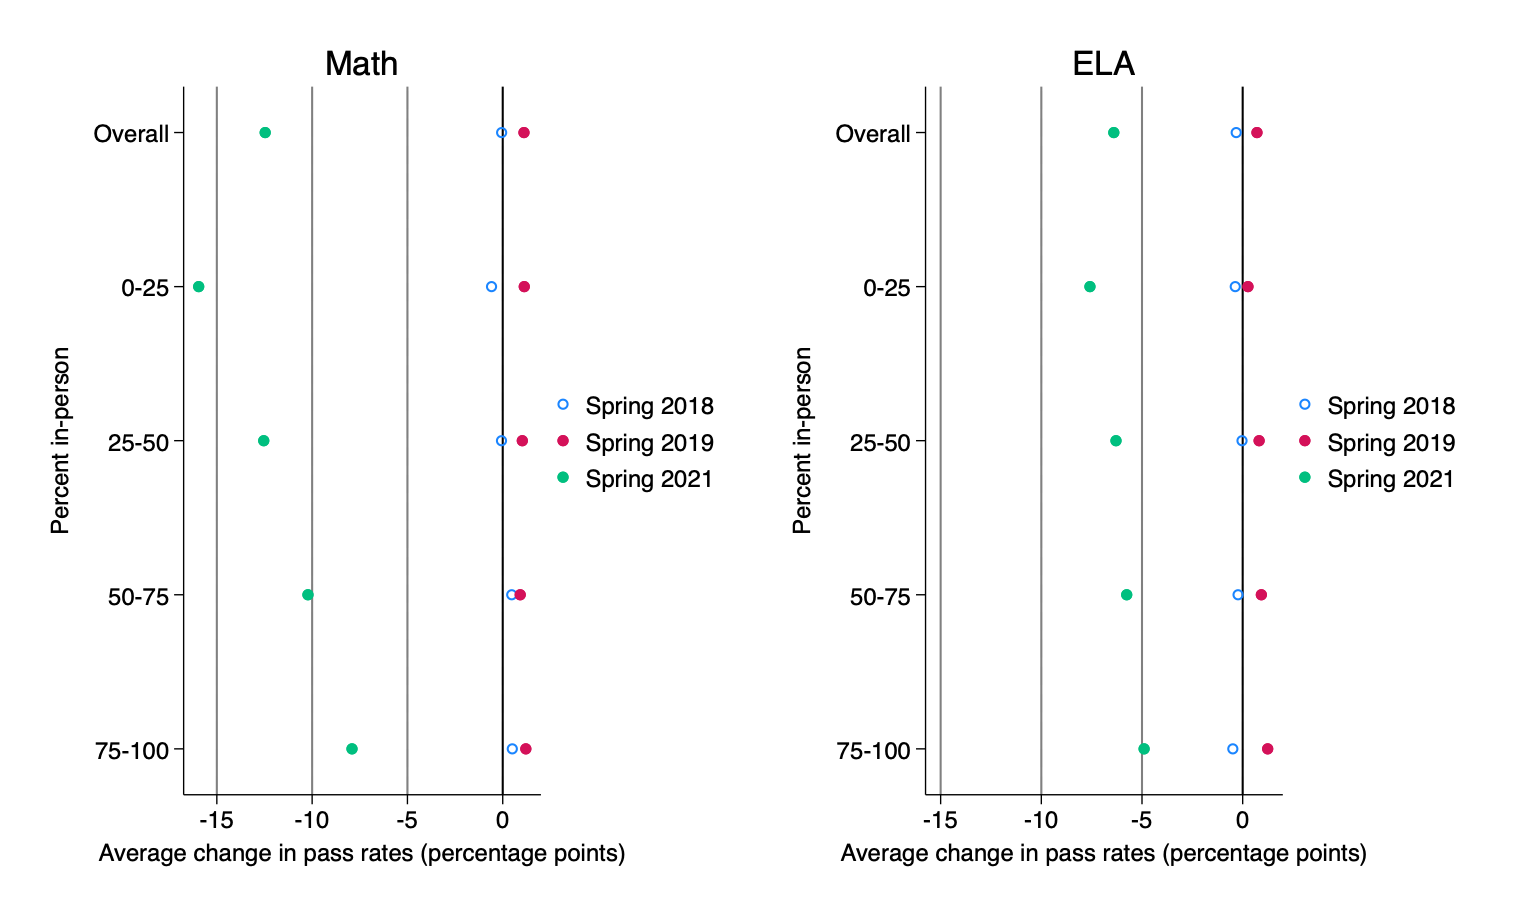
Source: Data for this figure comes from the final data set from the replication materials for Jack et al. (2023).
School closures and overall disruptions to education during the pandemic increased disparities for students in the United States. As various sources of funding have been provided to target recovery efforts, it is important for education leaders and policymakers to be aware of the experiences different students had during the pandemic and understand which students were most impacted by the loss of in-person learning. School closures need to continue to be part of the conversation, and policymakers and other leaders need to focus policy efforts on the students who were most likely to miss out on in-person learning to help reduce the increased inequalities that developed during the pandemic.
Rebecca Jack is a PhD student in economics at the University of Nebraska-Lincoln. Emily Oster is a professor of economics at Brown University.