 The number of charter schools grew rapidly for a quarter-century after the first charter opened its doors in 1992. But since 2016, the rate of increase has slowed. Is the pause related to a decline in charter effectiveness?
To find out, we track changes in student performance at charter and district schools on the National Assessment of Educational Progress, which tests reading and math skills of a nationally representative sample of students every other year. We focus on trends in student performance from 2005 through 2017 to get a sense of the direction in which the district and charter sectors are heading. We also control for differences in students’ background characteristics. This is the first study to use this information to compare trend lines. Most prior research has compared the relative effectiveness of the charter and district sectors at a single point in time.
Our analysis shows that student cohorts in the charter sector made greater gains from 2005 to 2017 than did cohorts in the district sector. The difference in the trends in the two sectors amounts to nearly an additional half-year’s worth of learning. The biggest gains are for African Americans and for students of low socioeconomic status attending charter schools. When we adjust for changes in student background characteristics, we find that two-thirds of the relative gain in the charter sector cannot be explained by demography. In other words, the pace of change is more rapid either because the charter sector, relative to the district sector, is attracting a more proficient set of students in ways that cannot be detected by demographic characteristics, or because charter schools and their teachers are doing a better job of teaching students.
Three Decades of Growth
The nation’s first charter school opened in Minnesota in 1991, under a state law that established a new type of publicly funded, independently operated school. School systems in 43 states and the District of Columbia now include charter schools, and in states like California, Arizona, Florida, and Louisiana, more than one in 10 public-school students attend them. In some big cities, those numbers are even larger: 45 percent in Washington, D.C., 37 percent in Philadelphia, and 15 percent in Los Angeles.
Nationwide, charter enrollment tripled between 2005 and 2017, with the number of charter students growing from 2 percent to 6 percent of all public-school students. But the rate of growth slowed after 2016 (see “Why Is Charter Growth Slowing? Lessons from the Bay Area,” research, Summer 2018). There are several possible reasons for this. The rate of states passing charter laws declined after 1999, and many of the laws passed since 2000 have included provisions that can stymie growth: caps on the number of schools allowed, arcane application requirements, and land-use and other regulations. In addition, a political backlash is slowing charter expansion in some states.
Researchers who have looked at the academic performance of students in charter and district schools at a single point in time have generally found it to be quite similar. For example, the 2019 “School Choice in the United States” report by the National Center for Education Statistics looked at students’ reading and math test scores in 2017 and found “no measurable differences” between the sectors. Also, multi-state studies by the Center for Research on Education Outcomes, or CREDO, at Stanford University have found only small differences in achievement at charter and district schools.
Analyses that summarize findings from multiple studies also report little difference on average between the two sectors, though they do identify specific situations in which charter schools excel. In a comprehensive review published in 2018, Sarah Cohodes wrote that, while the evidence on the whole shows “on average, no difference” between the two sectors, “urban charter schools serving minority and low-income students that use a ‘no excuses’ curriculum” have “significant positive impacts.” In a 2019 meta-analysis of 47 charter studies, Julian Betts and Y. Emily Tang found overall only a small predicted gain from attending a charter of between one-half and one percentile point. And in a 2020 paper, Anna Egalite reported little difference, on average, between the two sectors but wrote that charters in some locales reveal “statistically significant, large, and educationally meaningful achievement gains” for low-income students, students of color, and English language learners.
However, no study has used nationally representative data with controls for background characteristics to estimate trends in student performance over a twelve-year period. That is our goal here.
Data and Method
Our data come from the National Assessment of Educational Progress. NAEP is a low-stakes test that does not identify the performance of any student, teacher, school, or school district. Rather, it is used to assess the overall proficiency of the nation’s public-school students in various subjects at the state and national levels. A nationally representative sample of students in grades 4, 8, and 12 take the reading and math tests every other year. We do not report results for 12th-grade students because the number of test observations in the charter sector are too few to allow for precise estimation.
Between 2005 and 2017, more than four million tests were administered to district students, and nearly 140,000 tests were given to charter students, with data available on each student’s ethnicity, gender, eligibility for free and reduced lunch, and, for eighth-grade students only, the level of parental education, number of books in the home, and availability of a computer in the home. We do not include in our main analysis controls for participation in the federally funded special education and English language learner programs, because schools in the two sectors may define eligibility differently. However, we confirm that our results do not change in any material way when controls for these two variables are introduced.
We report trends in standard deviations, a conventional way of describing performance differences on standardized tests. Because NAEP tests are linked by subsets of questions asked both in grade 4 and 8, we can use this metric to estimate the difference in the average performances of students in those grades. We then create an estimate of a year’s worth of learning based on the average difference in student performance between those grades.
We compare performance of student cohorts on those tests in 2005 and 2017 and find that, on average, students in 8th grade performed 1.23 standard deviations higher than students in 4th grade. This implies that students learn enough each year to raise their reading and math test scores by approximately 0.31 standard deviations. Accordingly, we interpret a test-score improvement of 0.31 standard deviations as equivalent to roughly one year’s worth of learning.
Trends in performance are based on the distance between the charter and district school scores on NAEP tests in 2007, 2009, 2011, 2013, 2015, and 2017 and their average scores in 2005, which are set to zero. We report these differences in standard deviations. We apply the survey weights provided by NAEP to obtain representative results.
Investigating Differences by School Type
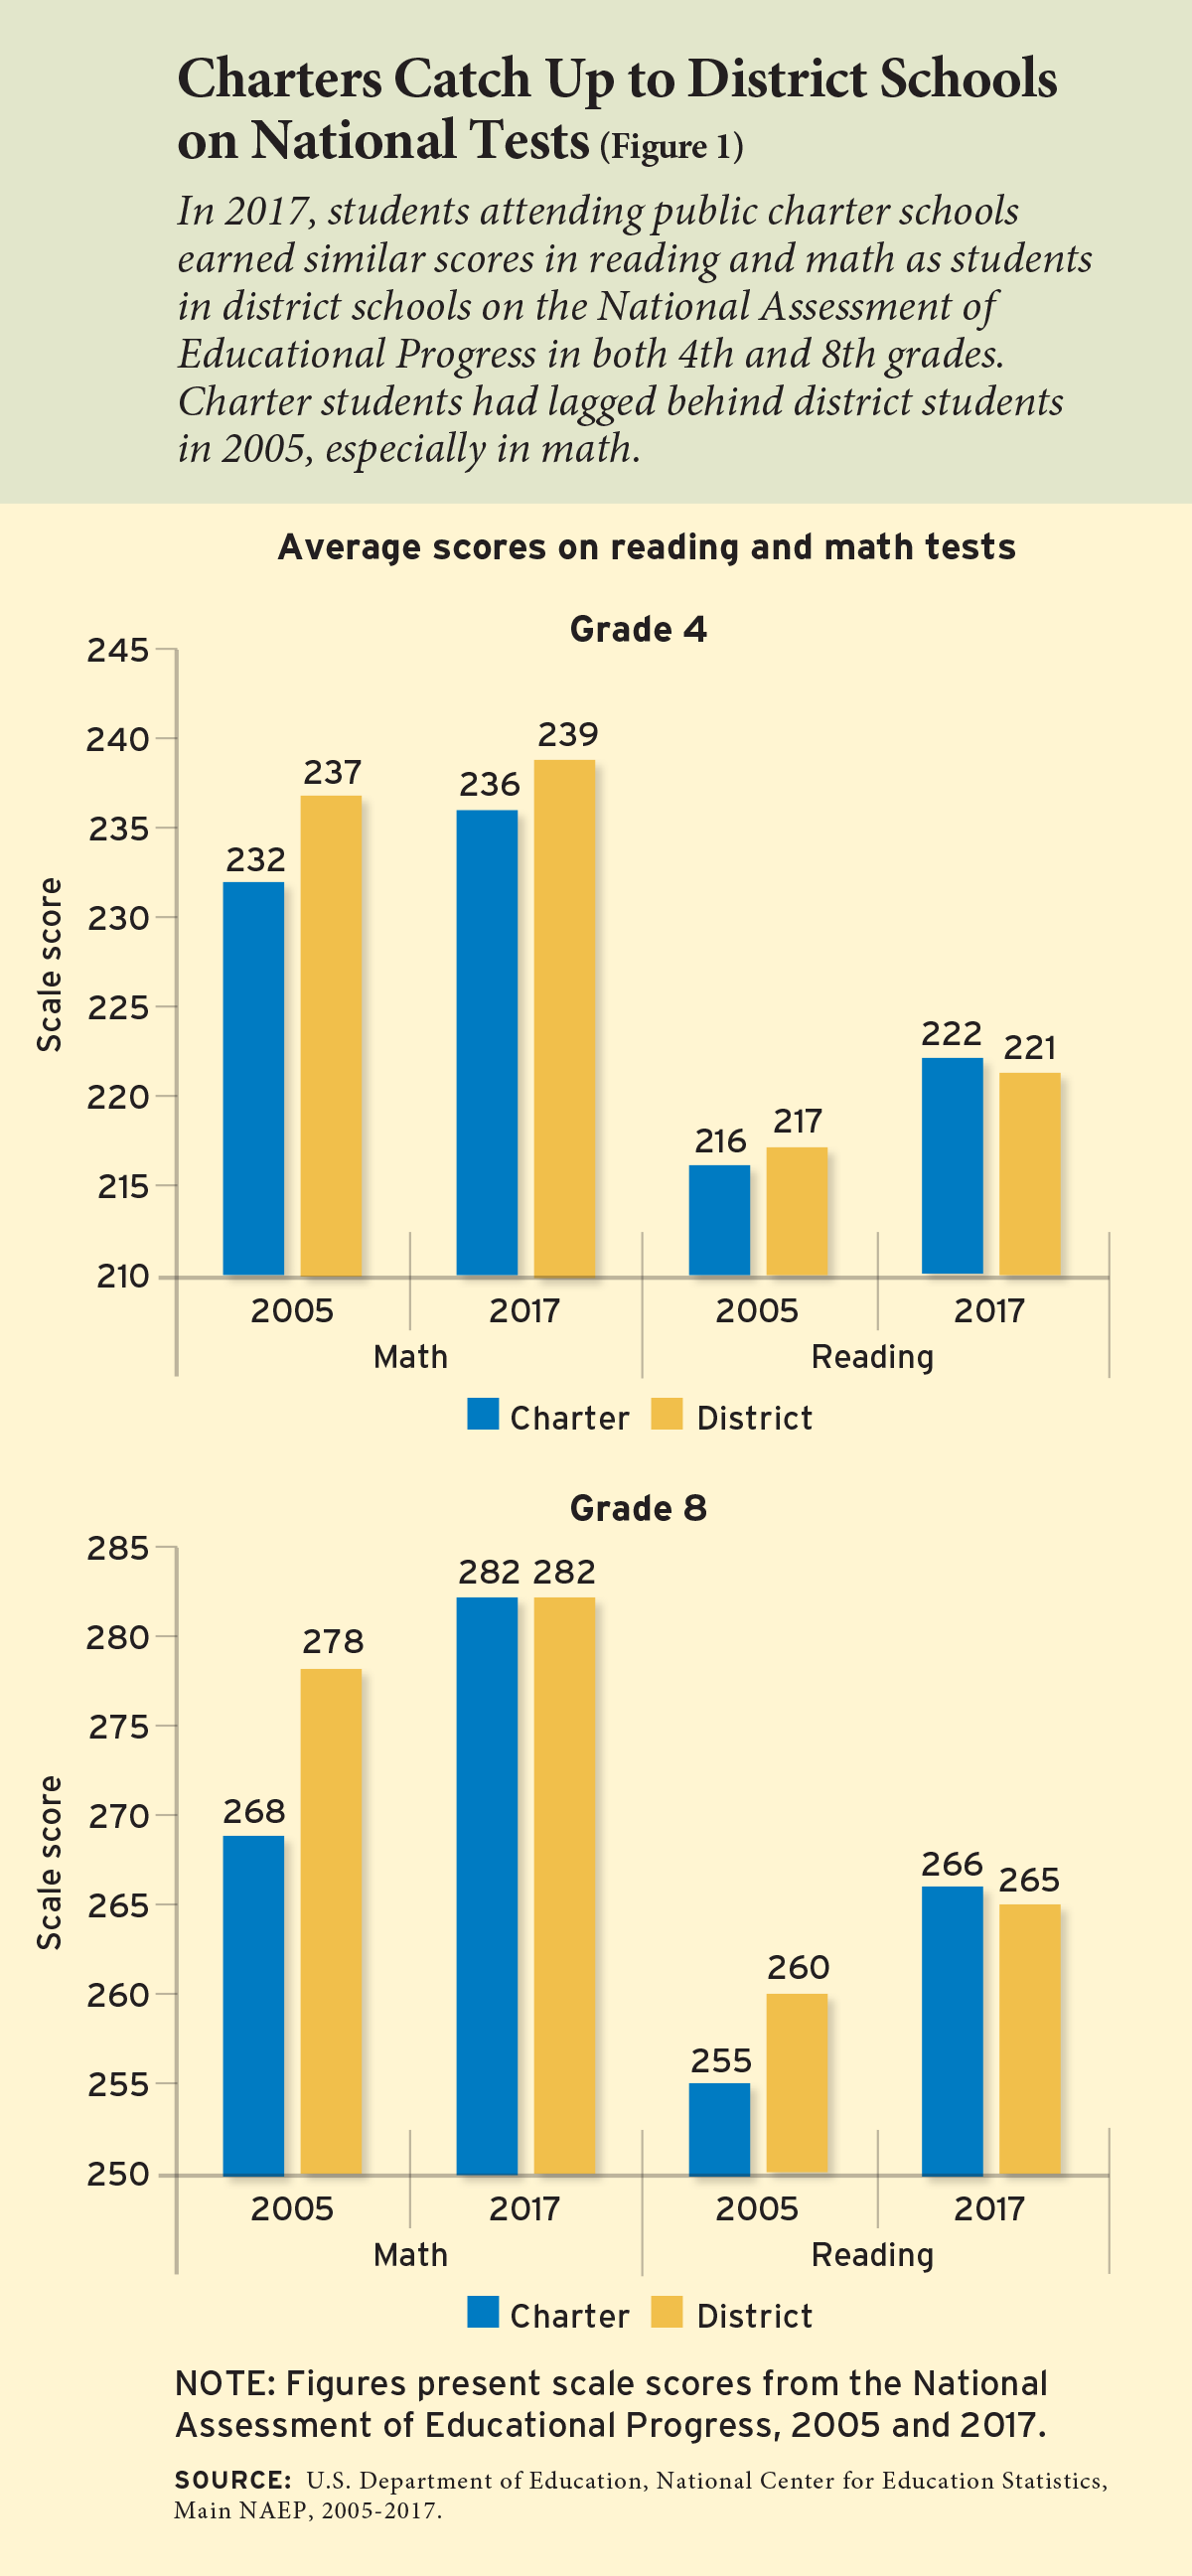
We first look at differences in average scores on the 2005 and 2017 tests. On average, district schools outperformed charter schools in 2005 in both the 4th and 8th grades—particularly in math. For 4th-grade students, the average math score at district schools was 237 points compared to 232 at charter schools, a difference of 0.15 standard deviations. In reading, the district school average was 217 compared to 216 at charters. For 8th-grade students, the average math score at district schools was 278 compared to 268 at charters, a difference of about 0.28 standard deviations. In reading, the district school average was 260 compared to 255 at charters.
By 2017, most of these differences had disappeared, or nearly so (see Figure 1). In 4th grade, charters still trailed districts by 3 points in math, with an average score of 236 compared to 239. In reading, however, the average charter score was one point higher at 266 compared to 265 for district schools. On 8th-grade tests, the sector had the same average score in math of 282 and virtually the same in reading, at 266 for charters and 265 for district schools. None of these 2017 differences were large enough to be statistically significant.
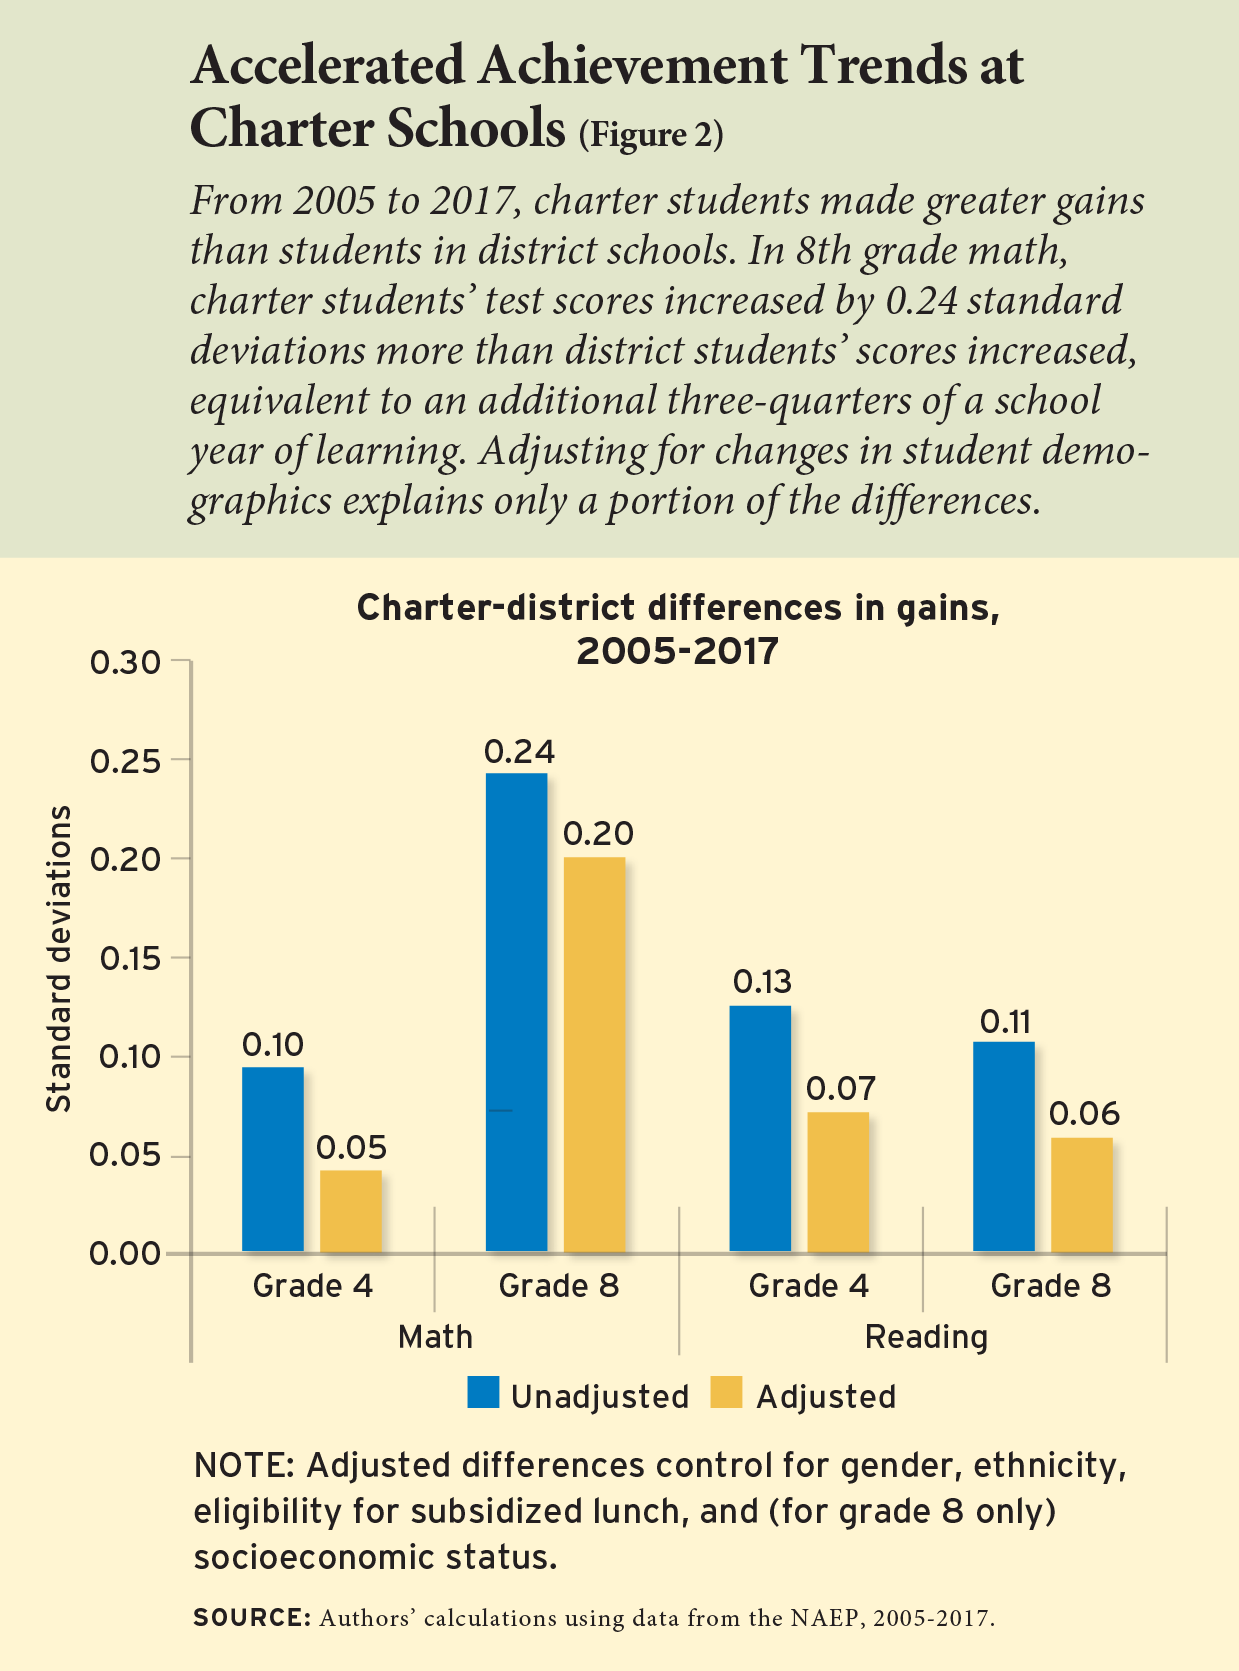
In looking at performance trends across all seven of the NAEP math and reading tests from 2005 through 2017, we find a larger increase in student achievement for students at charter schools than for students at district schools (see Figure 2). On average across grades and subjects, test scores at charter schools improved by 0.24 standard deviations during this time compared to 0.1 standard deviations at district schools.
Changes in the demographic composition of students who were enrolled at district and charter schools during those years may have differed, so we perform additional analyses that adjust for students’ background characteristics. After that adjustment, the test scores for students at charter schools improved by 0.09 standard deviations more than scores for students at district schools, which is equivalent to a little less than one-third of a year’s worth of learning. The differences are larger for 8th-grade students, at 0.12 standard deviations, than for 4th-grade students, at 0.06 standard deviations.
In other words, a considerable difference in the trends in student performance between charters and district schools cannot be explained by demographics. Either there are unobserved changes in student characteristics related to performance in the two sectors or charter schools, relative to district schools, are providing an increasingly effective learning environment.
Results by Ethnicity
We then investigate differences in achievement by various student groups. To see whether cohort gains vary by ethnicity, we estimate changes for African Americans, white Americans, Hispanic Americans, and Asian Americans. In the absence of citizenship information, we assume that all tested students are Americans.
In 2005, average test scores for African-American students in both sectors were the lowest of the four groups. Test performance for African Americans improved over time at both district and charter schools, but the trend was far more dramatic at charters. This is especially noteworthy as one in three charter students is African American.
At district schools, average scores on all tests for cohorts of African Americans in grades 4 and 8 improved by 0.14 standard deviations between 2005 and 2017. At charter schools, the combined average gain was more than twice as large, at 0.33 standard deviations. For African-American 8th-grade charter students, average math scores improved by 0.46 standard deviations, which was four times larger than for students attending district schools. In reading, average scores improved by 0.33 standard deviations for students at charters, twice those of students attending district schools. Given the importance of closing the Black-white test score gap, the much steeper upward trend at charters is particularly meaningful. The magnitude of the difference is roughly a half-year’s worth of learning.
We compare the differences in achievement gains between the two sectors after adjusting for students’ background characteristics. Across reading and math tests at both grade levels, we find that cohorts of African Americans at charters performed higher by 0.17 standard deviations compared to those at district schools (see Figure 3). The upward trend is nearly as steep as the gains in the unadjusted estimates. In other words, very little of the differential gains in test-score performance by African-American students can be explained by changes in observable background characteristics.
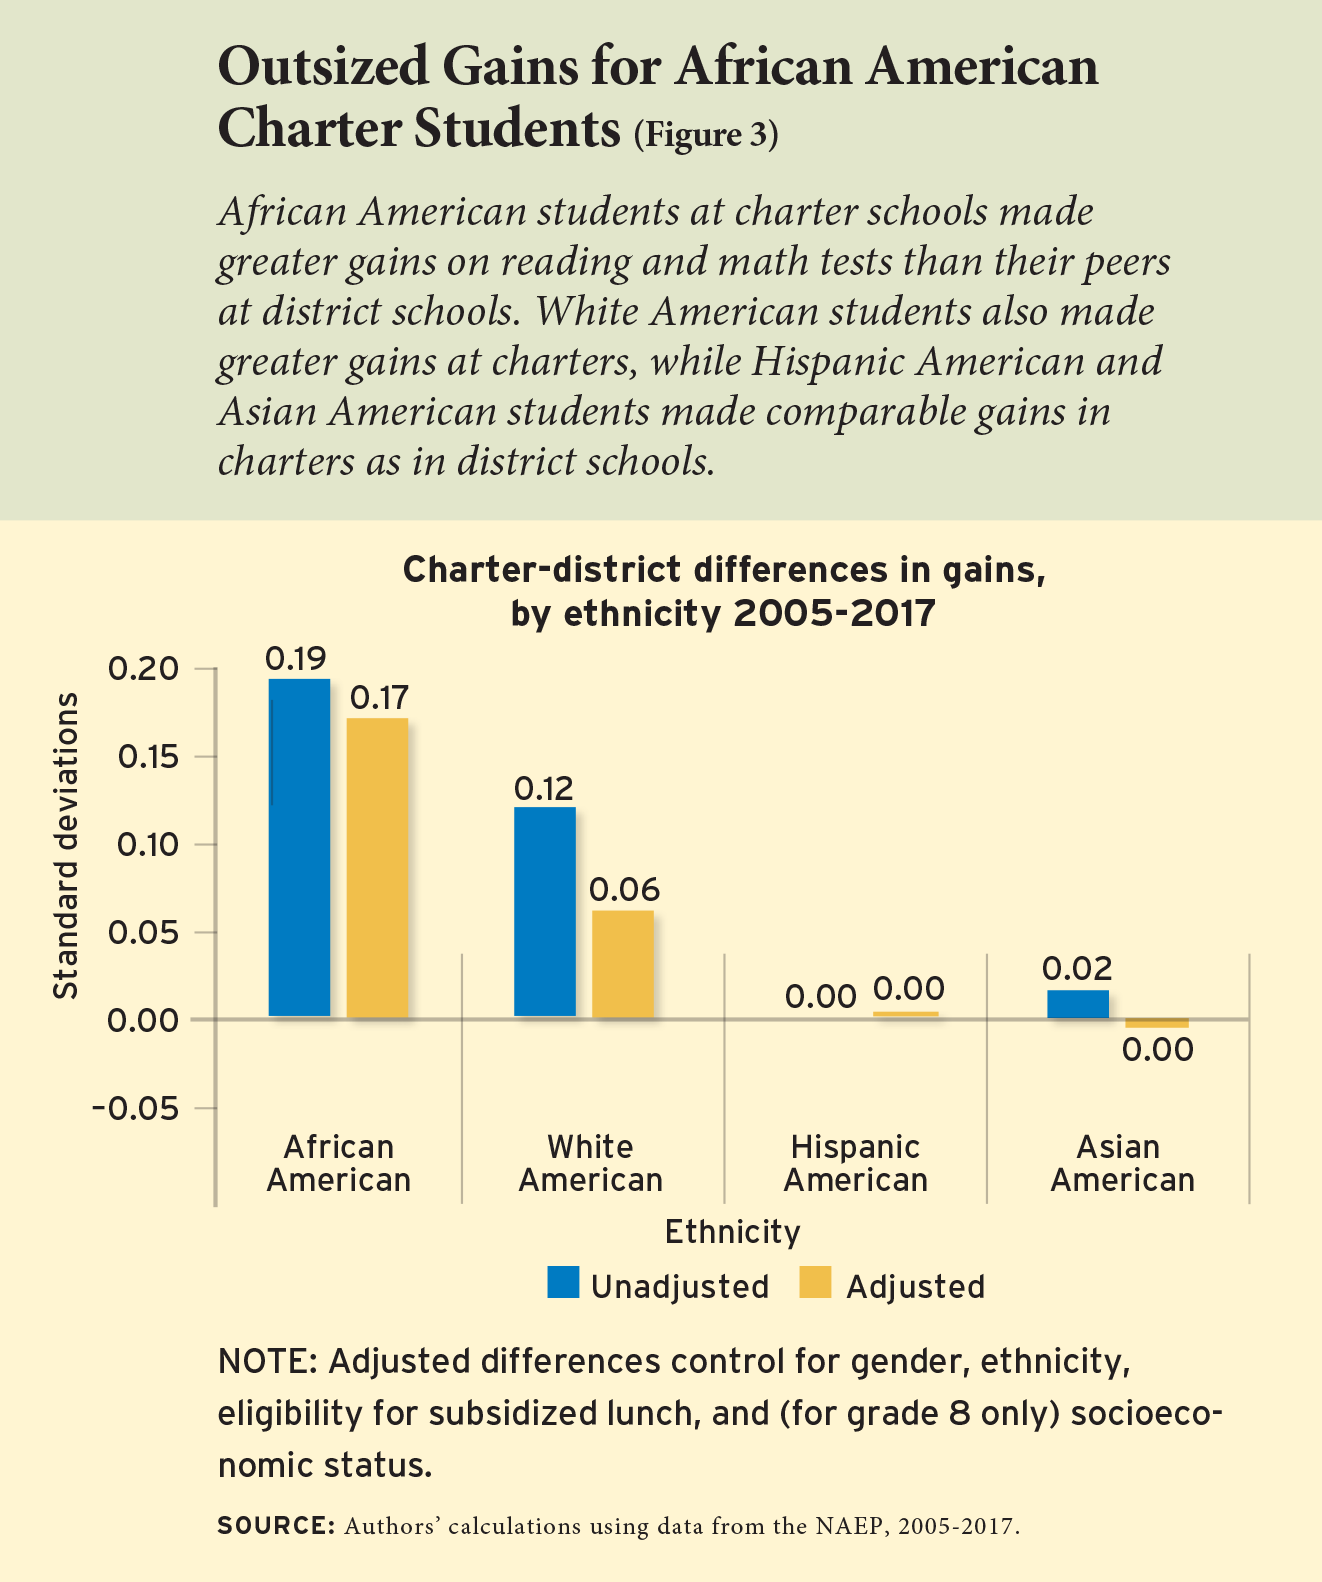
We next look at white Americans, who also account for about one in three charter students. Average scores for white students improve by 0.22 standard deviations in all grades and tests, more than twice the district sector gain of 0.1 standard deviations. After controlling for student characteristics, that estimate drops to 0.06 standard deviations. That unexplained differential change for white students is about one-third as large as it is for African Americans.
We find no clear difference in performance trends of Hispanic Americans in district and charter schools between 2005 and 2017. Hispanic Americans account for 24 percent of 4th-grade charter students and 30 percent of 8th graders. In both charters and district schools, their average combined performance increased by 0.21 standard deviations. These strong gains persist after controlling for background characteristics, emerging as one of the brightest and most notable aspects of education in the United States over this period. It is hard to conclude anything other than that Hispanic-American students are doing well in both sectors.
Much the same can be said for Asian Americans, the smallest ethnic group within the charter sector. They comprised only 4 percent of 4th-grade charter students and 5 percent of 8th-grade charter students. The advances in performance are higher for this segment of all tested students in both district and charter sector than for the three larger groups.
Results by Socioeconomic Status
To estimate trends by students’ socioeconomic status, we create an index based on 8th-grade student reports of parental education, availability of books in the home, and a computer in the home. We divide students into four equally sized groups, or quartiles, based on this index and discuss here the differences in achievement gains between those in the highest and lowest socioeconomic quartiles. NAEP did not ask 4th-grade students about their parents’ education and home possessions, so we cannot conduct a parallel analysis at that grade level.
We start by looking at average scores for 8th-grade students in the highest socioeconomic quartile. At district schools, cohort average scores improve by 0.02 standard deviations in math and 0.09 standard deviations in reading (see Figure 4).
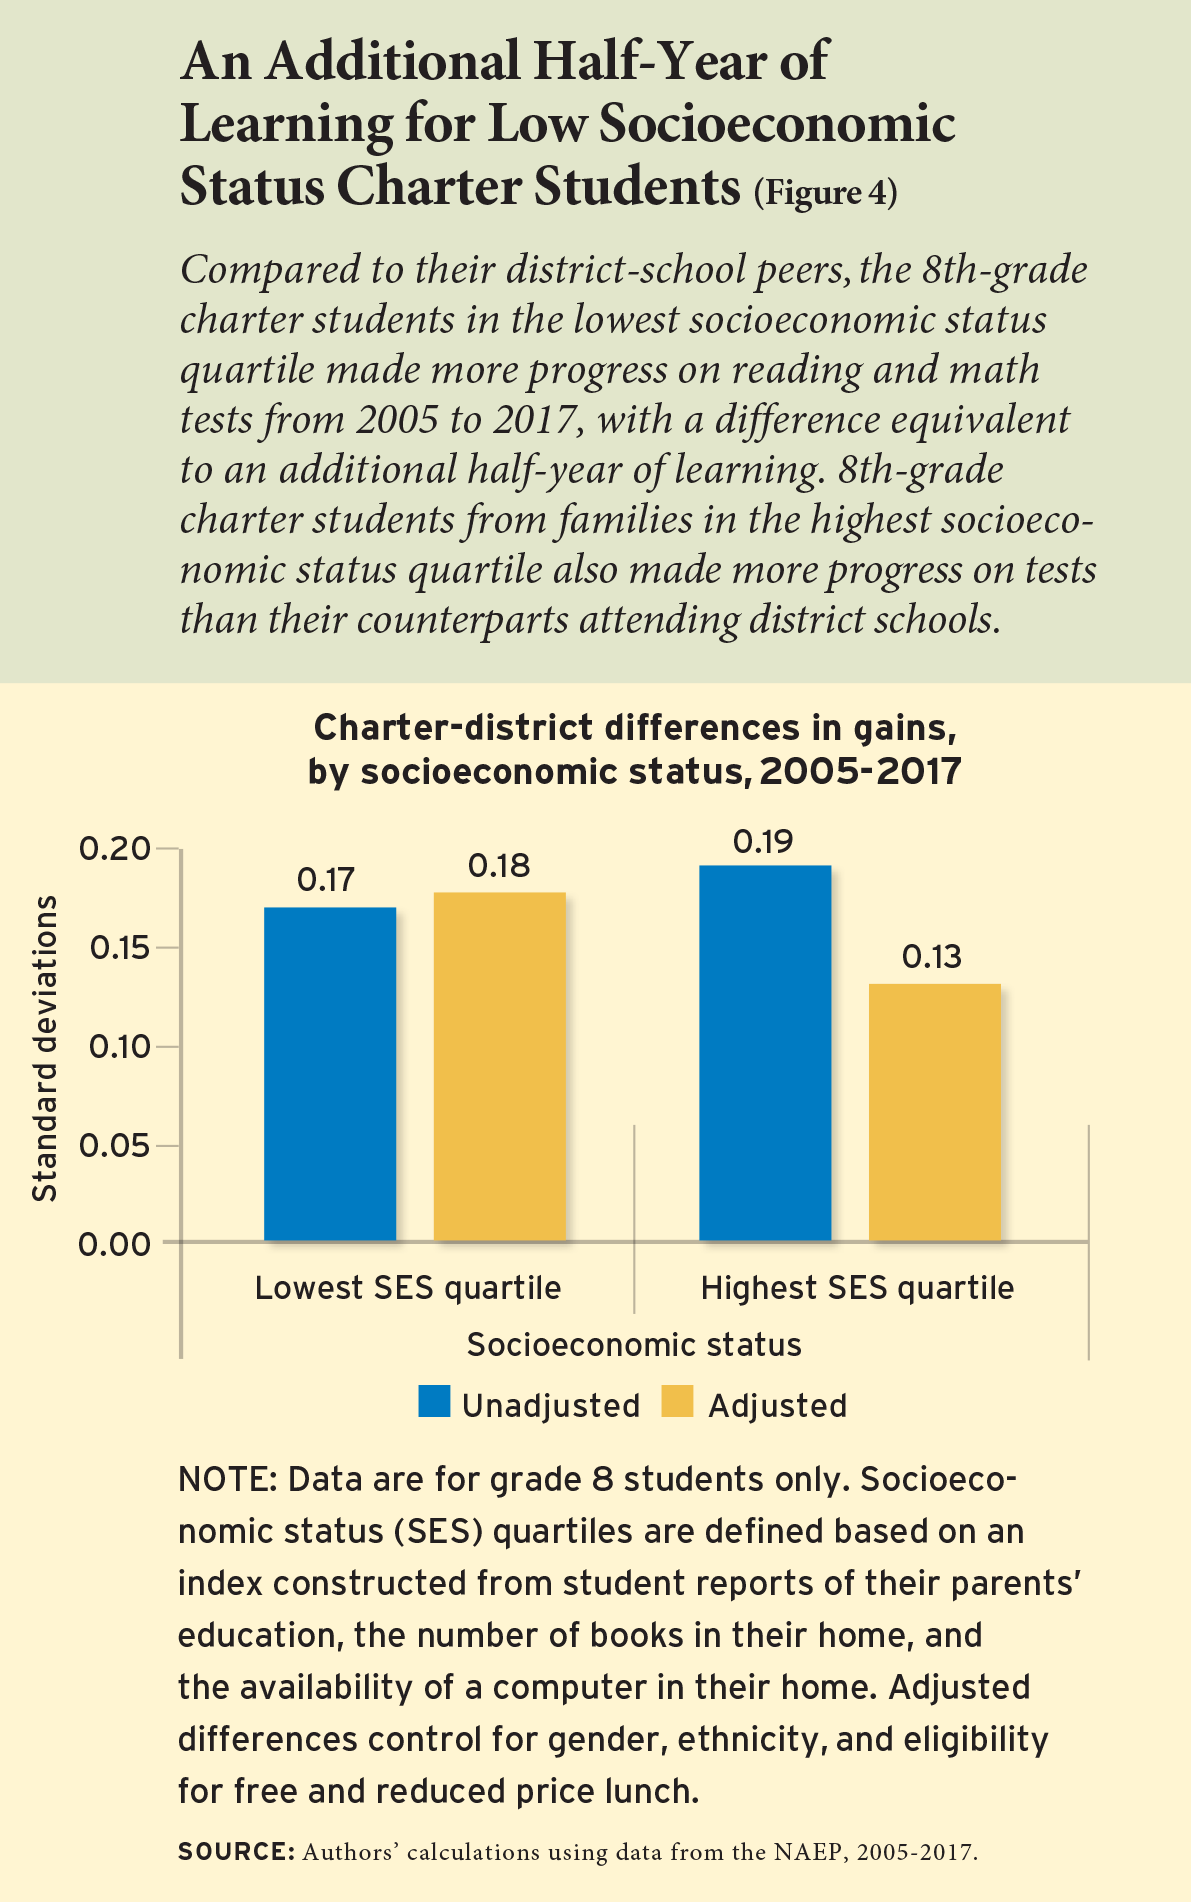
After controlling for other background characteristics, the increments become slightly larger—0.04 and 0.13 standard deviations, respectively. At charters, cohorts of students in the highest quartile make even more rapid progress: average math scores improve by 0.27 standard deviations and average reading scores grow by 0.21 standard deviations over the study period. Again, we adjust for students’ background characteristics and find the magnitude of the trend at charters appears much the same—0.21 and 0.22 standard deviations, respectively.
Cohorts of students in the lowest socioeconomic quartile who are attending district schools show steeper gains than those in the highest quartile. The average test scores for students in the lowest quartile climb upward by 0.21 standard deviations in math and 0.24 standard deviations in reading. This suggests a modest closing of the socioeconomic achievement gap at district schools.
The group of these lowest-socioeconomic status students attending charter schools makes the most substantial progress of all. At charters, average test scores for students in the lowest quartile improve by 0.48 standard deviations in math and 0.31 standard deviations in reading. These estimates do not materially change when background controls are introduced. When the two subjects are combined, the differential in the trends between the charter and district sectors is 0.17 standard deviations, or approximately a half-year’s worth of learning.
Regional and Community Differences
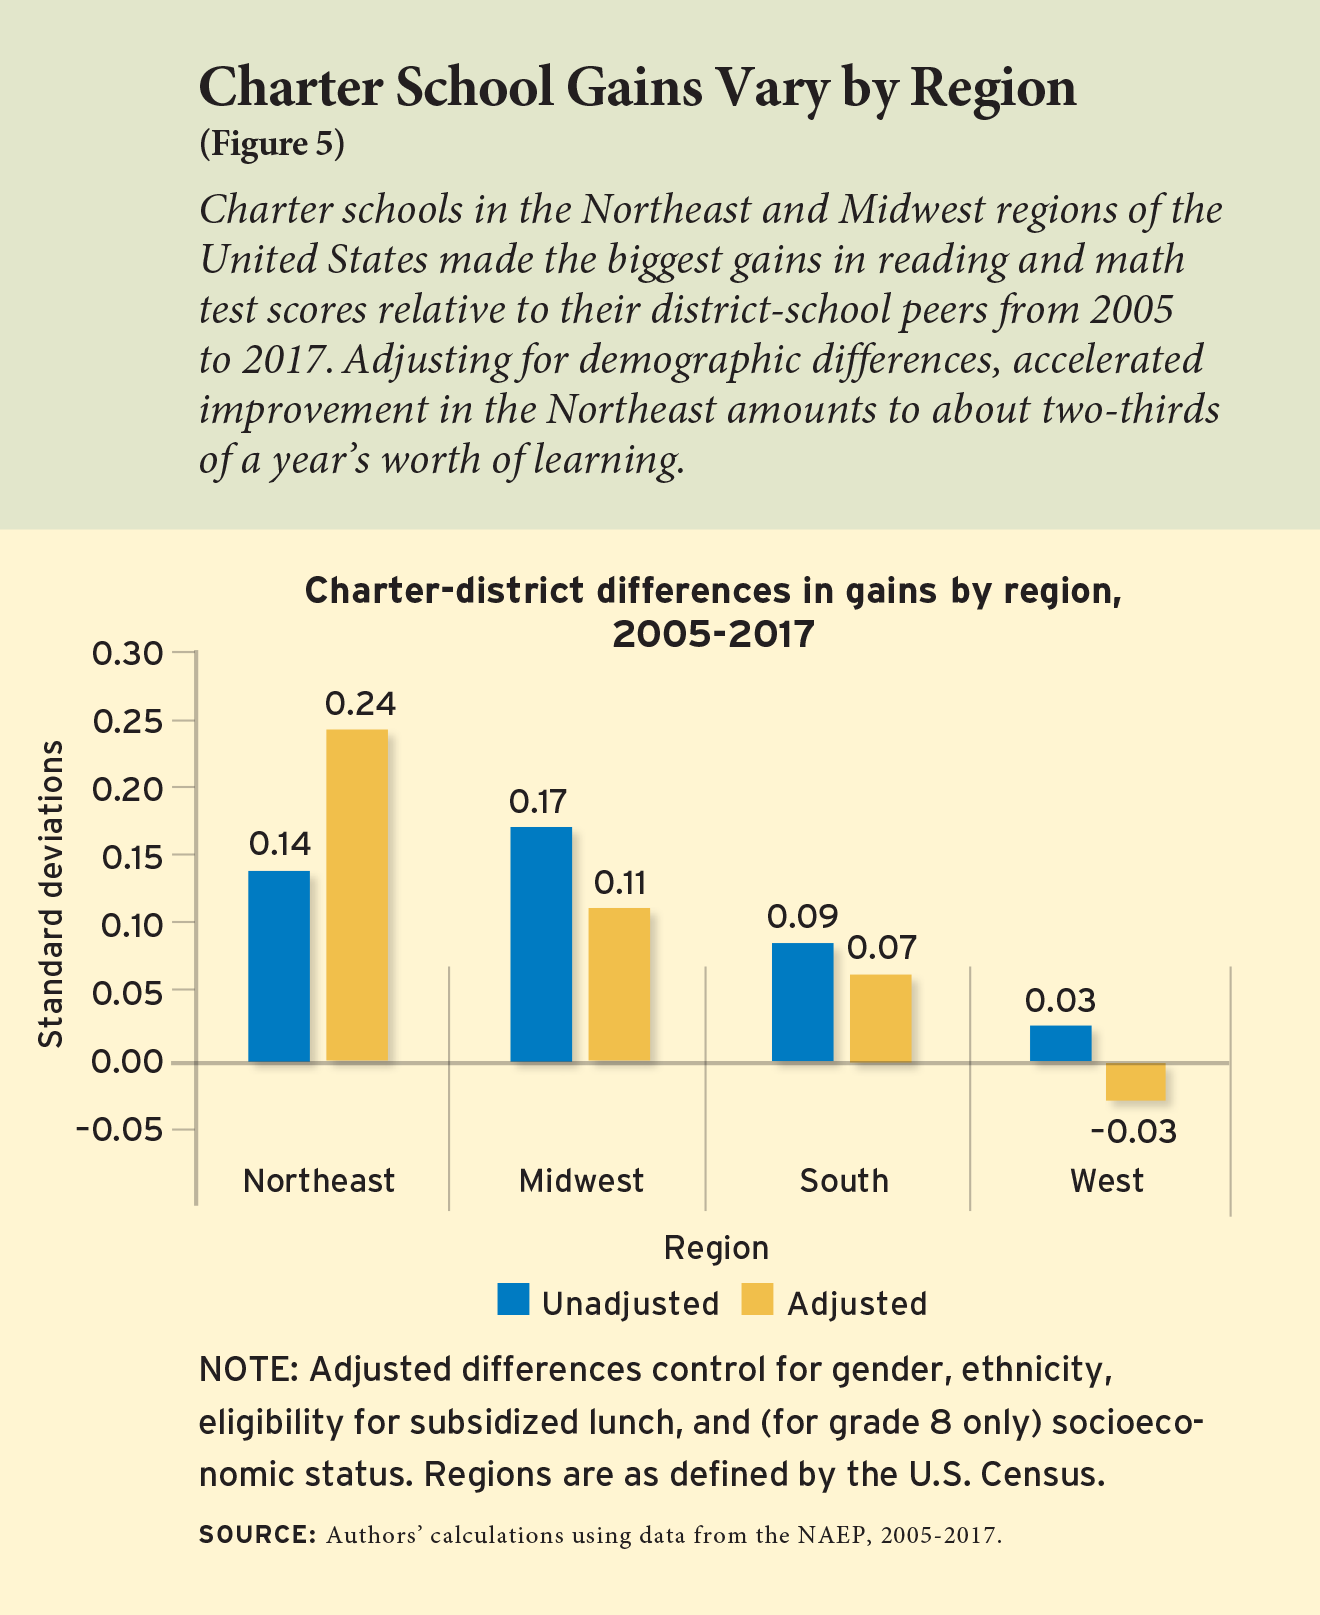
To explore charter trends by region, we follow the model set forth by the U.S. Census and divide the United States into four sections: Northeast, Midwest, South, and West. Our analysis shows greater gains in student learning at charters compared to district schools in three of the four regions.
In the Northeast, we look at combined scores at both grade levels and find that students attending charter schools make more rapid gains than their peers in district schools. Students at district schools improve, on average, by only 0.05 standard deviations compared to 0.19 at charters, a difference of 0.14 standard deviations (see Figure 5). We control for student characteristics and find an even larger difference of 0.24 standard deviations, or about two-thirds of a year of learning. Average scores at charters improve by 0.38 standard deviations, a gain of over a year’s worth of learning, compared to 0.13 standard deviations at district schools.
In the Midwest, we estimate combined average gains at 0.25 standard deviations at charters. This is about 0.17 standard deviations larger than those in the district sector, or about half a year of learning. After adjusting for changes in background characteristics, that gain narrows to 0.11 standard deviations. This suggests that about half of the difference in performance trends is due to changes in student characteristics, and half is independent of such changes.
In the South, after adjusting for student characteristics, average scores at district schools improve by 0.19 standard deviations for the two subjects at both grade levels. At charters, average scores improve by 0.25 standard deviations, a charter-district differential of 0.06 standard deviations.
When statistically adjusted for background characteristics, cohorts of students at district schools in the West show average gains of 0.28 standard deviations in student performance in math and reading at both grade levels, higher than in any other region of the country. When statistical adjustments are made for changing demographics, the average upward trend in the West at charter schools comes to an average of 0.25 standard deviations, just short of those registered in the district sector.
Finally, we also look at differences in student performance between charters and district schools, in both urban and suburban communities. Two-thirds of the charter students who participated in NAEP attend schools located in cities, and we find larger gains for those students. Across all tests and grade levels on average, we find gains of 0.22 standard deviations between 2007 (the earliest year comparable data is available) and 2017, controlling for background characteristics. That is 0.08 standard deviations larger than in district schools and amounts to an additional one-quarter of a year’s worth of learning that cannot be attributed to observable differences in students’ backgrounds. We find no relative advantage for students attending charters in suburbs.
Discussion
This is the first study to use nationally representative data to track changes in student achievement within the charter and district school sectors. Between 2005 and 2017, we find that in the district sector the performance of cohorts of students, once adjustments have been made for demographic characteristics, has trended upward by about a half-year’s worth of learning—a fairly optimistic portrait of trends in American schooling. The trend lines are particularly favorable for Hispanic Americans, Asian Americans, students in the West, and students in the lowest quartile of the socioeconomic distribution. We find less of an upward trend among white Americans, students in the Northeast, and students in the highest quartile of the socioeconomic distribution.
The performance of cohorts of students at charter schools has shifted upward more steeply than the trend at district schools, erasing the substantial gap between the two sectors that had existed in 2005. The average gains by 4th- and 8th-grade charter students are approximately twice as large as those by students in district schools, a difference of a half-year’s worth of learning. The steepest gains at charters, relative to district schools, are for African Americans, students in the Northeast, and those from households in the lowest quartile of the socioeconomic distribution.
About one-third of that gain can be explained by changes in students’ background characteristics, a signal perhaps that charters have become more attractive to broader segments of the population. The other two-thirds, however, cannot be explained by the demographic information gathered by NAEP.
We suspect that improved teaching and learning environments in the charter sector account for most, if not all, of the improvement not explained by background characteristics. Any change driven by intensified recruitment of more proficient students is likely to shift the demographic composition of the sector. If charter schools begin to open in communities with higher average test scores, that change is likely to be detected by changes in students’ socioeconomic status and ethnicity. And if parents of more proficient students are turning to charters in ever-increasing percentages, that change, too, is likely to be correlated with demographic changes. For these reasons, the most likely explanation for the remaining differential trends in student performance that persist after introducing controls for background characteristics are changes in pedagogical instruction and learning environments.
The combination of enhanced performance by charters and their recruitment of a more proficient clientele follows the same course taken by a classic example of disruptive innovation described by Clayton Christensen. Initially, the transistor radio was of such low quality that it was purchased only by those who did not have a viable alternative, primarily young people who wanted to listen to their own music. But as the product improved, its market share broadened to include adults with more resources.
The identification of the beginnings of such a trend within the charter sector is consistent with two other studies that have looked at performance trends in the charter sector: a study of Texas by Patrick Baude, Marcus Casey, Eric Hanushek, Gregory Phelan, and Steven Rivkin; and CREDO’s study of the four-year trend between 2009 and 2013 in 16 states. Both find greater progress relative to district schools, and both attribute the change to replacement of less effective schools with higher-performing ones.
Our findings also resemble some results from studies that estimate charter performance at a single point in time. That research has found that the more effective charter schools are serving disadvantaged students, most notably African-American students in urban areas, mainly located in the Northeast.
Otherwise, prior research on charters has found little difference between their performance and that of district schools, on average. Nothing in our results contradicts those findings. However, we do show that the pace of improvement is greater in the charter sector than in the district sector, and we show that much of the steeper upward trend in student performance at charters cannot be explained by changes in student demographic characteristics.
Given the rising achievement levels at charter schools, the slowdown in the sector’s growth rate cannot be attributed to declining quality. It is more likely that political resistance to charters is increasing as both the management and labor sides of the district sector become increasingly concerned that charters might prove to be as disruptive an innovation as the transistor.
M. Danish Shakeel is a postdoctoral research fellow at the Program on Education Policy and Governance at Harvard University. Paul E. Peterson is the Henry Lee Shattuck Professor of Government and director of the Program on Education Policy and Governance at Harvard University, a senior fellow at the Hoover Institution at Stanford University, and senior editor of Education Next.
This article appeared in the Winter 2021 issue of Education Next. Suggested citation format:
Shakeel, M.D., and Peterson, P.E. (2021). Charter Schools Show Steeper Upward Trend in Student Achievement than District Schools: First nationwide study of trends shows large gains for African Americans at charters. Education Next, 21(1), 40-47.