
NAEP is the only common test of student performance administered across the nation, but states differ widely in the students that they serve. The child poverty rate ranges from 8 percent in New Hampshire to 30 percent in New Mexico. The share of students who are English language learners ranges from 1 percent in West Virginia to 22 percent in California.
This means that each state’s score on the NAEP tells us something about both the students enrolled and the performance of the school system. But policymakers and researchers are often more interested in the latter, which requires making an adjustment for the former.
The NAEP data interactive we created with our colleagues at the Urban Institute does precisely that. Each state’s score can be adjusted for any combination of up to six student demographic factors: age, race/ethnicity, frequency of English spoken at home, special education status, free or reduced-price lunch eligibility, and English language learner status.
This adjustment compares the performance of each state’s students to demographically-similar students around the country. For example, adjusting for English language learner (ELL) status means that each score reflects the performance the state’s ELL students relative to ELL students nationwide. Thus, a state with strong performance by both ELL- and non-ELL students ends up with a higher adjusted score even if it has a disproportionate share of ELL students (who tend to score less well than non-ELL students).
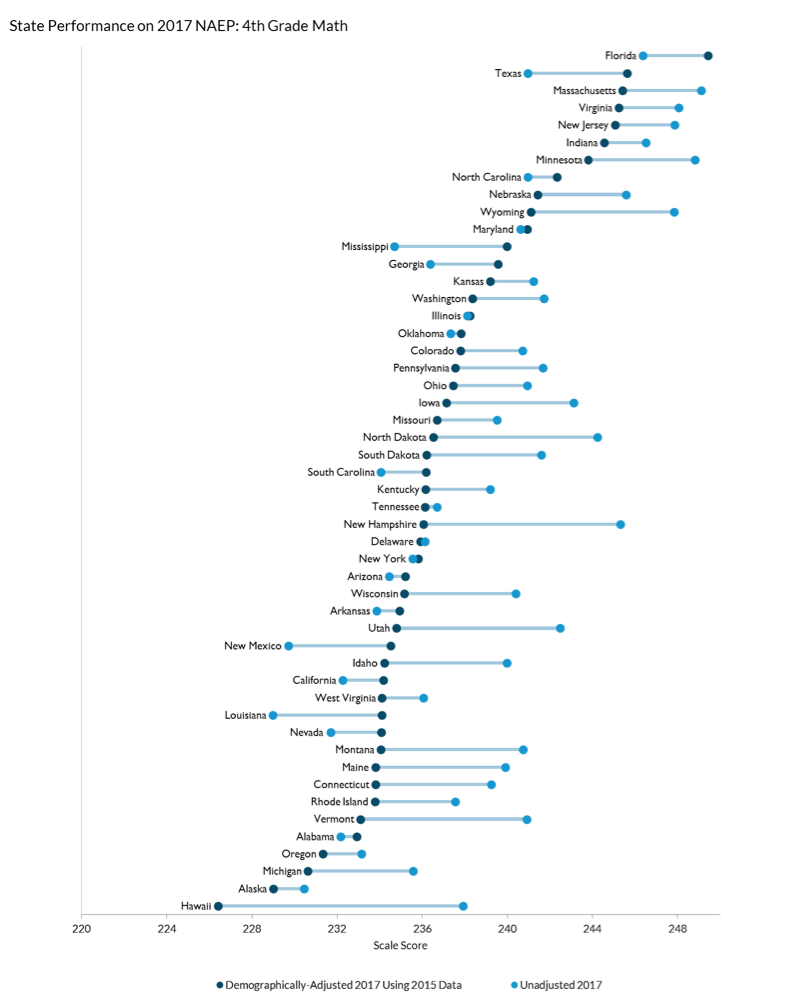
The results for the fourth-grade math test show that the top two states, Florida and Texas, fall behind other states in terms of unadjusted scores but lead the nation in how their students score relative to demographically-similar students around the country. Florida now leads the nation in adjusted performance on both 4th-grade tests, while Massachusetts has held on to its top spot on both 8th-grade tests.
Our adjustment is not perfect. In particular, socioeconomic data based on free- and reduced-price lunch status are weak and getting worse. And while demographically-adjusted data allow for fairer comparisons across states, they still do not reveal why some states perform much better than others.
Despite some drawbacks, demographically-adjusted data provide important insights into differences in state-level school performance, and show that there are substantial differences across states, even after adjusting for demographics.
— Matthew M. Chingos and Kristin Blagg
Matthew M. Chingos is director of the Urban Institute’s Education Policy Program. Kristin Blagg is a research associate in the Income and Benefits Policy Center at the Urban Institute.
This post is part of a series from Education Next analyzing the 2017 results from the National Assessment of Educational Progress. Click here to check out the series, and stay tuned throughout the week of April 10 for more analysis