
Public schools are on a decades-long hiring spree, but little is known about what’s driving this trend. With K–12 enrollment down by about 1.4 million students since the start of Covid-19 and projected to fall by another 2.5 million students by 2032, it’s critical for policymakers to understand why public schools are adding staff to their payrolls as they make decisions about funding, school closures, and efforts to improve stagnant student outcomes.
The following analysis uses federal data to examine why public school budgets have increasingly prioritized non-teaching staff. It starts by examining growth trends by job category, looks at the role of special education, and considers a likely driver of non-special education staff growth: the growing popularity of “whole-child” school models. While it’s difficult to pinpoint the exact causes of school districts’ expanding payrolls, these data show that the phenomenon involves much more than just central office bloat.
What’s behind the rise in public school non-teaching staff?
Nationwide, inflation-adjusted public school funding has grown steadily, rising from $14,969 per student in 2002 to $20,322 per student in 2023, according to Reason Foundation. Much of this increase was spent on hiring new employees, with public school staff increasing by 15.1 percent during this time, even as student enrollment rose by just 4 percent.
The bulk of these new hires were non-teaching staff, a broad category that saw a 22.8 percent increase compared to a 7.6 percent increase in the number of teachers. This trend long predates the Covid-19 pandemic, when federal funding rose to historic levels and gave public schools the financial flexibility to hire and retain staff despite falling enrollment.
There are many factors that may have contributed to the rise in the number of non-teaching staff in public schools. For example, the federal No Child Left Behind Act, signed by President George W. Bush in 2002, included testing, data collection, and reporting requirements that created demand for central office administrators to comply with the law. As they attempt to modernize, public schools have adopted new technologies, requiring additional network administrators, software engineers, and other positions.
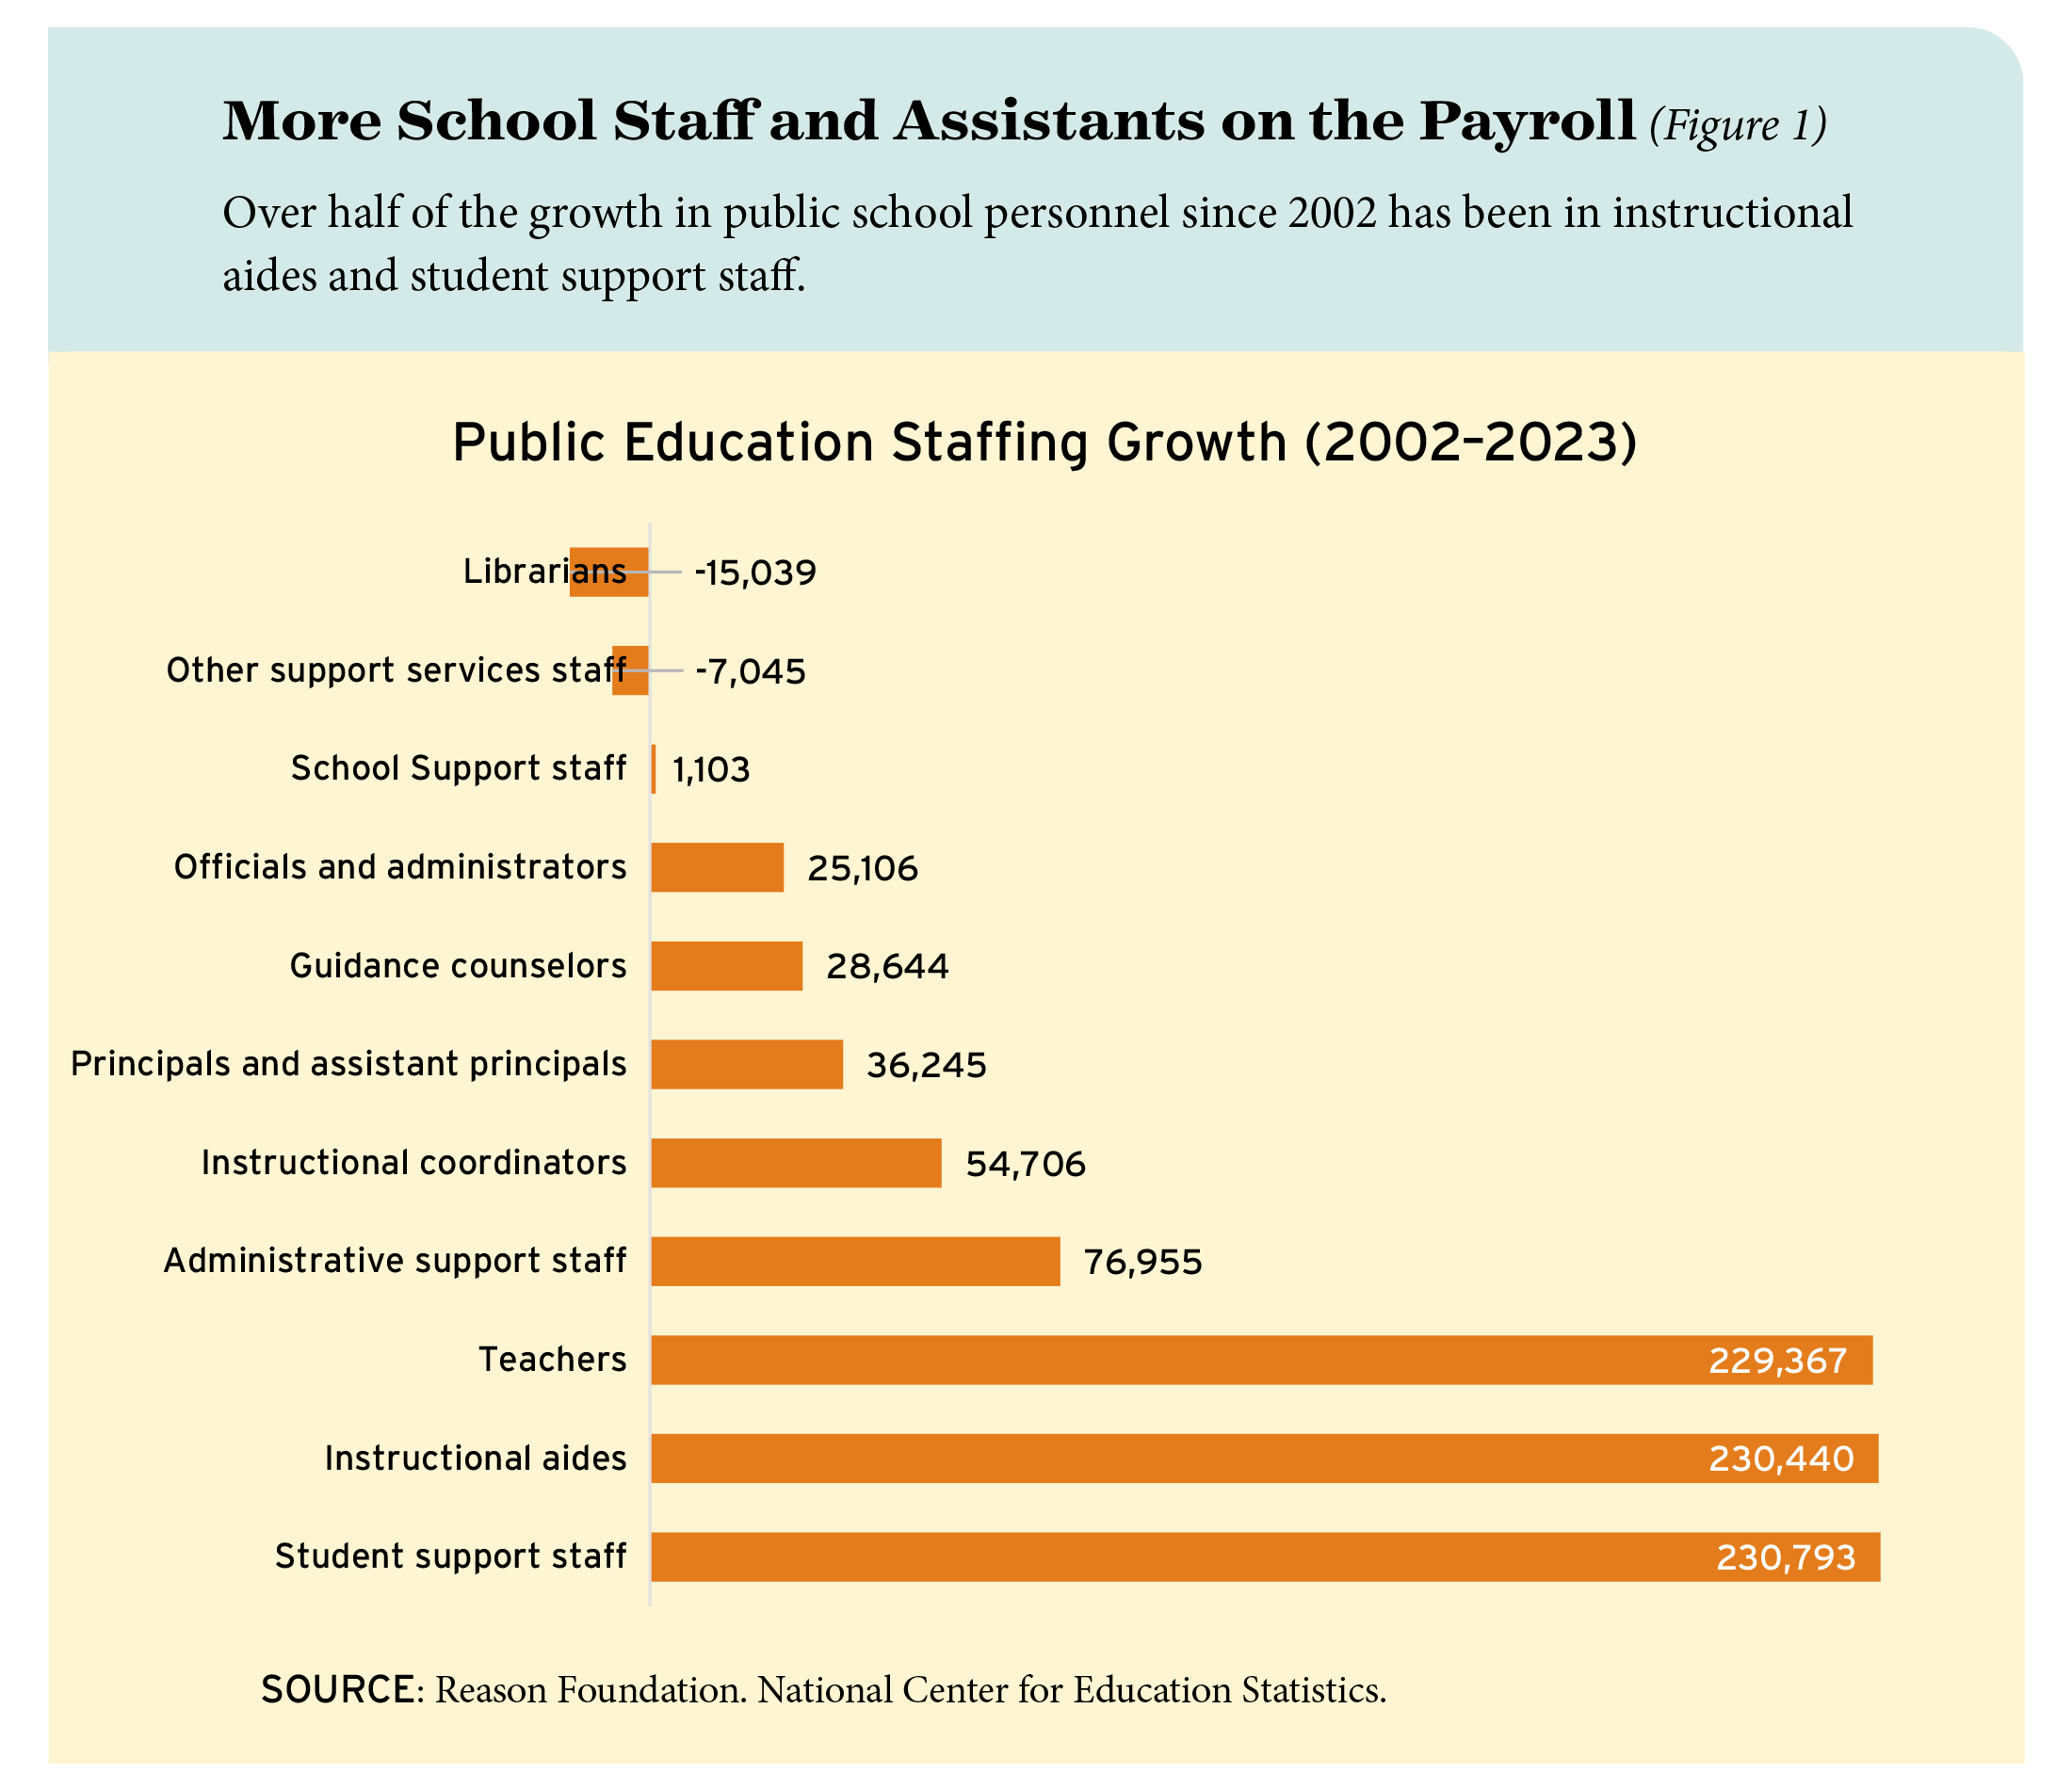
Fortunately, federal data can help identify the key drivers of staffing growth over these two decades. Between 2002 and 2023, increases in two categories—instructional aides and student support staff—stood above the rest, as shown in Figure 1.
Student support staff, which increased by 230,793 employees nationwide, often work directly with students. These positions include psychologists, social workers, attendance officers, and speech pathologists.
Instructional aides, sometimes called teacher assistants or paraprofessionals, increased by 230,440 employees nationally. These educators work under the guidance of teachers, typically assisting with classroom management, supporting students, preparing learning materials, and performing other administrative tasks.
Together, these two categories accounted for 51.7 percent of the total growth in public school staff in the last two decades. In comparison, the three National Center for Education Statistics (NCES) categories that comprise central office staff—administrative support staff, instructional coordinators, and officials and administrators—accounted for 17.6 percent of all growth.
Clearly, there’s more to the rise in public school staffing than administrative bloat. But why are public schools adding more student support staff and instructional aides to their payrolls? Special education, which is often blamed for rising public school costs, is certainly the first place to look.
Assessing the demand for special education services
School districts are required by the federal Individuals with Disabilities Education Act (IDEA) to provide services to students identified under 13 disability categories. Identified students are each given an Individualized Education Plan (IEP), a written document that details the student’s needs, the services they’ll receive, and how progress will be measured. If the number of students with IEPs increases over time, or if the services prescribed by IEPs become more labor intensive, schools would likely need to hire more special education staff.
Federal data show that the special education population has expanded and also suggest that services have become more costly over time.
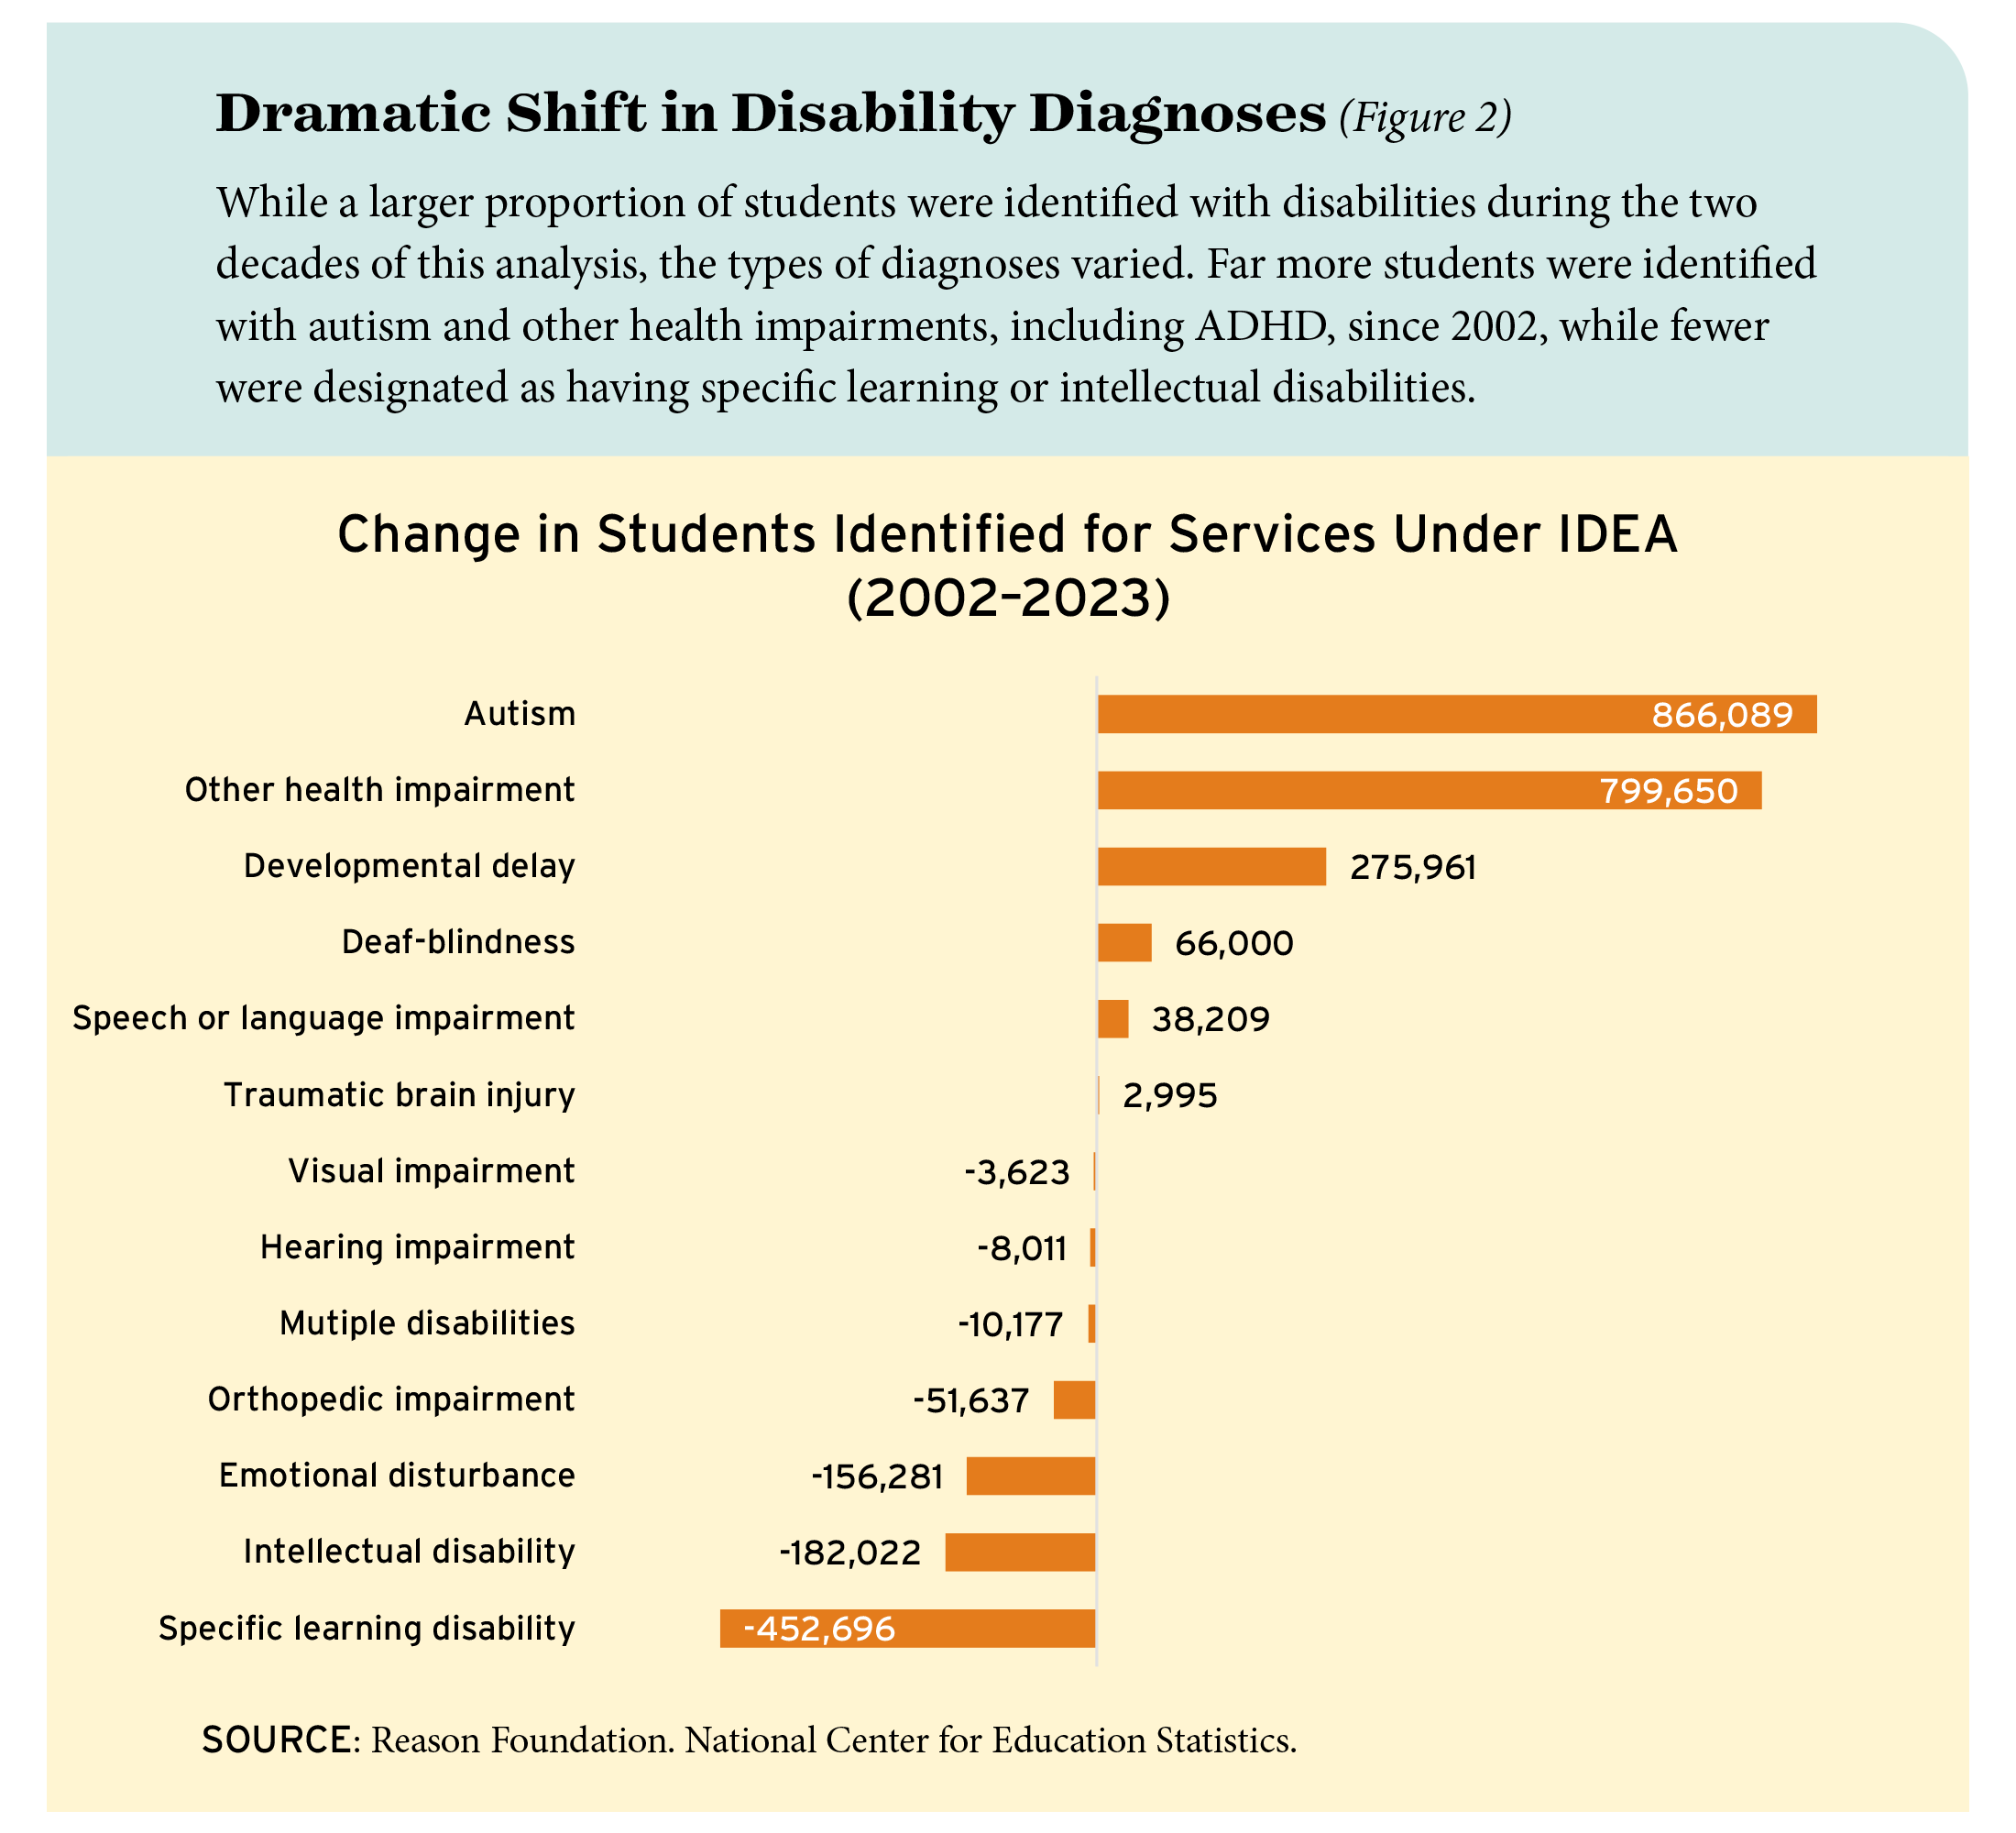
Between 2002 and 2023, the share of students with disabilities in public schools rose from 13.4 percent to 15.2 percent, adding about 1.1 million students with IEPs. There were also notable shifts within the special education population.
Figure 2 shows that the number of students identified with autism increased by 866,089 students—a more than eightfold jump. The number of other health impairment diagnoses, which include attention deficit hyperactivity disorder (ADHD), more than tripled.
At the same time, specific learning disability (SLD), a category that includes conditions like dyslexia and dysgraphia, saw the biggest drop in diagnoses. SLD accounted for nearly 45 percent of special education diagnoses in 2002 but fell to 32 percent by 2023, with 452,696 fewer students receiving services under this label.
Within each disability category, there’s substantial variation in the services and accommodations provided to students, making generalizations difficult. But IEPs for autistic students are typically more resource-intensive than those for students with a specific learning disability, often requiring one-on-one assistance from paraprofessionals and student support staff such as psychologists, speech-language pathologists, and occupational therapists. However, it’s also likely that, as a result of broadening diagnostic criteria, relatively mild cases have largely driven the uptick in autism diagnoses.
Finally, students with disabilities are also spending more time in general education classrooms as school districts have expanded inclusive placements. In 2002, 48 percent of students served under IDEA spent 80 percent or more of their school day in general education classrooms, but this figure rose to 67 percent by 2023. Inclusion could potentially lead to fragmented services that increase costs, especially for high-need students who require in-class supports, such as one-to-one paraprofessionals.
A closer look at federal special education data
Data published by the federal Office of Special Education Programs (OSEP), which have been available in their current form since 2007, show that special education staffing levels have indeed increased over time.
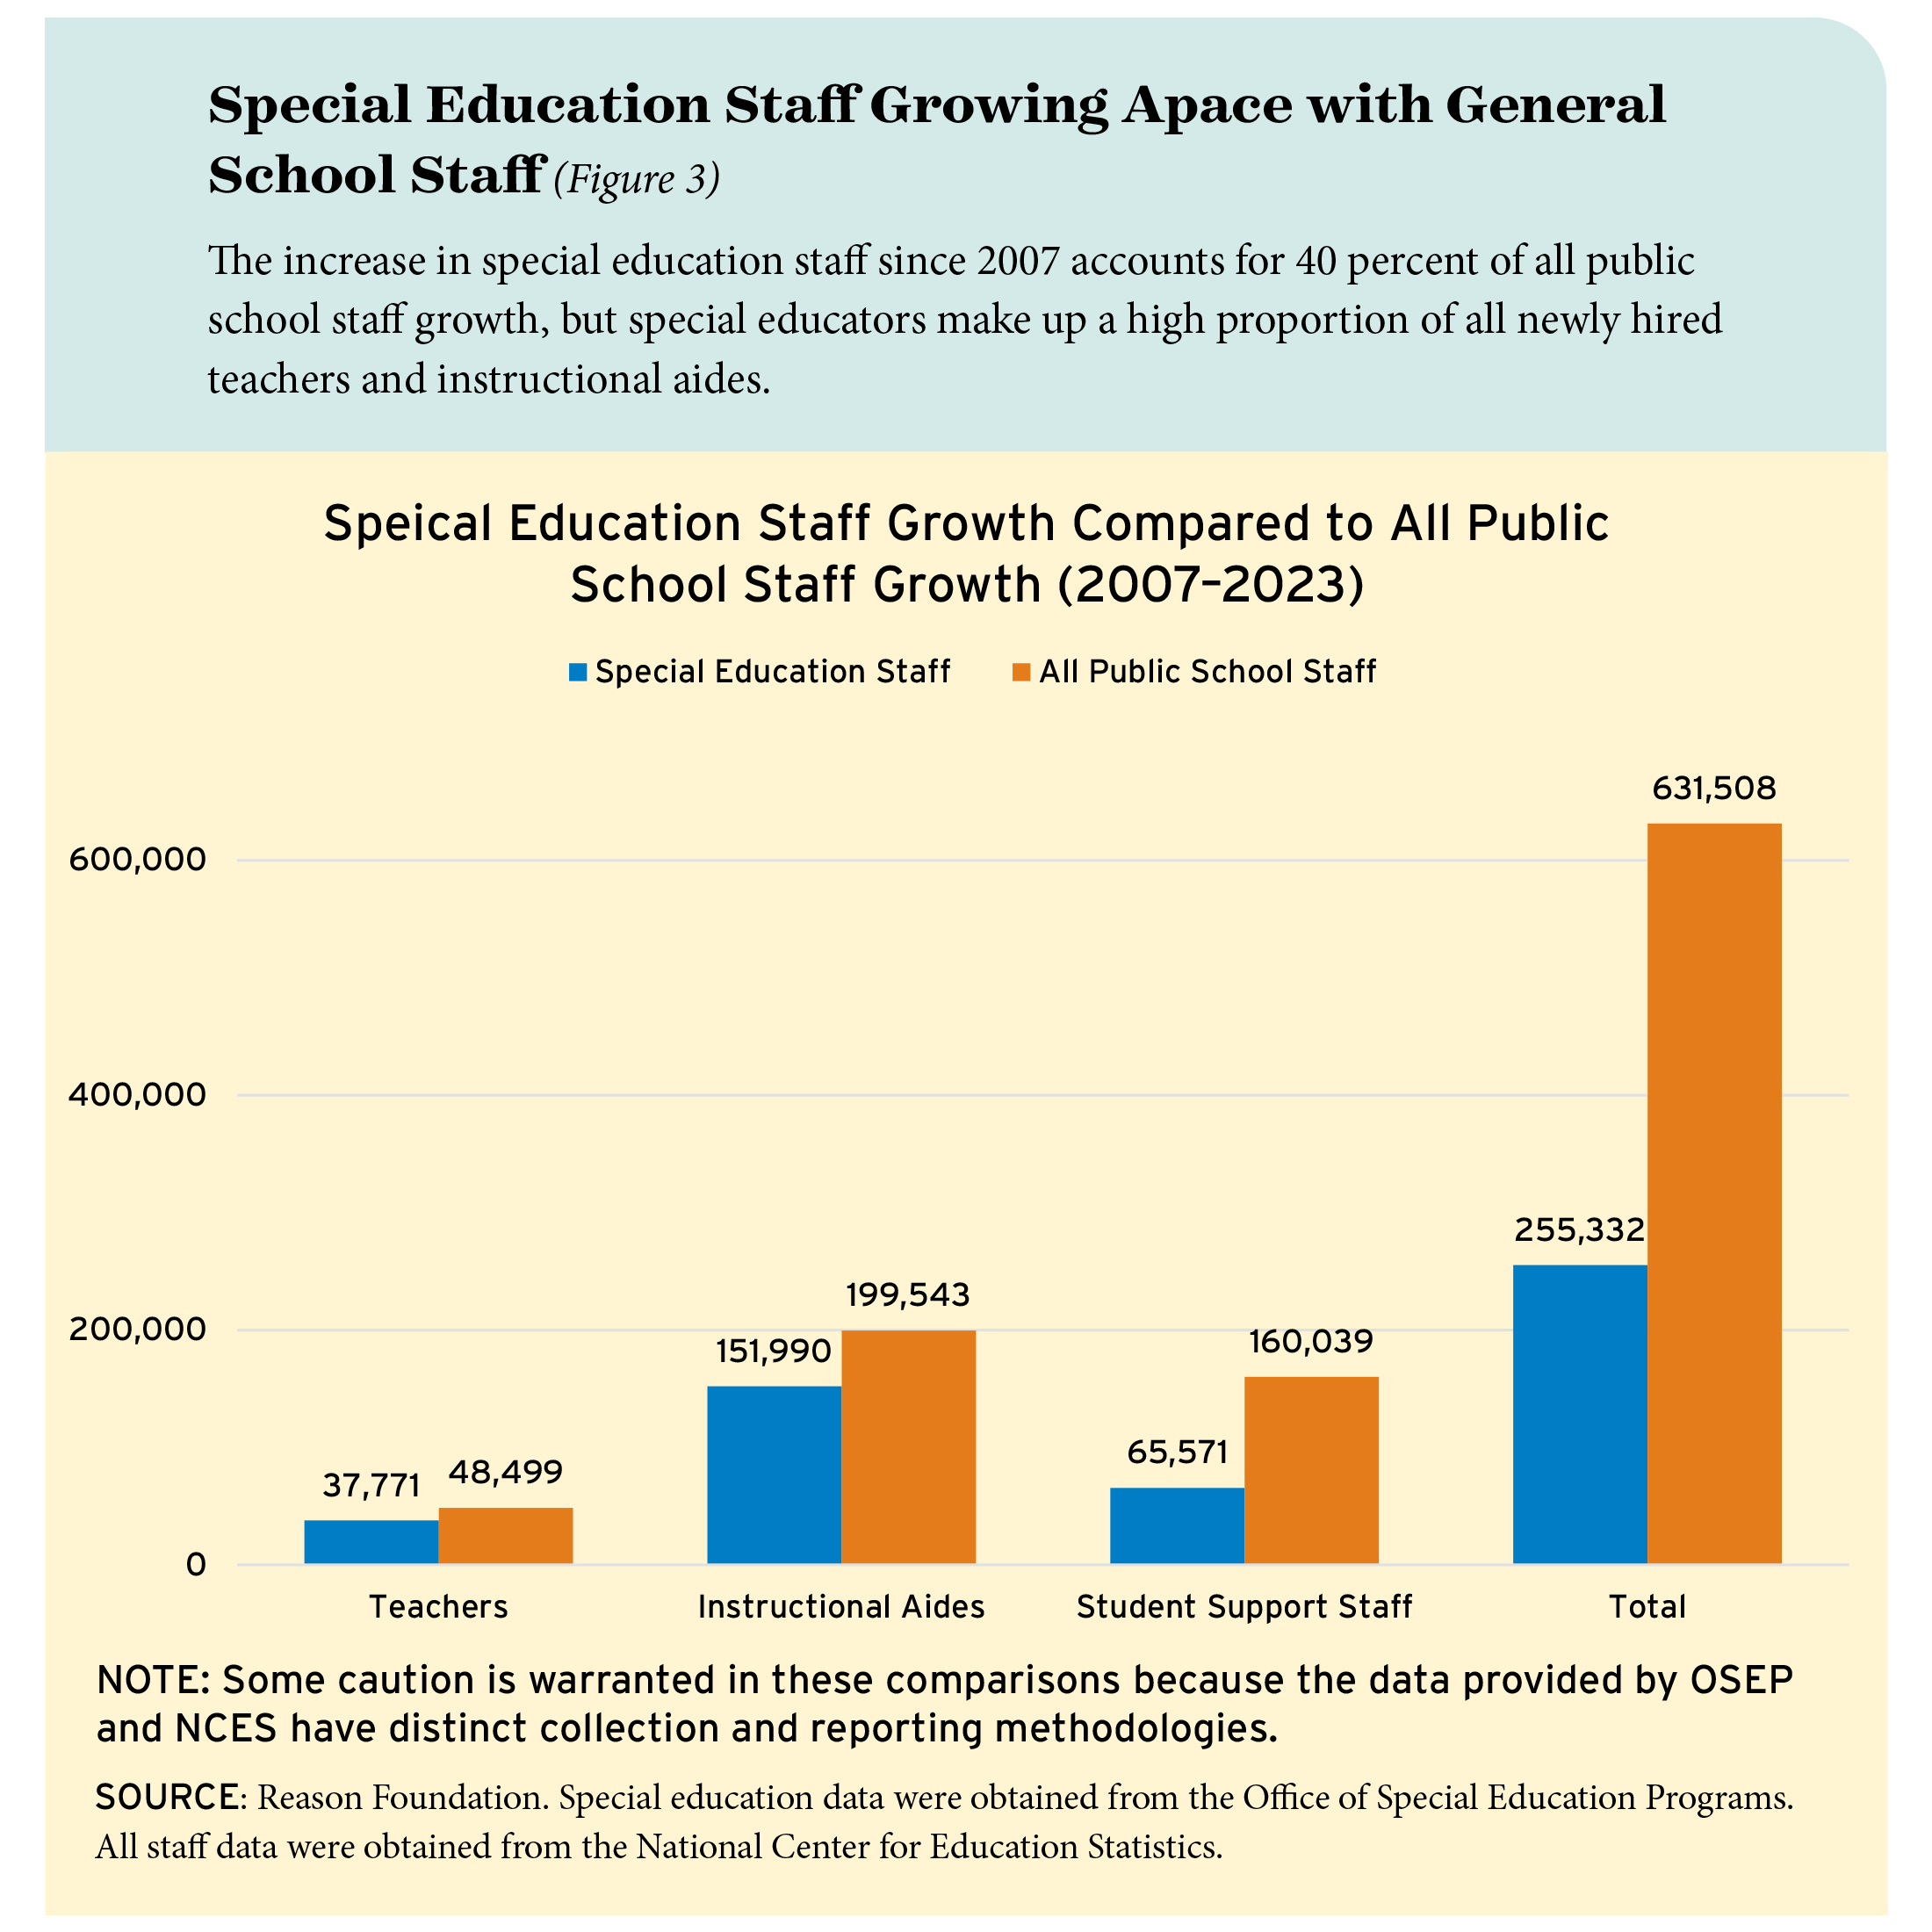
Figure 3 compares special education staffing growth reported by OSEP with NCES data for all public school staff. Between 2007 and 2023, the number of special education staff increased by 255,332, accounting for an estimated 40.4 percent of all new staff added to public school payrolls. Much of this growth was from instructional aides, which increased by 151,990.
While special education staff accounted for large estimated shares of teacher growth (77.8 percent) and instructional aide growth (76.2 percent), they made up a smaller estimated share of student support staff growth (41 percent).
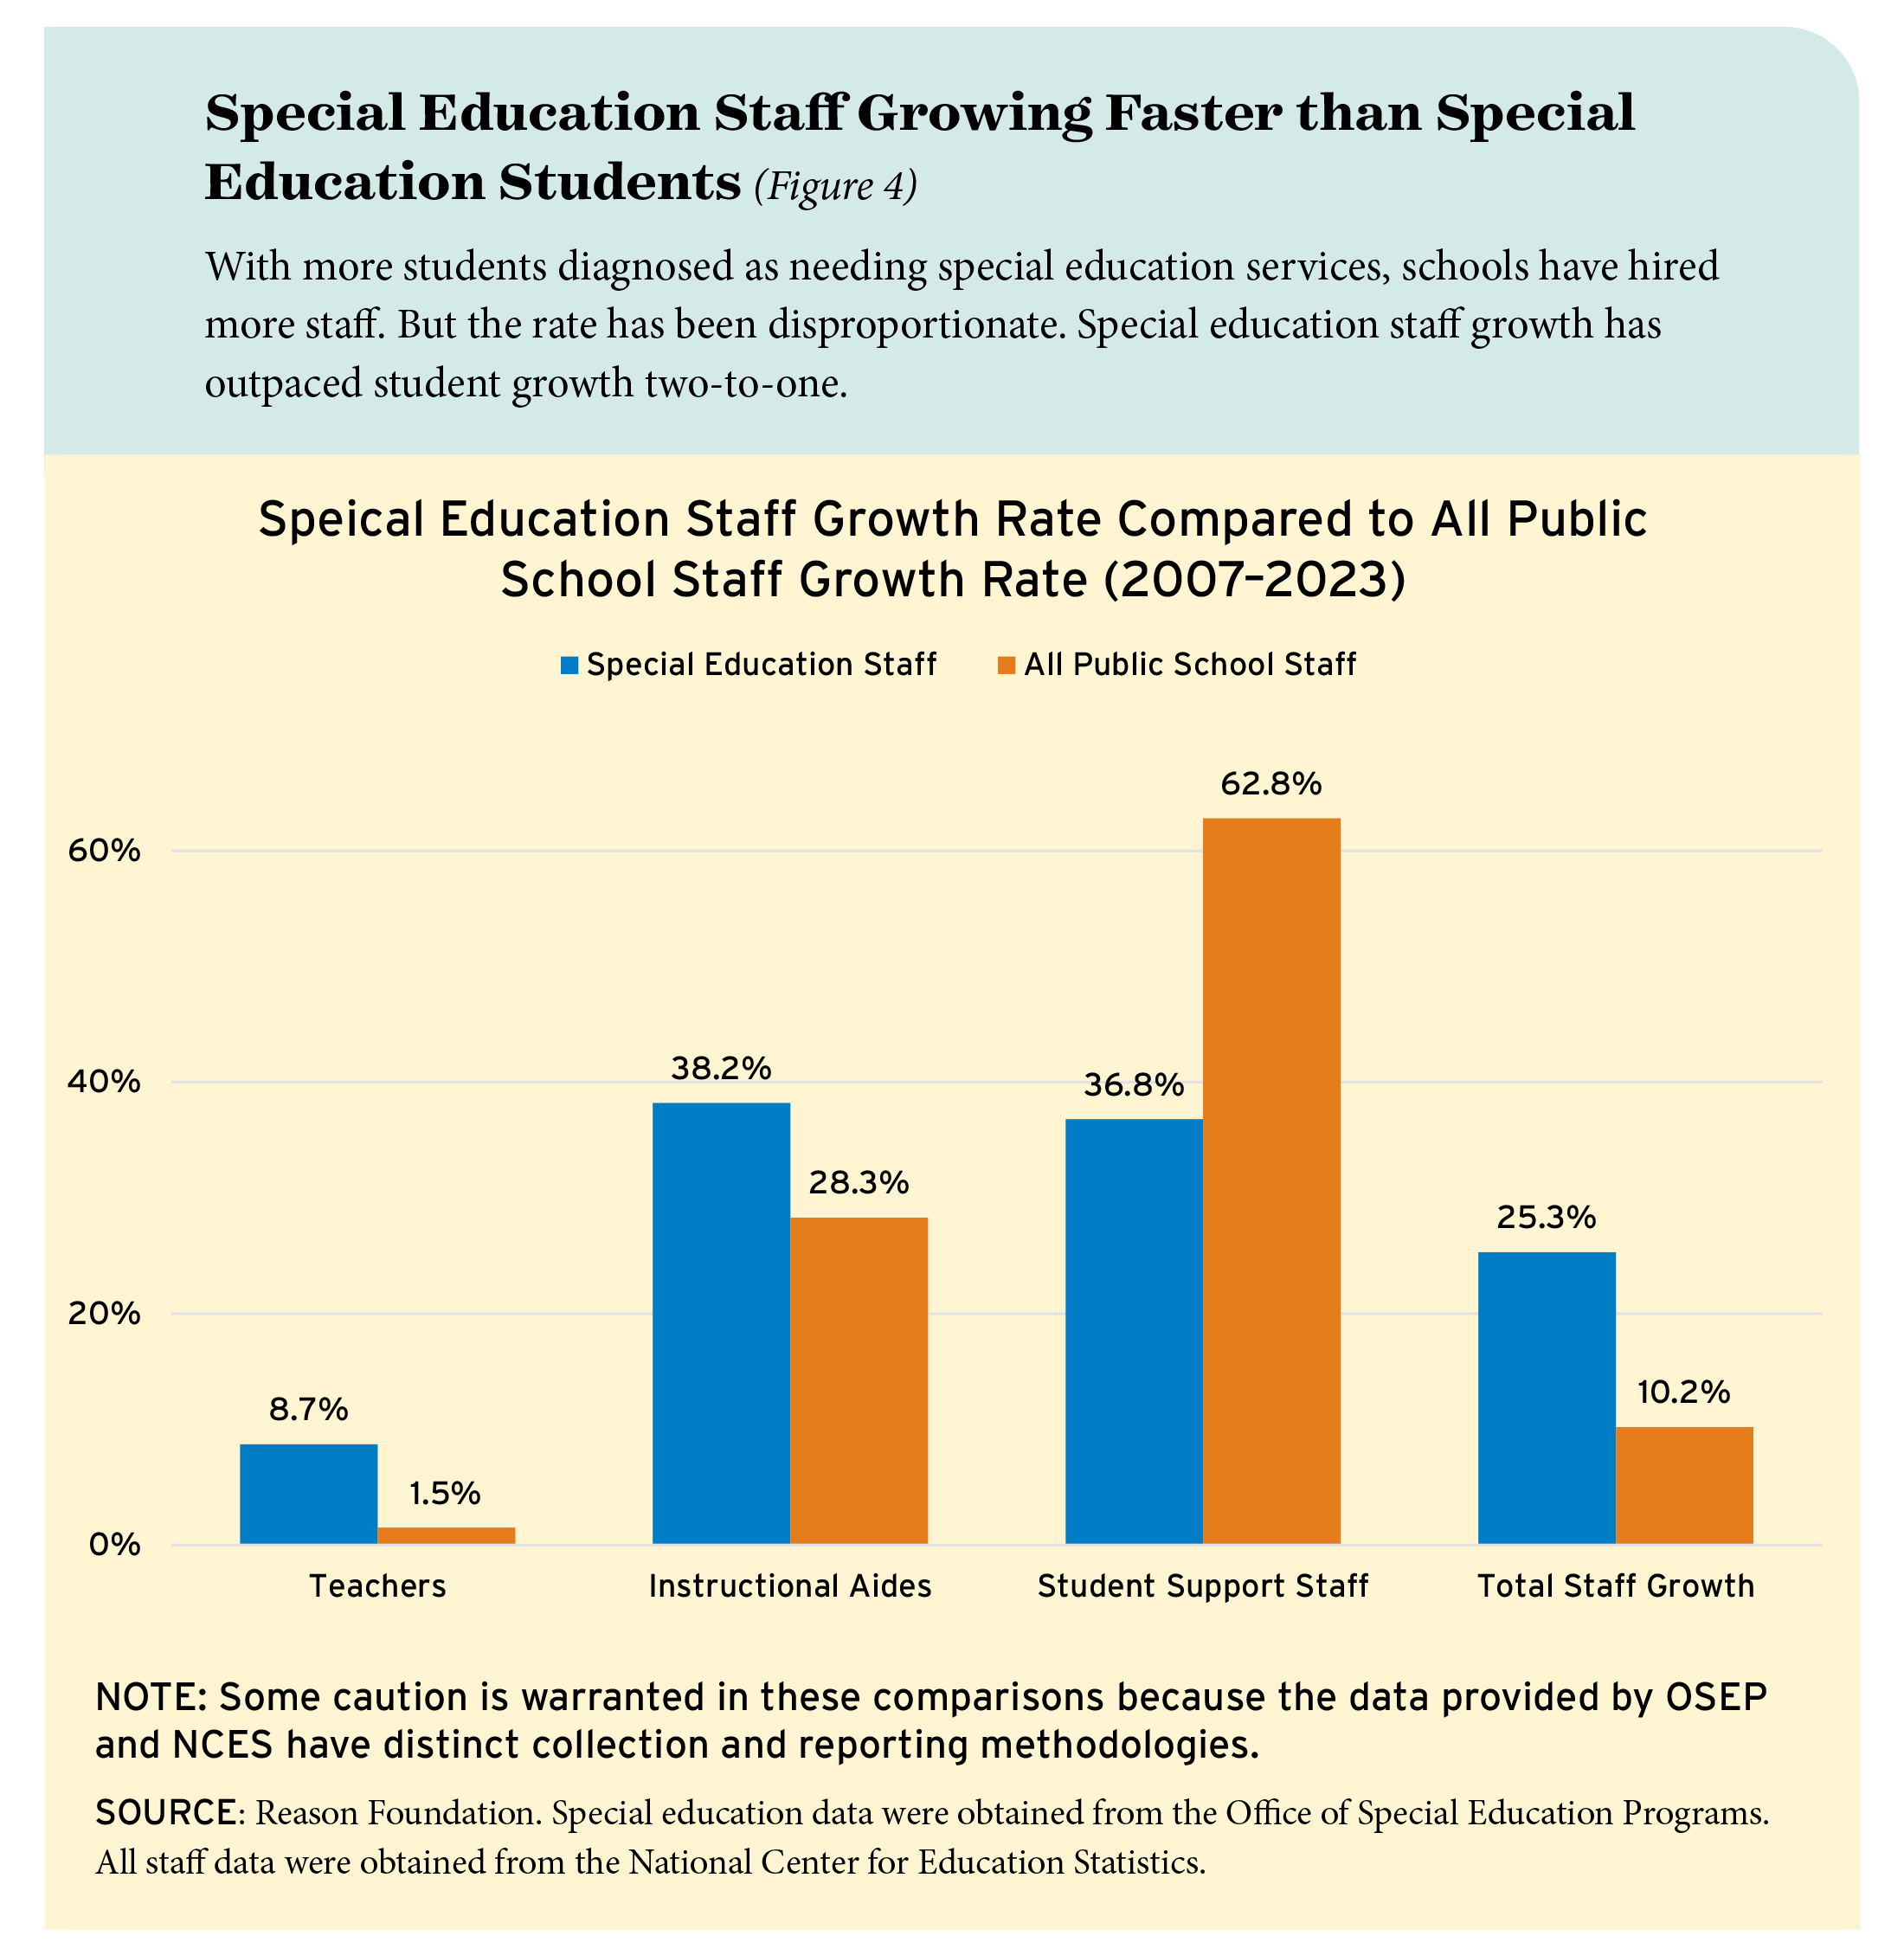
Figure 4 puts this further into perspective, showing the growth rates of special education staff and all public school staff between 2007 and 2023. Overall, special education staff grew nearly 2.5 times as fast as all public school staff.
Special education staff increased by 25.3 percent, outpacing the 12.6 percent increase in the number of students served under IDEA during this period. In comparison, the total change in all staff (10.2 percent) was lower, but far outpaced overall enrollment growth (0.6 percent). Especially striking is the increase in total public school student support staff, suggesting that public schools have invested heavily in these positions for non-special education students.
Some caution is warranted in these comparisons because the data provided by OSEP and NCES differ in key ways. For instance, student support staff data published by NCES includes supervisors and administrators, whereas OSEP no longer reports this as a separate category. Additionally, OSEP data also include contracted personnel, which could inflate special education counts relative to NCES all-staff data, especially for student support staff roles. However, it should be safe to conclude that special education has played a large role in the overall growth of instructional aides and teachers, and a smaller yet substantial role in the growth of student support staff.
What’s driving the rise in student support staff?
It is also clear that special education isn’t the entire story of staffing growth. While there isn’t a single cause, one important driver of increased student support staff may be the emergence of the “whole-child” model of K–12 education. Whole-child education is built on the theory that students can’t learn unless their mental health, medical, housing, and other needs are first met. To accomplish this, public schools have increasingly invested resources in community schools, social-emotional learning, school-based health centers, wraparound services, and other initiatives.
“Instead of viewing schools as places focused on reading, writing, math, and other academic subjects, these models also prioritize children’s physical, mental, and emotional health, community engagement, and social environment,” says Maria D. Fitzpatrick, a Cornell University economist who has studied this approach.
Whole-child models are diverse, vary in implementation details, and sometimes leverage external resources or funding sources that offset costs for school districts. But these expanded responsibilities often require new investments in student support staff.
EdNext in your inbox
Sign up for the EdNext Weekly newsletter, and stay up to date with the Daily Digest, delivered straight to your inbox.
For instance, state legislatures across the country are working to establish community schools, with dozens of bills filed in states like Arizona, New York, Texas, Hawaii, and Washington. Community schools are one-stop shops for kids and often for adults to receive education, medical care, mental health counseling, housing support, and other social services. Nationwide, it’s estimated that there are between 8,000 and 10,000 community schools, or about 6 to 8 percent of all public schools today.
California is at the forefront of this shift, allocating more than $4 billion to support thousands of community schools in mostly low-income neighborhoods. The California Community Schools Partnership Program (CCSPP), adopted by the state’s legislature in 2021, is designed to “accelerate efforts across the state to reimagine schools in ways that are aligned with the equity goals that support the hopes, dreams, and aspirations of California’s families.”
The community school funding, which can be used to provide a wide range of services, is primarily used to pay employees such as social workers, counselors, coordinators, and after-school staff.
Suffice it to say that whole-child strategies can require large investments in student support staff. These services are becoming an integral part of labor negotiations, on par with teacher pay. In its recent contract dispute with Los Angeles Unified, for example, United Teachers Los Angeles demanded—and received—hundreds of new student support staff positions, despite declining student enrollment, looming layoffs, and the district’s projected $1.5 billion budget deficit for 2027.
Putting it all together
Special education has played a consequential role in the growth of public school staff in the past two decades.
This reality raises important questions like what’s behind the surge in autism and ADHD diagnoses, the effects of inclusive policies, whether scarce resources are effectively targeted to severely disabled students, whether special education costs are crowding out dollars for other students, and what special education improvements are needed. Special education is K–12’s third rail, but it’s widely acknowledged that substantive reforms are past due.
It’s also clear that many public schools have taken on responsibilities well outside their core academic mission, which involves tradeoffs and opportunity costs. Dollars used to hire additional counselors, social workers, and other support staff can’t be used to boost pay for effective teachers or those in shortage areas like math and science. Similarly, time spent on social-emotional learning curricula or implementing community school models can take the focus away from core academic subjects.
While some studies show benefits from whole-child strategies, the research is far from conclusive and doesn’t warrant the substantial investments made in the last couple of decades. “To date, there is some promising evidence from a few programs in a few settings, but there is not enough to support any of these models’ ability to improve children’s educational outcomes at scale,” says Cornell’s Fitzpatrick.
With public school enrollment plummeting and expected to continue falling, budgets tightening, and public schools in the throes of a learning recession, policymakers must find ways to make K–12 dollars more productive for students. A good place to start is to ensure that public education’s largest budget line item, staff compensation, is spent in ways that support its core academic mission and improve student outcomes. Available data suggest opportunities abound to do this.
Aaron Smith is the director of education policy at Reason Foundation.