When I invented the annual Challenge Index rankings of American high schools 23 years ago, I considered them just a stunt to publicize a book I had written.
My book, about why the most admired schools made so few demands on average and below average students, went nowhere. But the rankings, to my surprise, were a hit. Newsweek magazine published them in 1998, 2000 and 2003, then in 2005 made them an annual feature, with page views one year hitting the 20 million mark. In 2011 I moved the list to the Washington Post, my employer since 1971. In 2019 I shifted it to my own website, jaymathewschallengeindex.com.
From the beginning I loved doing it. I felt like a kid collecting stamps. Every day I would gather more data from more high schools, each interesting in its own way. This gave me an excuse to talk to more teachers, counselors and principals, my favorite people in the world. Their revelations enriched my newspaper work and led to books like my latest, An Optimist’s Guide to American Public Education.
The more numbers I collected from schools, the more I wondered about the deceptive ways we categorized them. I spent the 1980s and 1990s studying two schools: James A. Garfield High School in East Los Angeles and Mamaroneck High School in Mamaroneck, New York. Garfield was disadvantaged. Mamaroneck was affluent. The percentage of students whose families had incomes low enough to qualify for federal lunch subsidies was the defining measure. At Garfield that number was 85 percent. At Mamaroneck it was 15 percent.
Affluent schools such as Mamaroneck almost always had significantly higher scores than disadvantaged schools such as Garfield on the state tests that were coming into vogue. Those results correlated closely with family income. But I had seen at Garfield that many students from low-income families were doing remarkably well on the more difficult college-level Advanced Placement tests. Their teachers were giving them extra time and encouragement to learn the material.
In 1987 I was stunned to discover that Garfield had produced 27 percent of all Mexican-American students in the country who had passed the three-hour-plus AP Calculus AB exam. I also interviewed students who said they failed that AP test but learned more struggling in that class than they would have in the regular math classes some people said were better for them. In two decades of interviews I have found only one student who thought wrestling with AP did her any harm.
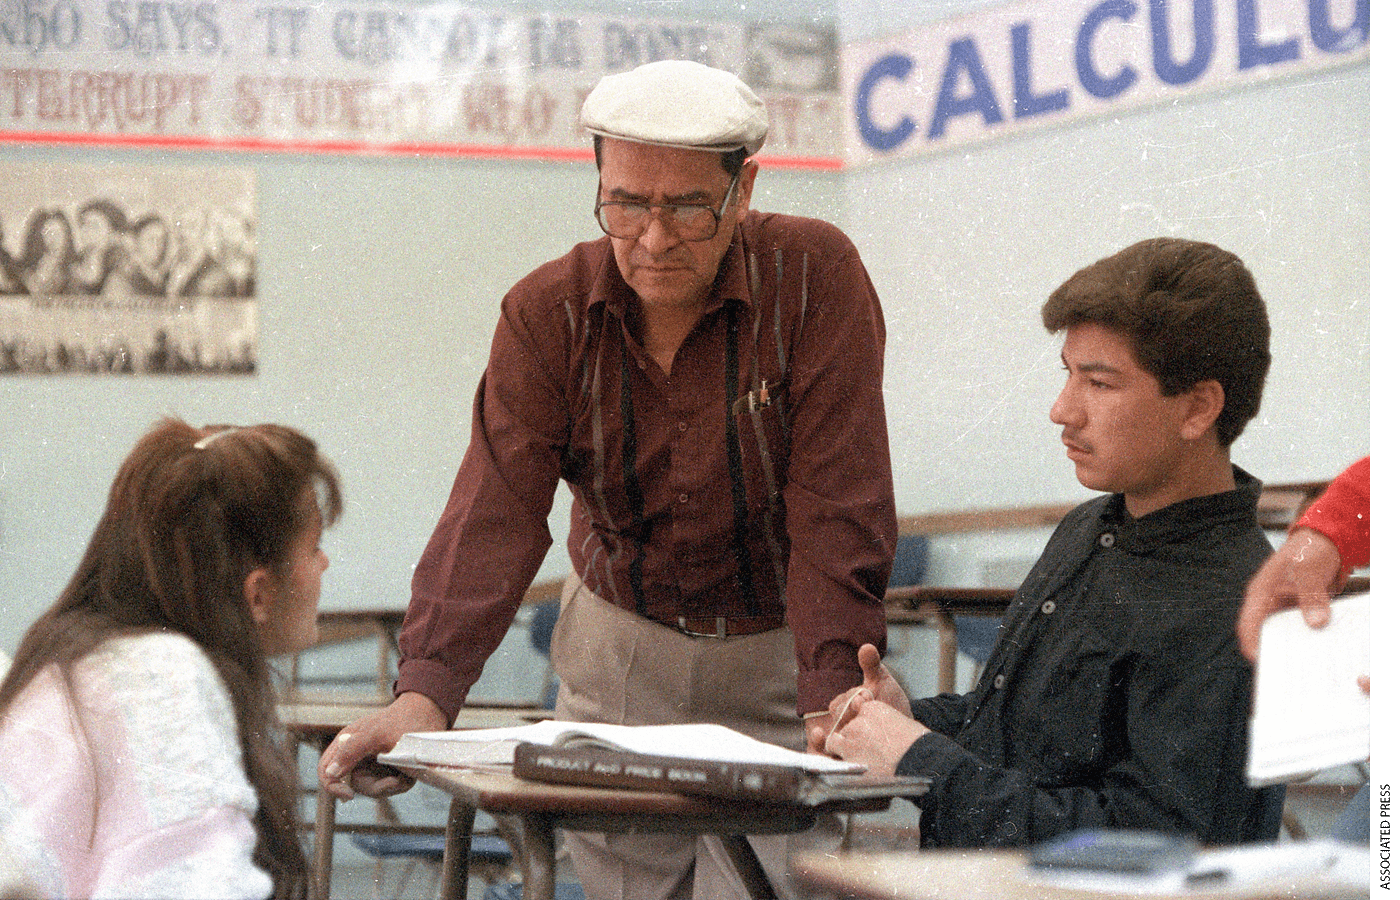
I wanted to rate schools on how hard they worked to introduce more students to deeper learning, rather than judge them by test scores that mostly reflected how much money their parents made. Inner-city teachers who wanted to improve their schools could not import kids from rich neighborhoods, but they could give the students they had the time and confidence to accelerate their studies. In my book about Garfield and its star teacher, Jaime Escalante, I showed that it ranked fourth in the country in the number of AP Calculus exams given in 1987—an amazing total of 129. Garfield gave more calculus tests than several affluent high schools such as New Trier in Winnetka, Illinois, Plano in Plano, Texas, and Scarsdale in Scarsdale, New York, which my son Peter attended in the 1990s.
I used that example to create the Challenge Index. I decided to rank schools by their success exposing students to the most challenging courses and tests. I used a simple ratio: the number of AP tests given to all students at each school in May divided by the number of seniors who graduated in May or June. I later added the tests given by International Baccalaureate and Cambridge International, much smaller programs. Dividing by the number of graduates meant large schools would have little advantage over small schools on the list.
There was no easy way to count precisely how many average or below average students were in AP, IB or Cambridge, but interviews with school officials made clear that higher ratios on the index meant more B and C students were being challenged. Their schools had broken away from the standard practice of not letting those kids into college-level courses for fear the challenge would be too much for them.
Occasionally principals would tell me they didn’t need AP, IB or Cambridge. They said they could make their own courses just as demanding. I determined that rarely happened because their homemade final exams were not written or graded by independent experts outside the school, as AP, IB and Cambridge exams were. If classroom teachers controlled the tests, they tended to be gentle with those nice students they knew. That ruined the principals’ hopes for tough grading and high standards.
I also learned that school attitudes toward challenge varied widely. At Garfield, C students were encouraged to try AP. At Mamaroneck, C students and some B students were barred from taking AP. One Mamaroneck student with poor grades revealed the myopic nature of that rule when she took the AP U.S. History course on her own. She got the textbook, borrowed friends’ homework assignments and passed the AP test.
In my 1998 book Class Struggle, I listed all the schools I could find in the United States that gave at least as many AP tests as they had graduating seniors in 1996. Each school on that first Challenge Index list had a ratio of 1.000 or above. There were only 243 of them, a little more than one percent of all U.S. high schools. Number one was Stanton College Prep in Jacksonville, Florida, with a tests-to-graduates ratio of 4.090. Number 243 was Viewmont High in Bountiful, Utah, with a ratio of 1.002.
| Challenge Index Top 20 Schools 1998 | Challenge Index Top 20 Schools 2020 |
|---|---|
|
|
| Note: All 16 schools not identified as magnets served affluent neighborhoods. The index number represents total number of AP exams divided by number of graduating seniors. | Note: The portion of students from low-income families at the IDEA charters ranges from 75 to 96 percent. The BASIS charters don’t collect family income data but have mostly middle class students. The portion of students from low-income families at the six magnets ranges from 3 (Downingtown) to 61 (MAST at FIU) percent. The Challenge Index excludes any magnets or charters whose average SAT or ACT scores are higher than the highest for any neighborhood high school. The index number represents the total number of college-level AP, IB or Cambridge exams divided by the number of graduating seniors. |
I introduced the list this way: “Nearly every professional educator will tell you that ranking schools is counterproductive, unscientific, hurtful and wrong. Every likely criteria you might use in such an evaluation is going to be narrow and distorted. . . . I accept all those arguments. Yet as a reporter and a parent, I think that in some circumstances a ranking system, no matter how limited, can be useful. . . . Educators who teach AP courses risk being judged by a test they do not control. Students who take the courses have committed themselves to the highest measurable level of American secondary education, and all the effort and worry that entails.”
The most intelligent critique of the Challenge Index I have ever read was published in 2007 by two experienced education analysts, Andrew J. Rotherham and Sara Mead. In their article “Index Challenged,” written for the Washington D.C.-based Education Sector think tank, they said “taking AP and IB tests is one key indicator of a good high school,” but concluded that “the Challenge Index is a seriously flawed measure of overall quality.”
They said “a successful high school should show high levels of student achievement, graduate almost all of its students and not let any demographic subgroup suffer at the expense of others. . . . Yet our analysis shows that many schools on Newsweek’s list do not meet these minimum standards.” Rotherham and Mead suggested Newsweek use “disaggregated data and graduation rates in their rankings, and reward schools that do well with students from diverse backgrounds. As state data systems become more developed, information about course-taking patterns and other measures of college preparation—as well as longitudinal data about performance—could also be included.”
Education Sector published my response alongside the Rotherham-Mead critique. I said assessing schools their way would eliminate one of the Challenge Index’s best features—it was simple enough for readers to understand and calculate the index ratio for their neighborhood school. Rotherham and Mead wanted a complex system of weighted data points, similar to the U.S. News & World Report college rankings and, later, its high school rankings. I pointed out that such rating systems were so complicated that only experts could judge their validity. Rotherham and Mead were fine with that. They were experts. I, on the other hand, was a journalist trying to give as many readers as possible something both they and I could understand. I saw the Challenge Index as friendly to newspaper readers, like the Dow Jones Industrial Average in the business section or the earned run average in the sports section.
My main complaint about the Rotherham/Mead critique was that they were ruling out any recognition of inner-city high schools that had made substantial improvements in the way they prepared students for college. This was especially galling to me because one of the schools they would ban from the list would be Garfield in East Los Angeles, where I had first learned what disadvantaged students could achieve.
“If I knew of any inner city public school with a majority of low-income students that had a significantly lower dropout rate and achievement gap than other schools with similar demographics, I would write about it and then follow your suggestion and look for a way to measure its achievement and rank other schools accordingly,” I said. “But I have not found such a school. . . . When we find a way that inner-city schools can significantly reduce their dropout rates, as Garfield increased its AP participation rate, we have something worth measuring. Until then, you have a measure with no point. Low-income schools will lose your game every time.”
Some critics of the Challenge Index argue that AP, IB and Cambridge courses do not add value to high school curriculums, and thus should not be the basis for assessing school quality. Several studies suggest otherwise.
Nearly all researchers agree that high school students who pass AP exams do better in those subjects in college than students who do not pass or do not take AP tests. A 2008 study by Texas researchers Linda Hargrove, Donn Godin and Barbara Dodd also contradicted the theory that AP students only do better in college because they are naturally better students. The researchers showed that in English, calculus, biology and history, students with low SAT scores who received only a 2 on their AP exams, below the passing mark of 3, did better in those subjects in college than students with low SAT scores who did not take AP.
A key point was that a student must take an AP exam at the end of the course to have an effective AP experience. Requiring the exam made it more likely that both the teacher and the students would take their work seriously. That was why I had the list measure exam participation, not course participation.
Such research has buttressed my reporting on AP and IB, but the most satisfaction for me has come from teachers and students who email me. Chloe Kilzi, a senior at Issaquah (Washington) High School, told me she feels lucky, despite weak grades in science and math, that her school encouraged her to take AP Physics and AP Calculus BC. At her previous school in Chicago she would have needed good grades and teacher recommendations, a common bar to AP participation. She is now studying engineering physics in college.
Darren Johnston, the AP coordinator at Carmel (California) High School, said he and a colleague met with “some pretty fierce resistance” when they moved to eliminate such barriers to AP. But they succeeded, increasing the number of AP students by 50 percent in four years. The school’s passing rate on AP has also improved, he said, “indicating that many students are far more capable than their grades (or even their teachers) might have otherwise believed.”
I found an English teacher in Oregon, Will Robertson, who strongly opposed a plan to require all students take AP courses so that college-conscious parents in neighboring districts would transfer their children to his school, Corbett High. Without that AP lure, the Corbett superintendent thought, the school would be too small to survive and have to bus its students elsewhere.
Robertson said in a memo: “Some students need to practice thinking critically and be exposed to more complex texts gradually. . . . Pause for a moment to reflect on the realities of teaching AP English to 1/3 more students. Now add to that a population that is totally unprepared to do this level work.”
Three years later he confessed he was wrong. He had said “intellectually immature students cannot be forced to grow up.” He discovered instead “by the time the average student arrives in the 11th grade, they are capable of reading and writing about complex materials.” He said “after a week of initial grumbling, students began to accept AP for Everyone as the norm.” His school has become one of the most successful in the state.
In 2012 I added private schools to the Challenge Index. I couldn’t insist on their cooperation as I could with public schools, but many sent me their numbers because they liked the publicity. Independent school associations, however, told their members to shun me because my ratings overlooked subtle qualities that parents could only appreciate during campus visits. I still found data I needed on the websites of private schools that ignored my calls and emails. They had put the numbers there to impress college admission officers and parents. In the process I learned that selective private schools often rank no higher than public schools with a similar mix of students.
Challenge Index 2020 Rankings
Challenge Index 2020 Top 10 Charters
Challenge Index 2020 Top 10 Magnets
Challenge Index 2020 Top 10 Private Schools
Challenge Index 2020 Top 10 Neighborhood Schools
Challenge Index 2020 Top 10 South
Challenge Index 2020 Top 10 West
Challenge Index 2020 Top 10 Midwest
Challenge Index 2020 Top 10 Northeast
The national movement to add more college-level courses to high schools has gotten little publicity. It is led not by the Education Department or blue-ribbon commissions but by individual teachers, such as Will Robertson, who come to realize most students are capable of much more learning than they are asked to do. The list has let me calculate the pace of this change, slow but steady. There were just 243 schools on the 1998 list, one percent of high schools. In 2019 there were 2,543 schools, nearly 12 percent. The nature of schools at the top of the list has shifted. The original top 20 included four magnets and 16 neighborhood schools in affluent neighborhoods. The top 20 in 2020 had six magnets, but the neighborhood schools were lower down, replaced at the top by small charter high schools I knew little about until they started to appear on the list.
The two charter networks that dominated the top of my 2020 list are very different from each other. One is IDEA, started by two 25-year-old teachers in the Rio Grande Valley of Texas. Most of their students are from low-income Mexican-American families. The other network is BASIS, launched by two economists, married to each other, who thought the public schools in Arizona made too few demands on their sixth grade daughter. BASIS students are mostly middle-class.
AP has given an unusual boost to impoverished students trying to get ready for college. With more funding and persuasive research, College Board AP director Trevor Packer and his team increased the percentage of low-income students taking the exams to 22 percent in 2018 from nine percent in 2003, with no decline in passing rates.
These developments had a curious effect on attitudes toward AP in some of our most admired private schools. The vast majority of prep schools brag about their AP and IB courses. But some of the most celebrated have shown disdain for the college-level programs that have become so popular with families who cannot afford tuition of $40,000 a year.
In 2018 seven Washington area private schools—Georgetown Day, Holton-Arms, Landon, National Cathedral, Potomac, St. Albans and Sidwell Friends—announced they were dropping AP courses. That seemed fine to me. A few other private schools had done that. Given the seven schools’ selectivity and faculty strength, the courses they invented to replace AP would not harm their students, who could still take the AP exams.
But the opinion piece the seven school heads wrote for the Washington Post explaining the change included a startlingly false attack on AP. They said: “The truth is that college courses, which demand critical thinking and rigorous analysis, look nothing like AP courses, which stress breadth over depth.”
AP courses have been designed since the beginning by professors to mimic introductory college courses. Students get college credit for good scores. No other high school options, with the possible exception of IB, teach critical thinking and analysis as much as AP does. The exams are longer, more difficult and more carefully graded than most college intro course finals.
Did the private school heads want to send a message to impoverished public school students working hard on AP that they were wasting their time? The educators wouldn’t say. I asked each of them to explain. None ever got back to me.
The inner-city AP teachers I know shrugged the statement off as upper-crust cluelessness. They realize how good and popular their courses are. From 2009 to 2019 the number of AP students increased to 2.8 million from 1.7 million. The number of AP schools went to 22,678 from 17,374.
There will be no Challenge Index list this year because the 2020 data I would have used was ruined by the pandemic. IB and Cambridge did not give exams last year. AP had to limit its tests to just 45 minutes online. This year AP plans full-length tests again, either in schools or at home online.
I’ll be collecting data. I expect more surprises, and more clues to how teachers teach and students learn when challenged by the most difficult courses and tests in high schools today.
Jay Mathews is an education columnist for the Washington Post. His eighth book about schools, just published, is: An Optimist’s Guide to American Public Education.
This article appeared in the Summer 2021 issue of Education Next. Suggested citation format:
Mathews, J. (2021). What I Learned in 23 Years Ranking America’s Most Challenging High Schools: Most students are capable of much more learning than they are asked to do. Education Next, 21(3), 16-23.