 |
| Illustration by John Weber.
|
For more than a century the Department of Education has collected data on the number of high-school diplomas awarded each year. A statistic called the “degree ratio” can readily be calculated by combining these data with population figures from the U.S. Census. The degree ratio is the number of high-school diplomas awarded in a given year divided by the number of individuals aged 17. This gives us an estimate of the annual graduation rate-the percentage of each class of schoolchildren that goes on to graduate from high school.
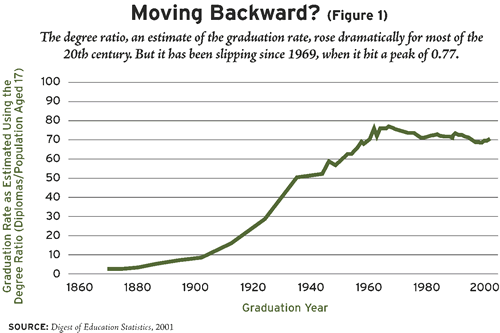
By this measure, high-school graduation rates have soared dramatically since the late 1800s. Between 1870 and 1970, the degree ratio rose from just 0.02, meaning that 2 out of every 100 schoolchildren graduated from high school, to no less than 0.77 (see Figure 1). Indeed, a knowledgeable observer in 1960 might have predicted that the nation would have approached universal high-school graduation by the turn of the century. But 1969 would prove to be the zenith of mortar boards and graduation gowns. After that, the degree ratio began slipping, to 0.74 by 1990, and continuing through the ’90s, dropping to 0.70 in 2000. This was in spite of the National Education Goals Panel’s setting a much-heralded goal of a 90 percent graduation rate for that year.
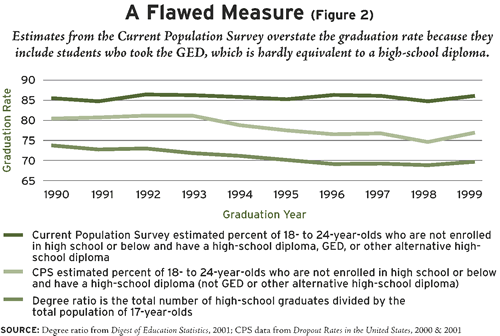
The evidence of a falling graduation rate since 1969 would have become a national scandal by now had it not been disguised by the fact that the degree ratio is not the yardstick of choice. Instead, the National Education Goals Panel chose an alternative measure that confuses more than it clarifies. The alternative way of estimating high-school graduation rates uses the Current Population Survey of some 50,000 households. The head of each of these households is asked whether anyone aged 18 to 24 in the household is a high-school graduate or has received an equivalent degree (the most common equivalent being the General Educational Development, or GED, certificate). By this yardstick, the decline in graduation rates during the 1990s is not so apparent. Numbers from the Current Population Survey indicate that the graduation rate remained essentially constant at 86 percent over the decade (see Figure 2).
The difference lies mainly in the increasing share of students deemed high-school graduates by the Current Population Survey who are in fact taking the GED instead of finishing high school with a regular degree. To earn a GED, students who wish to leave high school early need only pass a test demonstrating that they have attained skills supposedly equivalent to those of a high-school graduate. Remove those students from the ranks of graduates, and the rate from the Current Population Survey falls to 81 percent in 1990. Moreover, as a result of a near doubling in the share of students receiving GEDs, the rate fell even further, to 77 percent, by 1999. Not only has the nation failed to achieve its goal of 90 percent; it appears to be falling further behind.
The GED Illusion
So why not equate receiving a GED with being a high-school graduate? After all, most states consider earning a GED the same as earning a high-school diploma; they often even name the GED credential a “High School Diploma” or “High School Equivalency Certificate.” Of course, the makers of the GED promote this notion. As of August 2001, visitors to the GED website could read: “More than 95 percent of employers in the U.S. consider GED graduates the same as traditional high-school graduates in regard to hiring, salary, and opportunity for advancement.”
However, what employers say and what they do can be two very different things. In a 1993 study aptly titled “The Nonequivalence of High School Equivalents,” Stephen Cameron and James Heckman found that recipients of a regular high-school degree earn approximately 11 percent more than youths with a GED certificate. Likewise, a 1996 study by Richard Murnane, John Willett, and John Tyler found an 18 percent premium accruing to regular high-school graduates vis-á-vis similar students who dropped out in the 11th grade but earned a GED. In short, a load of solid evidence suggests that employers value a high-school diploma that was earned the hard way over a GED. Perhaps they see it as an indication of diligence and determination, attributes that are highly valued in the workplace. As a consequence, the apparent flow from regular degrees to GEDs should be cause for concern.
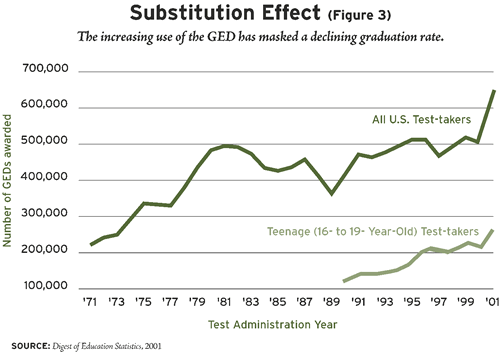
Of course, GED recipients include many older youth and adults who are unlikely to return to high school, even without the GED program. Nevertheless, GED recipients compose a large and growing fraction of all teenagers with high-school credentials. Since 1978 the size of this group has more than doubled, reaching almost 7 percent in 1997. Even 16-year-olds take the GED with increasing frequency. In 1997 there were 10,000 new 16-year-old GED recipients. Meanwhile, the number of states allowing 16-year-olds to take the GED increased from 25 in 1989 to 35 in 1997. Recent evidence suggests that when the rules allowing teenagers to get a GED are relaxed, more teenagers get GEDs and dropout rates increase, though the effects can be mitigated if teenagers are allowed to get a GED only with a parent’s permission. The upshot is that a disturbingly high and growing number of teenagers appear to be substituting the GED for the time and toil required to earn a regular high-school diploma (see Figure 3).
Corruption in the Data
In theory, it is possible to use the Current Population Survey data to calculate high-school graduation rates excluding GED recipients. In practice, however, this doesn’t yield accurate estimates of the graduation rate. The main problem is with the reporting of GED recipients. The Current Population Survey includes a question specifically asking about GEDs, but the person answering the survey is the head of the household-and often not the 18- to 24-year-old person who received the GED. Heads of the household may not know or understand what type of credential the youth in their homes possess. Given that many states and the GED testing service consider a GED equivalent to a high-school degree, it wouldn’t be surprising if many heads of household made the mistake of saying those with GEDs actually completed high school. This intuition is seemingly confirmed by the fact that a substantial number of their responses are inconsistent over time. The graduation rates reported by the Current Population Survey would be particularly misleading if GED recipients were being counted as regular high-school graduates.
To get a sense of how severe this problem might be, let’s compare the number of GED recipients reported by the Current Population Survey with data from the GED testing service. In 1990 the Survey reported only half as many recipients as the GED testing service, suggesting that the Survey’s respondents underreported the number of GED recipients by 50 percent. By 1994, however, the Survey was only underreporting the number of recipients by 14 percent. From 1996 on, the Survey seems actually to have over-reported the number of GED recipients-by 20 percent in 1999. It is not clear why this happened, though it may be a delayed reaction by interviewers to changes in the Survey that were instituted in 1994. In any case, while the number of GEDs reported by the Survey increased by 188 percent from 1990 to 1999, the number reported by the GED testing service increased by less than 21 percent. This suggests that data on graduation rates from the Current Population Survey-the data on which the National Education Goals Panel based its target-are suspect at best.
Of course, one could try to adjust the Survey data for misreporting of GEDs. Unadjusted data from the Current Population Survey show the share of GED recipients rising from 4.9 percent in 1990 to 9.2 percent in 1999. If the GED rates are adjusted for the underreporting of the early ’90s and the overreporting of the late ’90s, the share of GED recipients actually declines from 1990 to 1999. It drops from 9.8 percent to 7.7 percent of all 18- to 24-year-olds. If we also assume that all misclassified GED recipients were counted as having regular high-school degrees, the adjusted graduation rate, excluding GED recipients, actually rises from 1990 to 1999, from 76 percent to 78 percent.
Unfortunately, these adjusted figures can’t be trusted either. First, the underreporting of GEDs in the early ’90s may not have been the result only of respondents’ mistakenly classifying them as high-school graduates; some may have been misclassified as dropouts. In addition, it seems unlikely that the GED rate actually declined given that the total number of GED recipients reported by the GED testing service increased by 20 percent while the population of 18- to 24-year-olds increased by only about 5 percent. Thus, depending on the assumptions, the Current Population Survey can show the graduation rate moving anywhere from down by 6.5 percent to up by 3.2 percent. In other words, the data set used by the National Education Goals Panel cannot provide an accurate measure of whether we’re coming closer to the goal or sliding away from it.
The Degree Ratio
The degree ratio, which is again the total number of high-school graduates in a given year divided by the total population of 17-year-olds, has a number of advantages over the Current Population Survey data as an indicator of graduation rates. First, the Current Population Survey uses only a sample of households, whereas the numerator of the degree ratio can be calculated using data on the full population of high-school graduates, since data on all diplomas awarded are collected by the Department of Education. The Current Population Survey rates are based on a sample of only about 50,000 households, many of which have no teenagers, and thus provide only an estimate of the true graduation rate. Thus, the degree ratio is far more precise. Second, using the degree ratio makes it far less likely that GED recipients will be misclassified as having regular degrees or as being dropouts, since the degree ratios are based on administrative records from schools (public and private) and not on reports from heads of households. Finally, data on degree ratios are available going back to 1870. Current Population Survey data, with information on GED recipients, are available only since 1988.
There are a number of reasons why the degree ratio might differ from the regular high-school graduation rate. First, the degree ratio is based on the number of students getting degrees in a given year, while the regular high-school graduation rate in the Current Population Survey also includes degrees that were earned several years in the past (since the sample includes graduates ranging from 18 to 24 years of age). In this way the degree ratio provides a more timely measure of graduation rates. A drop reported in the degree ratio would not show up in the regular Survey’s degree rate for a number of years.
The degree ratios also suggest a much lower graduation rate than the regular Survey graduation rate without GEDs (see Figure 2). This can occur for a number of reasons, one of which is that the regular Survey graduation rates are based only on 18- to 24-year-olds who are not currently enrolled in high school or below. Presumably many 18- to 24-year-olds who are still in school were held back and end up not graduating from high school. A second reason is that many Survey respondents may exaggerate the educational credentials of children in their household. This is far less likely to occur in the administrative data used for the degree ratio. For both of these reasons, the Survey graduation rate may be misleadingly optimistic.
Nevertheless, the degree ratio does suffer one important disadvantage compared with the Current Population Survey graduation rate. The disadvantage stems from the fact that the numerator and denominator for the degree ratio are based on different populations. In particular, the numerator includes all high-school graduates in a given year, regardless of their age, while the denominator is all 17-year-olds. Since almost half the graduates in any given year have already turned 18, a large fraction of youth in the numerator of the degree ratio (those who receive diplomas) need not be in the denominator (17-year-olds). This means that changes in cohort sizes over time may cause the degree ratio to fluctuate. However, the size of the cohort of 17-year-olds changed by more than 10 percent in a given year only once between 1959 and 2000, and the average annual change was around 3 percent. Thus, roughly speaking, the degree ratio might be expected to change by around 3 percent in a typical year because of fluctuations in cohort sizes. However, since many youth earn their high-school degree at age 17, the degree ratios actually vary little with changes in cohort size.
A second, and related, problem is that immigrants who enter the country after age 17 and subsequently earn a high-school degree will cause the degree ratio to rise. Similarly, emigrants who leave the United States after age 17, but before receiving a high-school degree, will cause the degree ratio to drop. It seems unlikely, however, that the numbers of such immigrants and emigrants are large or that they change greatly over time. So, while it is important to keep the difference between the numerator and denominator of the degree ratio in mind, this should not significantly impair its usefulness as an indicator of progress at the national level.

Falling Graduation Rates
By any measure, graduation rates have clearly stagnated if not fallen, and the degree ratio suggests that the stagnation began as early as 1970. One explanation is that states have made it easier for some teenagers to get GEDs in lieu of regular high-school degrees. The upside of this change is that GEDs may improve outcomes for some youth, especially those trapped in low-quality high schools. It also may make it easier for teachers to teach if it helps to remove more disruptive students from the classroom. Nevertheless, students and their counselors should not operate under the fiction that a GED is equivalent to a high-school degree. On average, failing to earn a high-school degree is a stain on a student’s record that few employers will ignore.
Another explanation for falling graduation rates may be the increasing reliance on high-stakes exit exams to determine whether students can graduate from high school with a standard diploma. Minimum-competency exams like New Jersey’s “High School Proficiency Test” were in use even before the accountability movement matured in the past decade. There is very little reliable research on the relationship between exit exams and dropout rates, but it is reasonable to think that the threat of such exams, and the inability of some students to pass them after numerous tries, may have discouraged a fair number of students from continuing their studies.
Exit exams have clear benefits. They can encourage youth to study harder while in school and serve as an indication that a high-school degree actually holds some meaning. In this way they provide a stronger signal to the labor market that a high-school graduate is worth a premium. Surely graduation rates could be increased by making it easier to obtain a high-school degree, but that would make the degree less significant. Nonetheless, there are very large economic costs associated with dropping out of high school. In this sense, policies that may encourage more dropouts deserve strict scrutiny; they need to yield strong benefits to justify the costs. However, we will not know the costs until the nation makes serious investments in studying the breadth and depth of the dropout problem. Reliance on a bad measure of the graduation rate has masked the deteriorating state of American education and may have made us too accepting of changes in GED and testing policies.
-Duncan Chaplin is senior research methodologist at the Urban Institute.