
In August 2019, Florida’s Collier County school district got a call from a reporter for the Florida Phoenix. Her question: Why was the district spending thousands of dollars more per student on one of its schools than the others? Calls like these can trigger anxiety in district leaders across the country. That’s because new reports about spending data are revealing some unexpected or uncomfortable patterns across schools within the same district. And the calls are likely to keep coming as states continue to release new federally mandated school-by-school spending data.
The federal Every Student Succeeds Act (ESSA) was passed four years ago, and within it was a sleeper provision requiring states to publish annually on their report cards the per-student spending data for every public school in their borders. That provision is finally bearing fruit. As of March 2020, more than half of the nation’s states had released the school-level spending data, with the remaining states expected to follow suit by the June deadline. We’ve explored these emerging data from districts across the country, and as we investigate, one thing has become clear: there is no single story across districts or even types of districts. The patterns vary from place to place.
That inconsistency, itself, is THE story. Districts play a substantial role in determining how much is spent on one school versus another, and those patterns play out differently from one district to the next. Spending patterns tend to emerge from a school system’s unique policy, historical, and political context. Those patterns, if left unchecked, might lead to allocations that appear at odds with the district’s stated strategy of, say, dedicating more resources to schools serving high-needs students.
Before the numbers started to emerge, many had assumed the data would overwhelmingly show a pattern of lower spending on the poorest schools, where limited teacher experience and staff churn resulted in lower salaries. The requirement to release school-level spending data was, in fact, a Plan B for equity advocates who had failed to get a federal mandate for equal spending on Title I schools after unions, district leaders, and Republicans claimed it was overreach. Data transparency became a bipartisan alternative that aligned with conservative support for fiscal responsibility and local decision making.
While we don’t yet have national averages, and the work of finding trends by going district to district is time-consuming, we can clearly say that there are many patterns at play. Some districts do spend less on their poorest schools, where teachers are the least experienced or there are chronic vacancies—but some don’t. Others spend less on some of their poorer schools but not others. Sometimes there are spending inequities that have nothing to do with salaries at all.
More than anything, early exploration of the emerging data has focused attention on the district role in allocating resources to schools—and on the opportunities that districts have to use and act on their data to deploy resources more deliberately and, ultimately, improve outcomes for their students.
Over the coming months, the rapidly changing and tumultuous economic landscape will dominate the dialogue on K–12 education finance. But as states face shrinking revenues and districts anticipate smaller budgets resulting from the coronavirus-related economic downturn, a critical question is whether district leaders will seize the opportunity the data provide to reflect on spending policies. Will they engage and communicate clearly and openly with the communities they serve? Or will they dismiss the data and continue with business as usual?
|
Can we believe the data? Some have been understandably skeptical of the accuracy of the emerging data. How can we get apples-to-apples spending figures when so many districts account for expenses differently? What if one district codes social workers to central department spending, while others see them as school staff? What about district costs for students with disabilities who are served by private providers? Given that there are no federal accounting regulations, should we be worried that we’ll get disparate numbers from 14,000 different districts? ESSA requires that state agencies do the reporting, and this state role has undoubtedly helped ensure some measure of validity across districts within each state. In addition, 45 states participate in a Financial Transparency Working Group, and most of them are planning to meet the school-by-school reporting criteria co-created by the group. For instance, most states are reporting each school site’s expenses and a separate site share of central costs (often a fixed per-student figure) for a grand total. Some states will do the data crunching from existing accounting systems. In cases where states lack common accounting down to the school, state leaders—like those in West Virginia and Wisconsin—have been training their district staff in how to comply. Still, it’s true that data comparisons are unlikely to be without some problems, at least in the first few years. For instance, Colorado’s earliest attempt (which was not prompted by the law) didn’t count all the central district expenditures. Many states are doing validity checks while inviting broader feedback on any potential errors. With continued state agency attention, the data should get better over time. That said, while reports will show how much is spent on behalf of students in each school, they won’t necessarily show how the money was spent. The federal law does not require any breakout by teacher salaries, program, and so on. Some states are opting to report more than required, but for those wanting a national picture of how money is spent inside every school, the data will be unsatisfying.
|
Exploration of Dollars by School Is New, Even for Districts
Using newly published Massachusetts data, our team assembled a bar chart of one district’s spending on each of its elementary schools and presented it to district leaders and school board members. Their first reaction was that, at an average of about $12,000 per student, the figures seemed higher than some expected. In truth, the national average is about $14,000 per student, so this was a lower-spending district. That reaction is a common one, though; surveys consistently show that most people underestimate how much is spent per pupil.
The chart also showed definitively that the school receiving the fewest dollars per student was the district’s second-poorest school. District leaders were surprised—to say the least—and left wondering how their policies had worked to yield fewer dollars to such a low-income population. But it’s not entirely fair to wag a finger at districts for not knowing what would surface in their school-level spending data: They’ve never been asked for it before now.
This focus on the district’s role in resource allocation is new. Historically, school finance discussions have centered on the state’s role with regard to adequacy and cross-district equity: Is the state giving districts enough to do the job of education? Do its funding formula or reliance on local property taxes favor some districts over others?
But the new spotlight on how districts deploy dollars to schools is warranted. Districts decide how to spend the $700 billion in public funds at play in our K–12 education system, even if district leaders and school board members often don’t recognize the significance of their role. Yes, it’s true that many of those dollars come with various strings attached, but those leaders take the cash out of the bank accounts and spend it to pay teachers’ and nurses’ salaries, purchase textbooks, and so on.
For the past two decades, districts have been asked to track student outcomes by school. And for years the federal government has required that districts account for their total dollars by function (“instruction,” “administration,” etc.) and object (salaries, benefits, contracts). But it’s only now that the federal government has required reporting of per-student spending by school. That means many districts may have never examined their own data to see how patterns play out among their schools.
Districts Play a Larger Role in Deciding How Much Is Spent at Each School than Most Realized. What They’re Finding Depends on the District
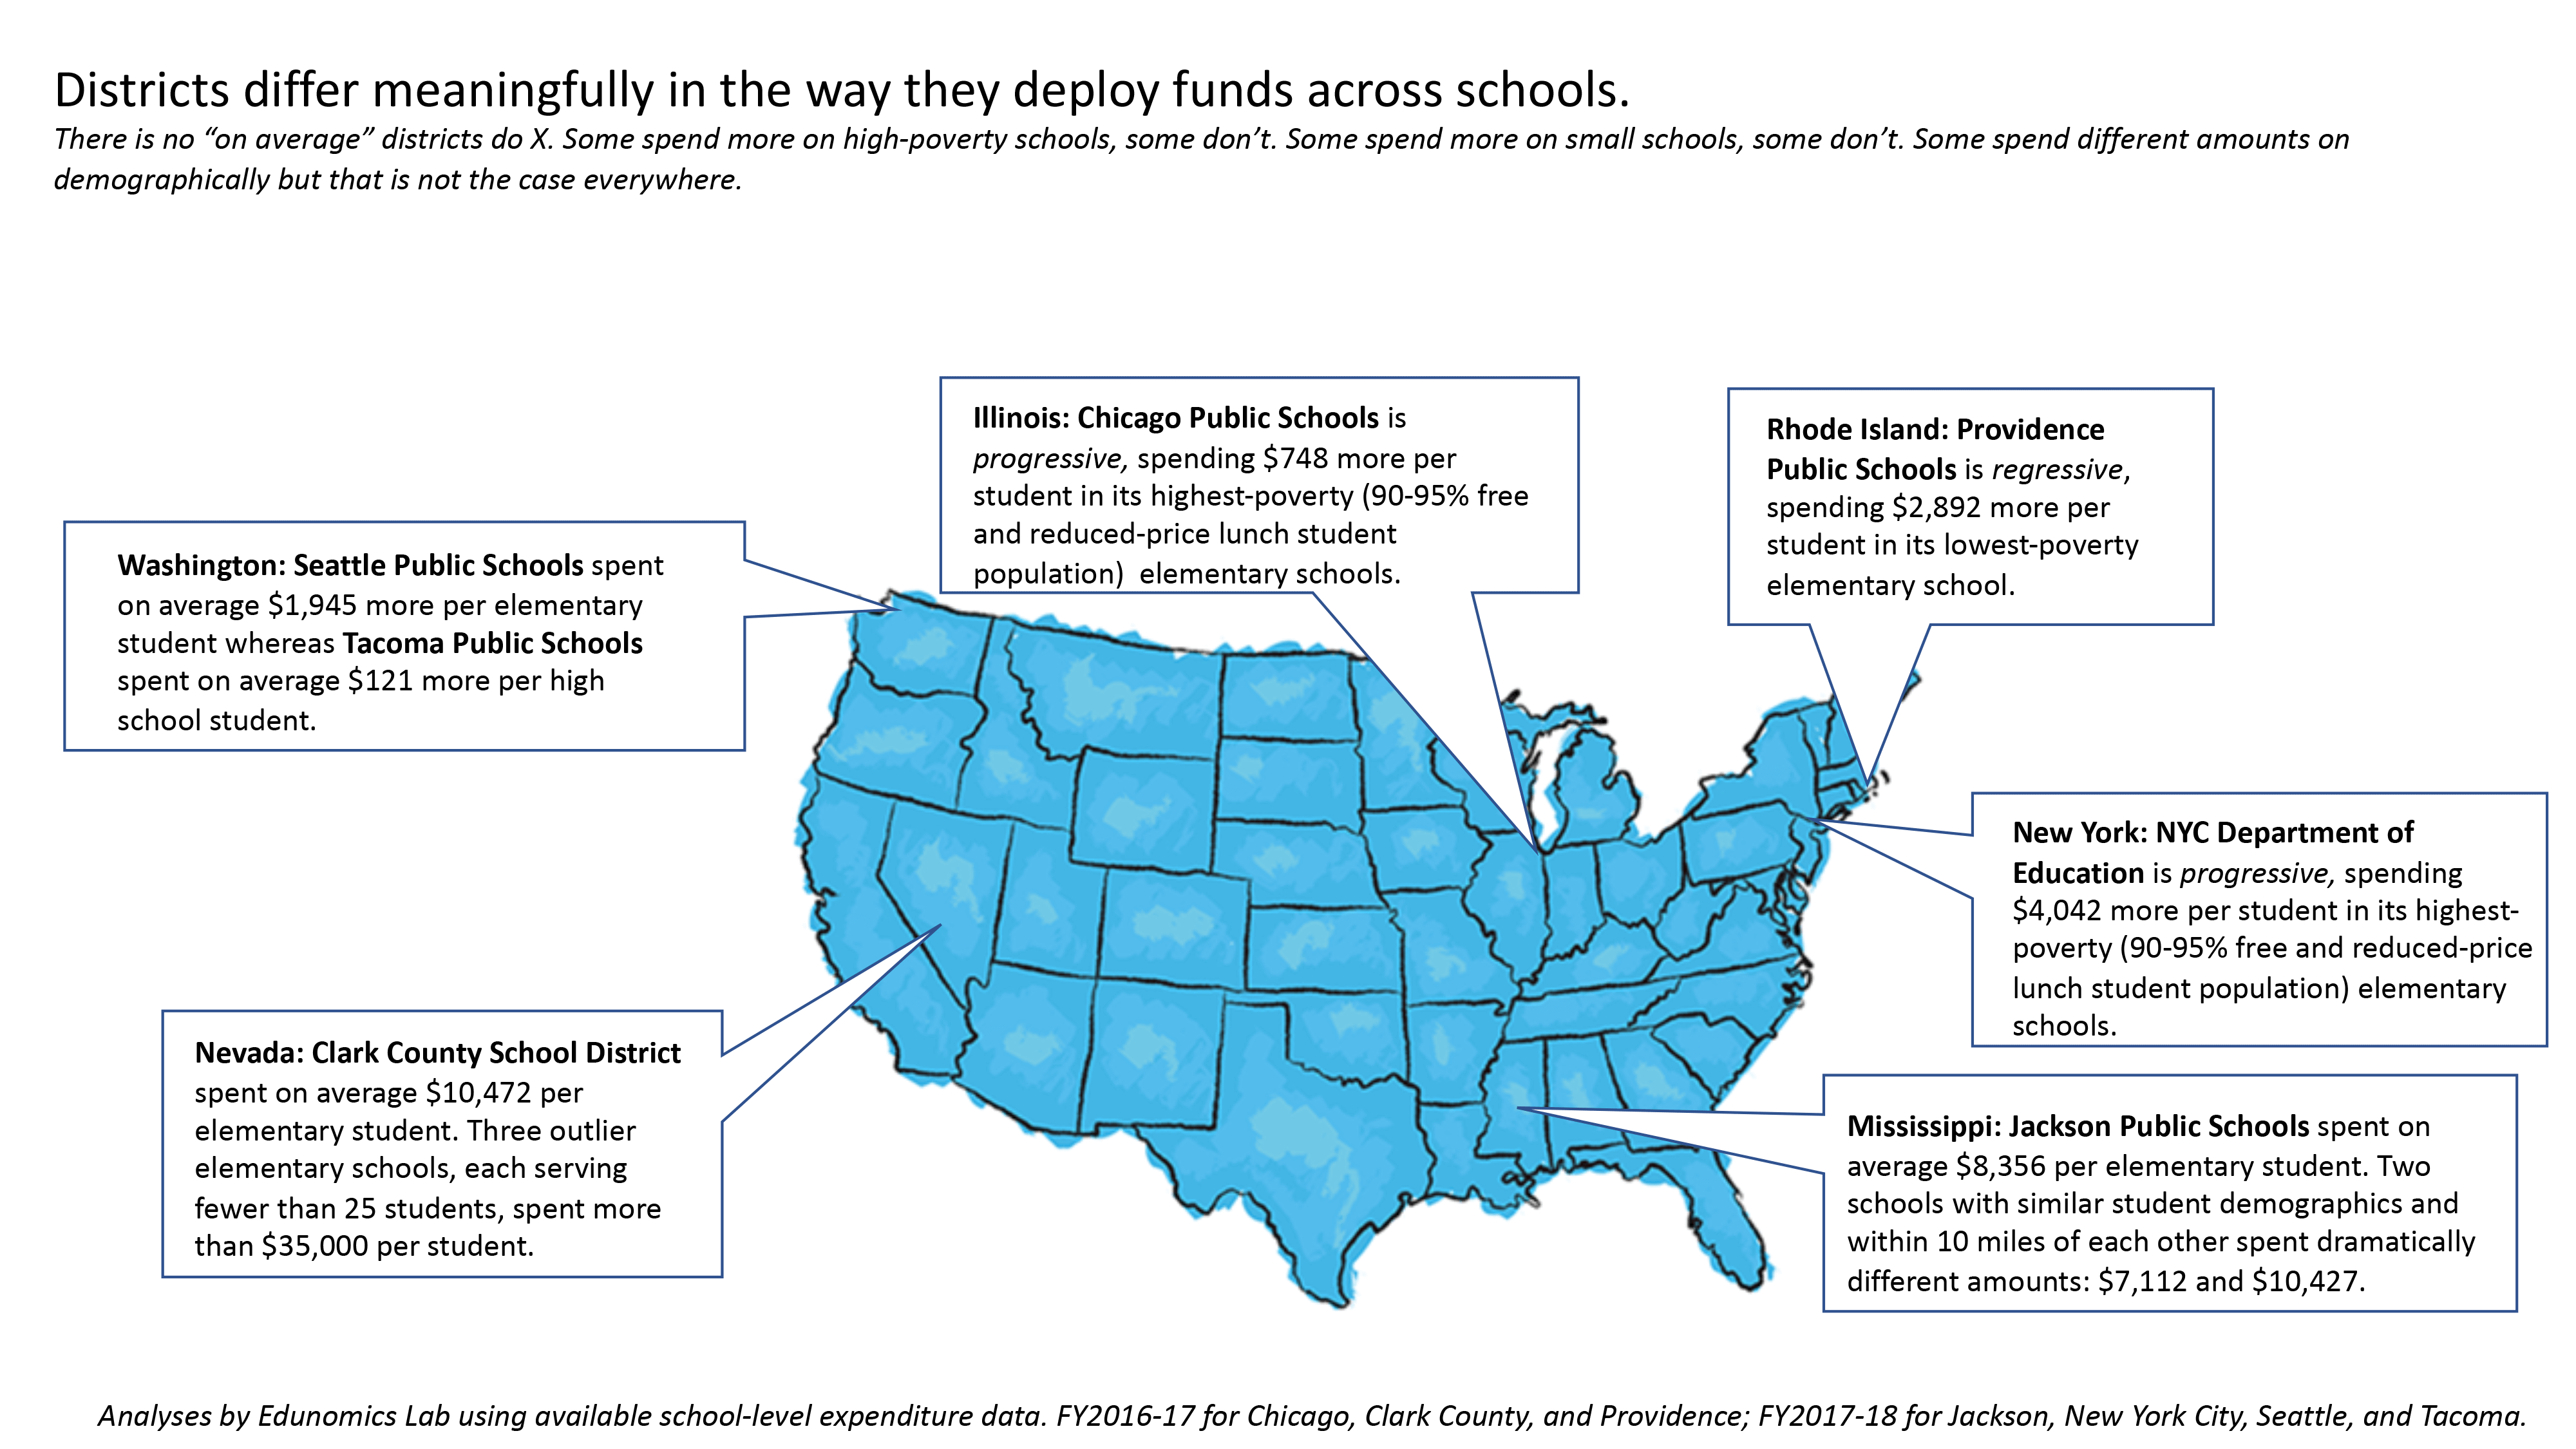
The early ESSA data suggest that any attempt to capture what’s happening “on average” would obscure more than it would reveal. Some districts, like Chicago Public Schools, spend more per student in their high-poverty schools, while others such as Rhode Island’s Providence Public Schools don’t. Some districts (like the one in Collier, Florida) find that they’ve been spending much more per student on one or more outlier schools, while other districts exhibit more even spending across all their schools. Some districts, like San Antonio Unified, spend more per student in their smaller schools, but not all do. Sometimes, as is the case in several Delaware districts, higher spending can be attributed to more senior teachers (and their higher salaries), but it can also be an artifact of a special music program, an International Baccalaureate offering, or staffing policies that benefit schools at the cusp of a cutoff—for example, schools with 300 or more students receive a vice principal. Occasionally the district simply spends more on those schools where more students sign up for sports.
And, of course, in certain instances the patterns are very intentional. Some districts, like San Francisco Unified with its weighted student funding model, have focused on directing more dollars to high-needs schools—and it shows.
Figure 1 highlights some examples from districts across the country.
Often an outlier spending figure makes sense with just a bit of explanation—imagine a school focused on students with autism, or one slated for closure at the end of the year. Context matters, but sometimes even district leaders with all the necessary context are left wondering why they’re spending so much more on one school than another.
Where eyebrow-raising or otherwise unexpected spending patterns emerge, they’re typically not the result of intentionally inequitable acts on the part of district leaders. Districts simply may not be connecting the dots between which schools get what resources due to their own decisions or because of unexamined business-as-usual practices.
It’s more likely that unintended spending patterns develop when districts do things like automatically roll over the past year’s staffing plan without considering the cost implications. Or when they allocate staff (say, a nurse, an assistant principal) on a one-per-school basis for both large and small schools. Or when they fail to pause and ask what it means to locate the new flagship STEM program in an already small, more expensive school. Or even when they pay a bonus for teachers with a master’s degree when one school has many teachers with advanced degrees and another school has very few.
More broadly, what some district leaders attribute to “costs,” others call “spending choices.” For example, we’ve heard district leaders explain higher spending on their high schools with a statement such as: “high schools cost more because there are more specialized courses.” Where districts spend more on their elementary schools, they tend to attribute the higher costs to the “need for smaller classes in the elementary grades.” In other words, “cost” is often a matter of what a district chooses to spend by, say, using a certain delivery model over another; high schools don’t inherently require more resources than middle or elementary schools. Some districts (such as Tacoma, Washington) spend more on high schools and some districts (like Seattle’s) spend less. Those differences reflect choices being made about where and how to deploy resources.
That said, district leaders don’t always realize that they are, in fact, making choices. For example, districts routinely dole out percentage-based, across-the-board pay raises (of 5 percent, for example). While leaders may not think this salary policy affects between-school equity, it does end up directing more dollars to senior, higher-paid teachers. In a district where senior teachers are concentrated in more affluent schools, the raise could exacerbate inequity. For instance, Sacramento City Unified district leaders may not have realized that a recent 11 percent pay raise would drive far more dollars per student to some schools than others. Instead, they could have doled out an across-the-board fixed-dollar raise, which would have more evenly distributed the pay raise across all teachers and raised per-pupil spending across all schools.
Growing Awareness: If a District Spends More on One School, It Spends Less on Another
The new data is also fostering awareness that districts have a finite pot of money: if the district spends more on school X, it will have less to spend on school Y. For example, higher spending on a magnet, specialty, or themed school comes from the same pool of dollars that funds regular schools.
While this zero-sum equation may seem obvious, this fact isn’t always evident to schools and communities. When parents in Seattle pushed to save a Latin teacher in one school, did they realize that doing so could mean fewer dollars for other schools? When a board member pledges a moratorium on school closures, is it clear that that decision will likely mean less funding for any one school?
It’s also not typically evident in the back and forth surrounding collective bargaining negotiations. In Chicago’s fall 2019 teacher strike, the union won an additional $25 million in pay explicitly for veteran teachers. Absent from public discussion was how that spending would drive more dollars to schools with many veteran teachers at the expense of schools with mostly junior teachers.
Take Florida’s Collier County district that fielded the reporter’s call last summer. According to state data, the district spends $17,473 per student on the 176-student Everglades City School—far more than its other schools. District officials quoted in the newspaper article chalked up the high spending to the school’s small size, with costs spread over relatively few students. When asked if the district would consider consolidating the small school with another to save money, the answer was “no.” That’s a choice. And it’s a choice that residents may well support, as the district official described the tiny, remote school as the “fabric of that community.” But will residents continue to support the choice as they increasingly understand that spending more on Everglades City School means spending less on the district’s other schools?
Of course, this isn’t to say that district leaders can’t (or shouldn’t) go to their legislature to push for a larger pot of dollars. But even if those local leaders are successful in growing that state pot, when a district’s budget is made, that district pot is finite. For those who see the focus on how districts distribute funds as a distraction from the push to get more funding from the state, the discussion needn’t be either/or. People can have both conversations: How big should the state pot be and what tradeoffs is the district making as it doles out that money?
Yes, the Hot Seat Can Be Uncomfortable. But the Districts Sitting in It Have a Real Opportunity
In our work with district leaders, we’ve found that they often feel exposed and unprepared for the tough conversations sparked in the wake of the ESSA data release. The district anxiety is real, as we’ve watched this cycle repeat: A state’s data are released, the media report on the variation in spending among a district’s schools, and district leaders are questioned about their allocation decisions. Districts feel they are squarely in the hot seat. And part of the rising temperature stems from districts’ worry that their state agencies won’t give the public the context needed to accurately understand and interpret the school-level data in each community. That’s valid: states’ figures don’t—and really can’t—offer all the relevant context.
But districts are uniquely positioned to provide that context. And just as it’s the district’s job to distribute resources to schools, it’s the district’s job to help its community understand the data that reflect those distribution choices. The ESSA data release gives districts a golden opportunity to engage in healthy, transparent discussion about spending, cost-equivalent tradeoffs, and equity—all rooted in their individual community contexts.
For example, maybe a school suffered a shooting one year, leading the district to invest heavily in new safety measures or additional counseling staff in the building. Or, like Illinois’ Schaumburg High School, a school is the only site in the district to offer specialized services to students with multiple complex disabilities or who are medically fragile. That district was able to communicate unique context for its spending because for each school, Illinois built into its online financial data display a “district comments” field. Districts can take advantage of features like this to tell their communities why the school-level per-student expenditures look the way they do.
It’s not just communities that can be surprised by what the data show about school spending. Often district school boards—which hold fiduciary responsibility for approving district budgets—are themselves surprised by which school surfaces as their most or least expensive. The emerging ESSA data are surfacing the need for district leaders to discuss and reflect internally on spending practices and reach out to their communities to do the same.
The ESSA data could help broaden the stakeholder group for policy changes that districts want to make—even for changes to ingrained policies and practices that have historically been tough sells. Take, for example, the efforts made by leaders in Los Angeles Unified to rein in retiree health care costs. If schools and parents see how these expenses cut into dollars available for schools, might there be more support for changing the status quo? Or when a group of parents in a high-income area advocate for a costly extracurricular in one school, might a district use the school-by-school spending figures to help ensure a balanced response?
The Link Between Spending and Outcomes Is Weak. Will the Data Help Make Money Matter More?
Across several decades of debate on the link between spending and outcomes, on one point researchers tend to agree: school systems could do more to strengthen the relationship between money and outcomes. Toward this end, the newly available data offer some promise.
Districts can start by using their ESSA data to work toward deploying dollars in ways that are consistent with stated strategies. As any public finance textbook will remind us, the way a system deploys its funds is its strategy, whether those allocations match leaders’ statements or not. When a district claims its strategy is to close the achievement gap between wealthier and poorer students, does spending more on its affluent schools, where it has senior teachers and small AP classes, match that strategy? Investigating those policies that stand in the way of spending goals is a smart first step.
Ultimately, though, improving dollar-equity for dollar-equity’s sake isn’t enough. The bigger challenge is ensuring that spending translates into better outcomes for students.
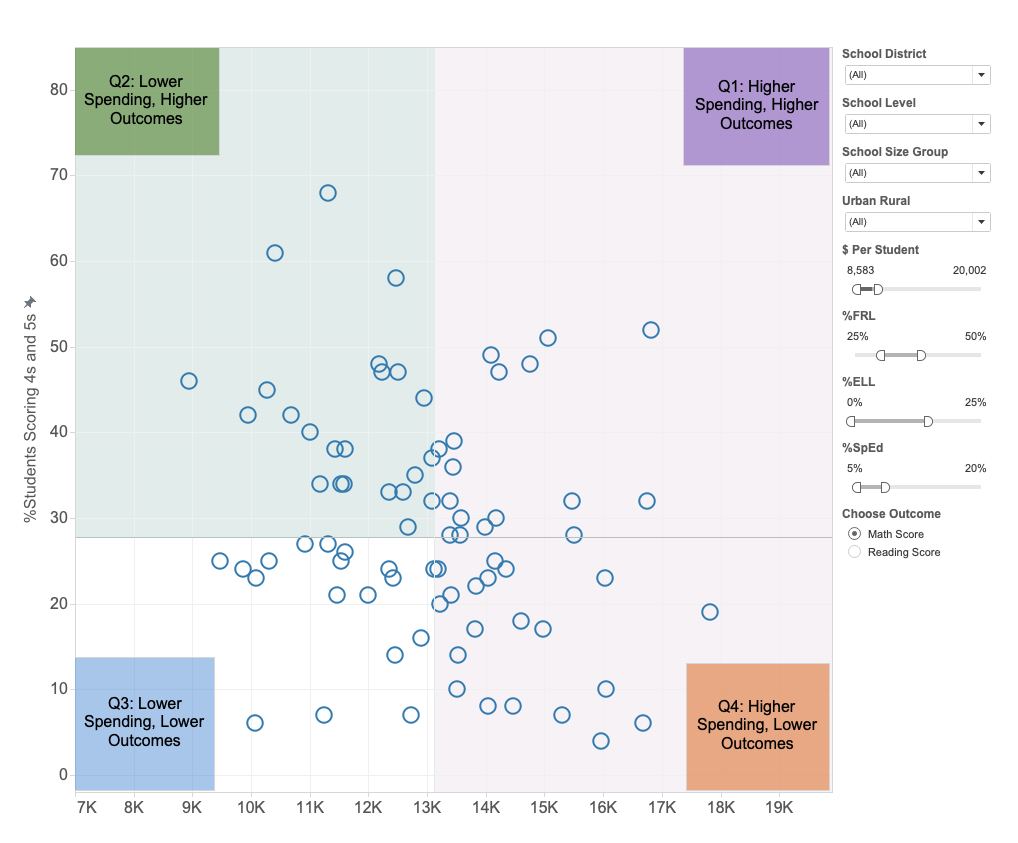
Take the Rhode Island data in Figure 2. This interactive graphic created by Edunomics Lab and Schoolzilla, an education data analytics firm, makes it possible to array 2016 spending and state-test-proficiency data for each school in the state. Filters can be used to include only schools with similar demographics or other characteristics to create comparisons among relevant peers (say, elementary schools with 25–50 percent of their students receiving free or reduced-price lunches, as is displayed here). Visualizations like this help focus attention on how dollars intersect with outcomes at each school. While the relationship between spending and outcomes is weak, broadly speaking, some schools are much more successful than others at using available dollars to drive success on state tests.
Schools: $ Spent by Student vs. Match Score
It’s not (yet) normal operating procedure for districts to talk with their principals about school-level spending, or about the two-sided coin of spending and outcomes at the school level—even as pressure increases to have these conversations. Edunomics Lab has analyzed spending and outcomes data and met with districts in Illinois, Nevada, New York, Rhode Island, and Texas to discuss the findings. When the suggestion surfaced to bring principals from the district’s low-performing schools into the conversation, each district said, “Not yet.” Most administrator and principal preparation programs haven’t historically included any training on using spending data or resource allocation. With no experience in engaging school leaders on spending and outcomes, doing so represented a major shift that district leaders weren’t yet prepared to make.
Should States Demand Districts Make Changes in Spending?
With very few resources to create spending reports, most state agencies have focused squarely on complying with the federal law. Doing so has required untold hours of mining existing data systems, building new structures for data capture, communicating with districts, publishing new accounting methodologies, and designing data displays. Some state leaders, like those in Massachusetts, Illinois, and Indiana, have gone further in providing resources for district leaders to build capacity and skills for engaging with the new data.
What we haven’t seen is state education chiefs demanding change from districts in how they allocate resources. That’s frustrated advocates who want state leaders to muscle districts into addressing spending inequities across schools. But the negotiations over ESSA revealed that there never was broad agreement on whether districts should be required to remedy those inequities. District leaders argue that local context should matter in their spending, and they push back on federal intervention on local control. The release of financial data was a compromise of sorts—a way to honor local control over spending but ensure that it is done with eyes wide open.
As state agencies and others build reports and tools that enable analysis of district spending patterns, there will likely be more calls for states to prescribe financial reallocations. At this point, it seems too early to tell if or how states will use the data in state policymaking—or even if that’s a smart path forward. Reasonable people will have different views about whether change works better when spending remedies are imposed from above or when local stakeholders grapple with their own spending decisions amid the pressures that come with transparency. For those concerned that state spending prescriptions might do more harm than good, an alternative policy option for states is to focus less on legislating spending parameters and more on building financial skills and improving access to data and analysis.
Looking Ahead: The Focus on the District’s Role in Finance Isn’t Going Away
It will undoubtedly take time for school systems to catch up fully with this focus on school-by-school spending and all of its ramifications. Some leaders may embrace the chance to engage with the data, examine the historic underpinnings of their system’s spending choices, and move forward with an eye toward making more intentional and equitable financial tradeoffs.
Others may worry that their communities can’t understand the complex nature of district spending decisions. Often parents and teachers—and even school officials, as mentioned earlier—are surprised at just how high the per-student figures typically are. Some district leaders have shared their concerns that parents won’t understand why the district spends more on students with disabilities, or that schools have little choice but to spend large sums on things like transportation, pensions, and other centrally managed functions. With these concerns, some leaders will simply say that the figures are misleading and not to be trusted.
But resisting isn’t likely to work in the long run. The ESSA data reporting isn’t the only effort intended to spotlight districts’ role in the distribution of resources. Other federal guidance asks districts to articulate their method for allocating resources to schools. And another federal provision asks states to conduct periodic reviews of districts’ resource allocations to support school improvement.
The bottom line is that the focus on the district isn’t going away. Perhaps district leaders can consider the release of their data a “teachable moment.” Districts have much to learn from the data, and they have ample opportunity to educate people inside and outside the system about what the data mean. More importantly, districts have the opportunity to act on the data, engaging in dialogue with their communities about how to create more equitable and productive systems.
Marguerite Roza is research professor at Georgetown University and director of the Edunomics Lab, where Laura Anderson is the associate director.
Read more from Education Next on coronavirus and Covid-19.