
When Minnesota passed the nation’s first charter-school law in 1991, its main purpose was to improve education by allowing for new, autonomous public schools where teachers would have more freedom to innovate and meet students’ needs. Freed from state regulations, district rules, and—in most cases—collective-bargaining constraints, charter schools could develop new models of school management and “serve as laboratories for new educational ideas,” as analyst Brian Hassel observed in an early study of the innovation. In the words of Joe Nathan, a longtime school-choice advocate and former Minnesota teacher, “well-designed public school choice plans provide the freedom educators want and the opportunities students need while encouraging the dynamism our public education system requires.”
Over the next two decades, 45 additional states and Washington, D.C., passed their own laws establishing charter schools. And by 2020–21, nearly 7,800 charter schools enrolled approximately 3.7 million students, or 7.5 percent of all public-school students nationwide. The most recent charter law was passed in 2023 in Montana, though its implementation has so far been blocked by court order; today, only North Dakota, South Dakota, Nebraska, and Vermont have not passed charter legislation.
During those years, advocates have carefully tracked and analyzed state policies and enrollments to compare charter school growth, demand, and access across the United States. But to date, there have been no comparisons of charter school performance across states based on student achievement adjusting for background characteristics on a single set of nationally administered standardized tests. Instead, advocacy organizations routinely rank states based on one or more aspects of their charter school programs—factors such as the degree of autonomy charters are afforded, whether they receive equitable funding, and the share of a state’s students they serve. These rankings are informative, but they do not provide direct information about how much students are learning, which is, ultimately, the general public’s and policymakers’ primary concern.
We provide that information here, based on student performance in reading and math on the National Assessment of Educational Progress, or NAEP, between 2009 and 2019. These rankings, created at the Program on Education Policy and Governance (PEPG) at Harvard University, are adjusted for the age of the charter school and for individual students’ background characteristics. They are based on representative samples of charter-school students in grades 4 and 8 and cover 35 states and Washington, D.C. We also estimate the association between student achievement and various charter laws and characteristics.
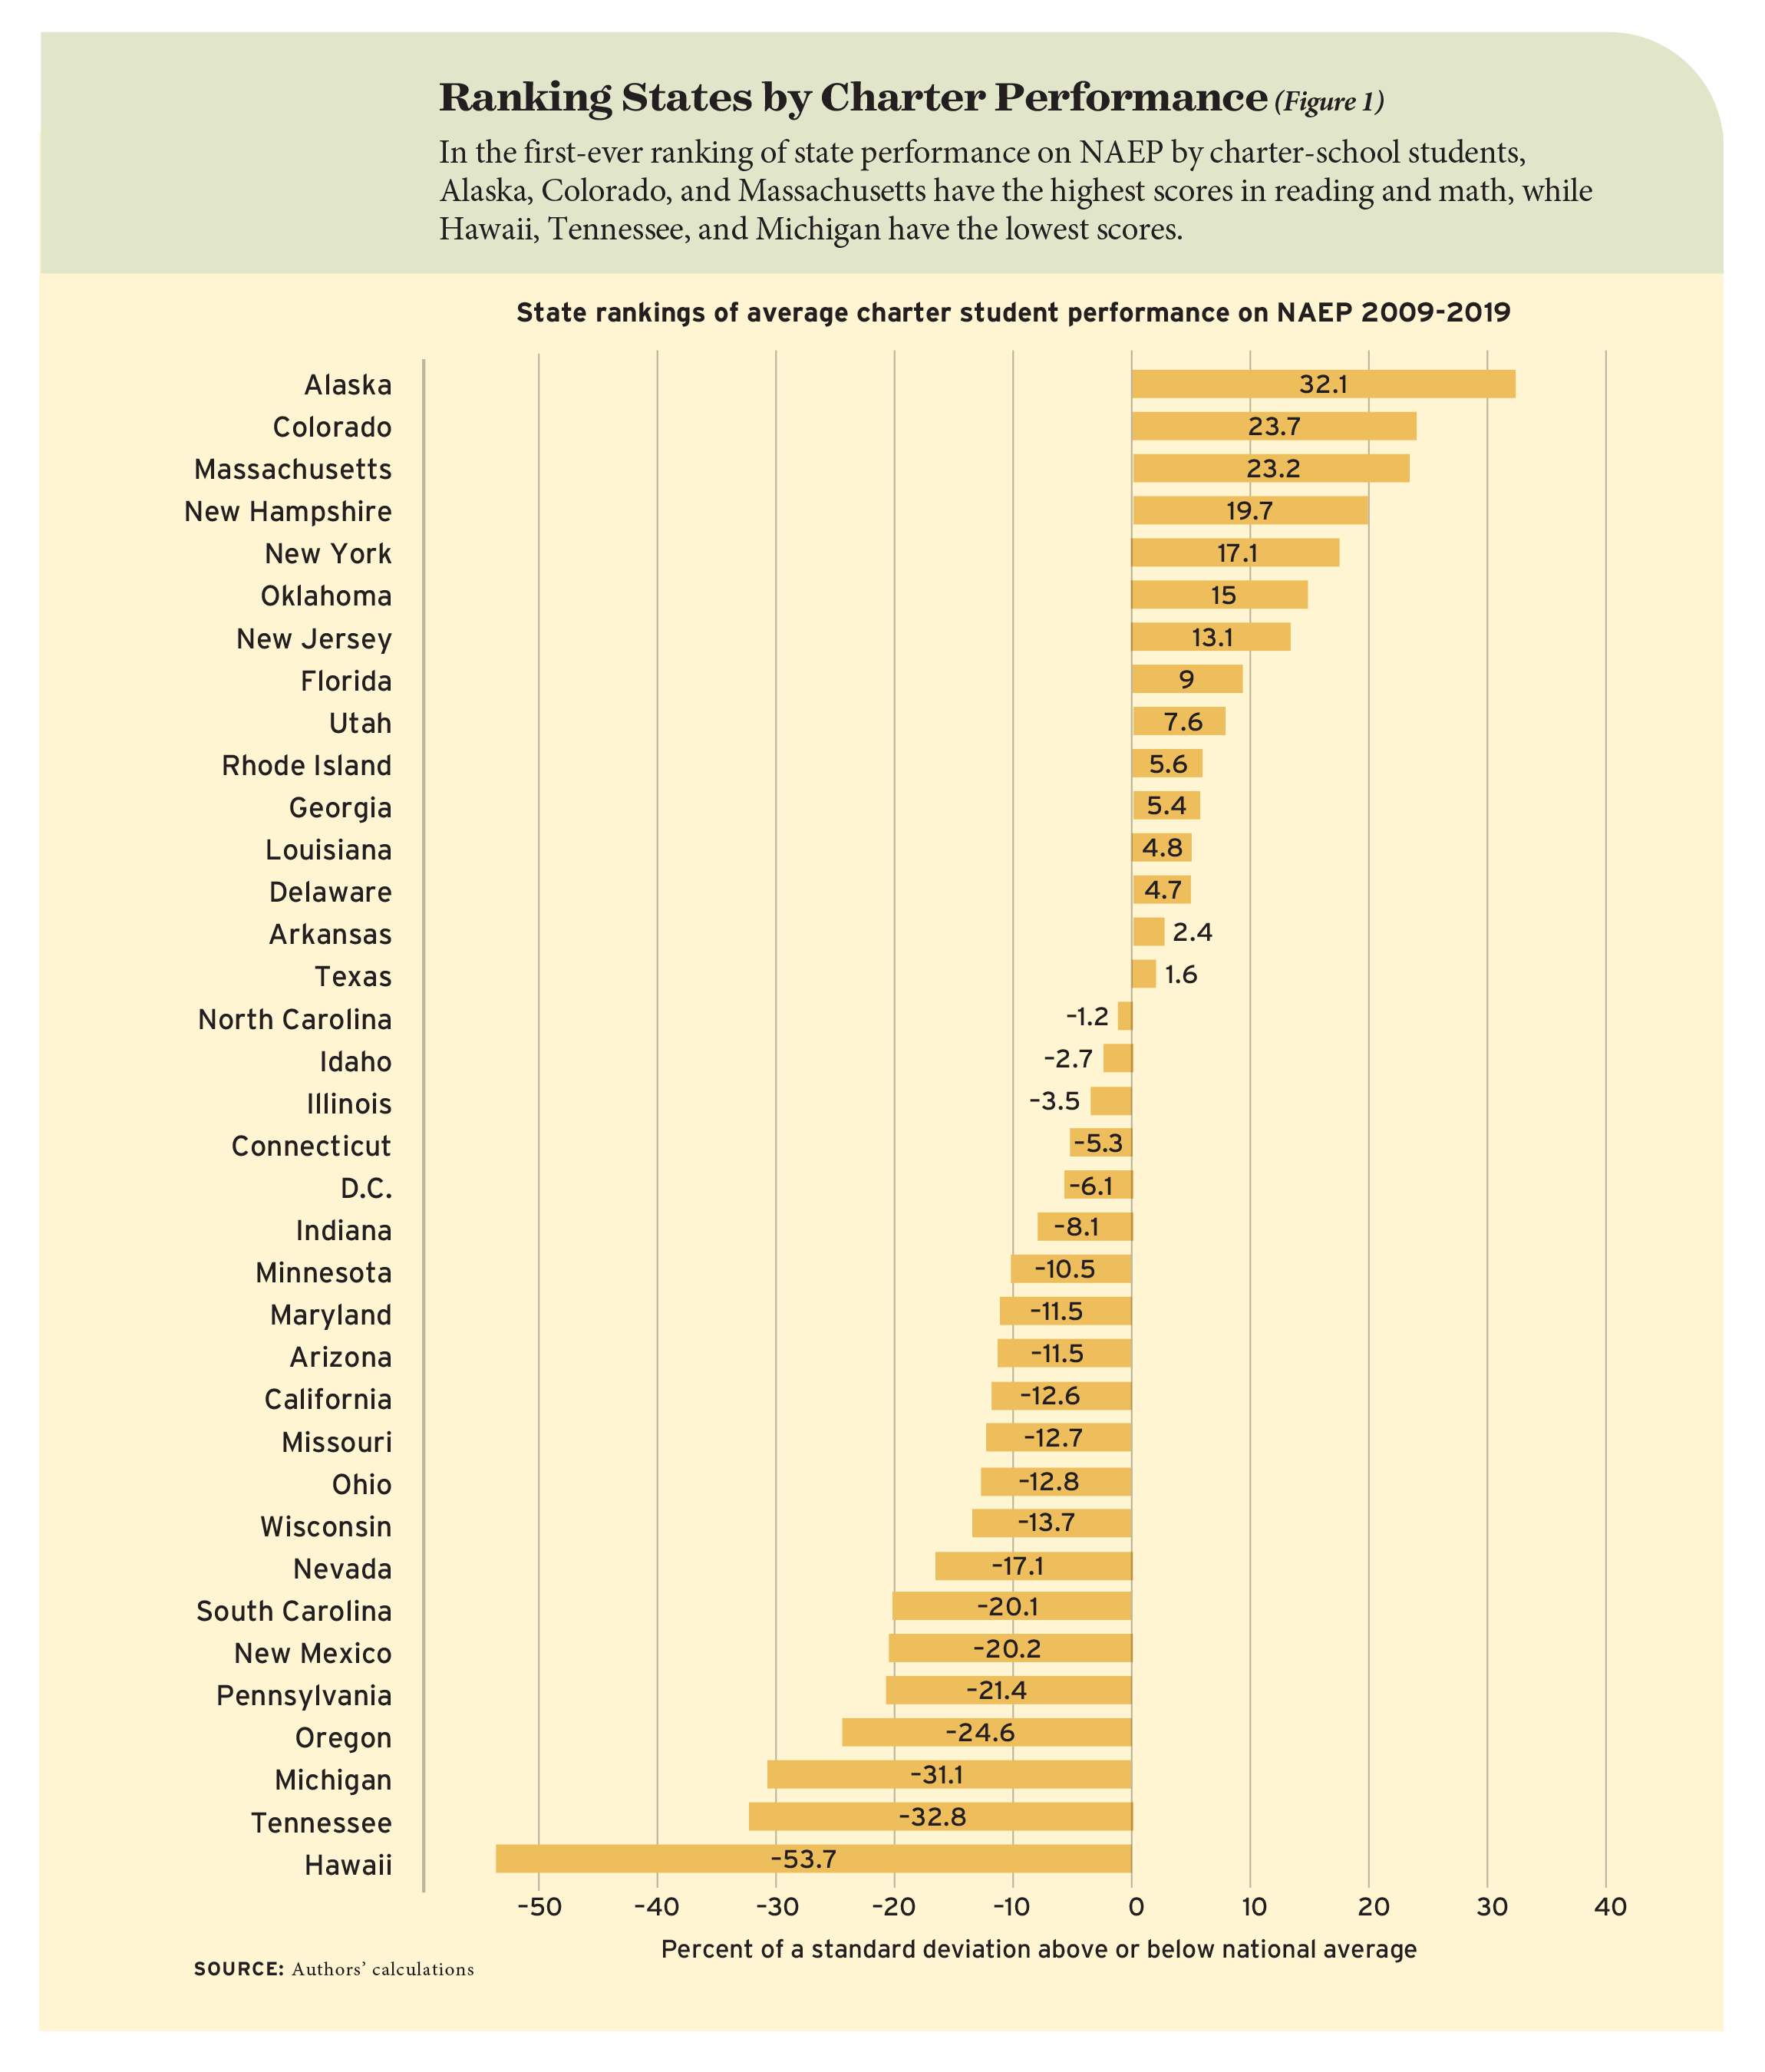
Overall, the top-performing states are Alaska, Colorado, Massachusetts, New Hampshire, New York, Oklahoma, and New Jersey. The lowest-ranked charter performance is in Hawaii, followed by Tennessee, Michigan, Oregon, and Pennsylvania. Students in the South tend to perform above average, while students in midwestern Rust Belt states rank at the midpoint or below. We also find that students at schools run by charter networks outperform students at independent charters, on average, while students at schools run by for-profit organizations have lower scores on NAEP, on average. Students at charters authorized by state education agencies have higher scores than students at those authorized by local school districts, non-educational organizations, or universities.
We hope these rankings will spur charter-school improvement in much the same way that NAEP results have stimulated efforts to improve student achievement more generally. Current debates include whether authorizers should regulate schools closely or allow many and diverse flowers to bloom, whether charters should stand alone or be incorporated into charter school networks, and whether for-profit charters should be permitted. A state ranking of charter student performances may not answer such questions, but it can stimulate conversations and foster future research that could.
Assessing State-Level Achievement
We create the PEPG rankings based on NAEP tests in reading and math. The tests, known as the Nation’s Report Card, are administered every two years to representative samples of U.S. students in grades 4 and 8. To obtain a robust sample for each state, each survey wave includes more than 100,000 observations of public-school students in both district and charter schools. The number of tested charter-school students varies between 3,630 and 7,990 per test, depending on the subject, grade, and year.
Our analysis looks at the period between 2009 and 2019, when 24 tests were administered. This yielded 3,732,660 results in all, but we focus on the 145,730 results from charter-school students. We include results from Washington, D.C., and the 35 states with enough tested charter-school students to permit precise estimates. That excludes the five states that do not currently allow charter schools, as well as Alabama, Iowa, Kansas, Kentucky, Maine, Mississippi, Washington, Virginia, West Virginia, and Wyoming. Still, the results in our sample account for more than 99 percent of all charter-school student scores in NAEP.
We also look at anonymized demographic information about test-takers, which was provided by the U.S. Department of Education under a special license. The weighted composition of our sample is 32 percent white, 30 percent Black, 31 percent Hispanic, and 4 percent Asian and Pacific Islanders. Some 58 percent are from a low-income household. Fifty-six percent were tested at a charter school located in a city, 30 percent in a suburb, 5 percent in a small town, and 10 percent in a rural area. Among 8th graders, 45 percent indicate that at least one parent completed college. Another 37 percent report that their parent does not have a college degree, and information is missing for the remaining 18 percent.
In estimating charter performance by state, we place charter scores in each subject on a common scale, adjusting for year of testing, subject, grade level, and the year the charter school opened. NAEP weights test-score observations so they are representative of the true underlying student population. We also adjust scores to take into account the age of the test-taker, parents’ education levels, gender, ethnicity, English proficiency, disability status, eligibility for free and reduced school lunch, student-reported access to books and computers at home, and location.
We then rank states based on the adjusted average scores for their charter students from 2009 to 2019 as compared to the average scores for all charter students nationwide over the same period. We report the size of these differences, whether positive or negative, as a percentage of one standard deviation in student test scores and note here that a full standard deviation is equivalent to roughly three-and-a-half years of learning for students in these grades. Several states have such similar scores they can be considered to be statistically tied, so undue weight should not be placed on any specific rank number. (See the unabridged version of this paper, published in the Journal of School Choice, for information that allows one to calculate whether any two states are statistically tied.)
Rankings and Results
The strongest academic performance from charter-school students is in No. 1-ranked Alaska, at 32 percent of a standard deviation above the average charter score nationwide, followed by Colorado and Massachusetts, then by New Hampshire, New York, Oklahoma, and New Jersey (see Figure 1). The lowest-ranked charter performance is in Hawaii, at 54 percent of a standard deviation below the national average, followed by Tennessee, Michigan, Oregon, and Pennsylvania.
Alaska’s high ranking for charter-school student achievement may seem surprising given its low ranking for NAEP performance by all public-school students. In a 2019 analysis by the Urban Institute, Alaska ranked at or near the bottom in both reading and math in grades 4 and 8. It is possible that results are skewed in some way by the challenge of controlling for Alaska’s distinctive indigenous population, which makes up about 20 percent of K–12 students. However, Stanford economist Caroline Hoxby found Alaska among the top three states in an analysis conducted on scores in 2003. Further, Alaska’s charter achievement ranks seventh when no adjustments are made for background characteristics. Charter student performance in Alaska seems to deserve its ranking in the top tier.
In looking at the five lowest-ranking states, Hawaii’s very poor performance is skewed downward by NAEP’s incorporation of indigenous Hawaiian population and other Pacific Islanders into the broad “Asian” category, a sizeable share of the charter student population (see “Does Hawaii Make the Case for Religious Charters?,” features, Winter 2024). If the analysis is limited to the years 2011 to 2019, indigenous Hawaiians and Pacific Islanders can be classified separately. When this is done for those years, Hawaii’s performance shifts to –35 percent of a standard deviation, and the state’s score resembles that of Tennessee.
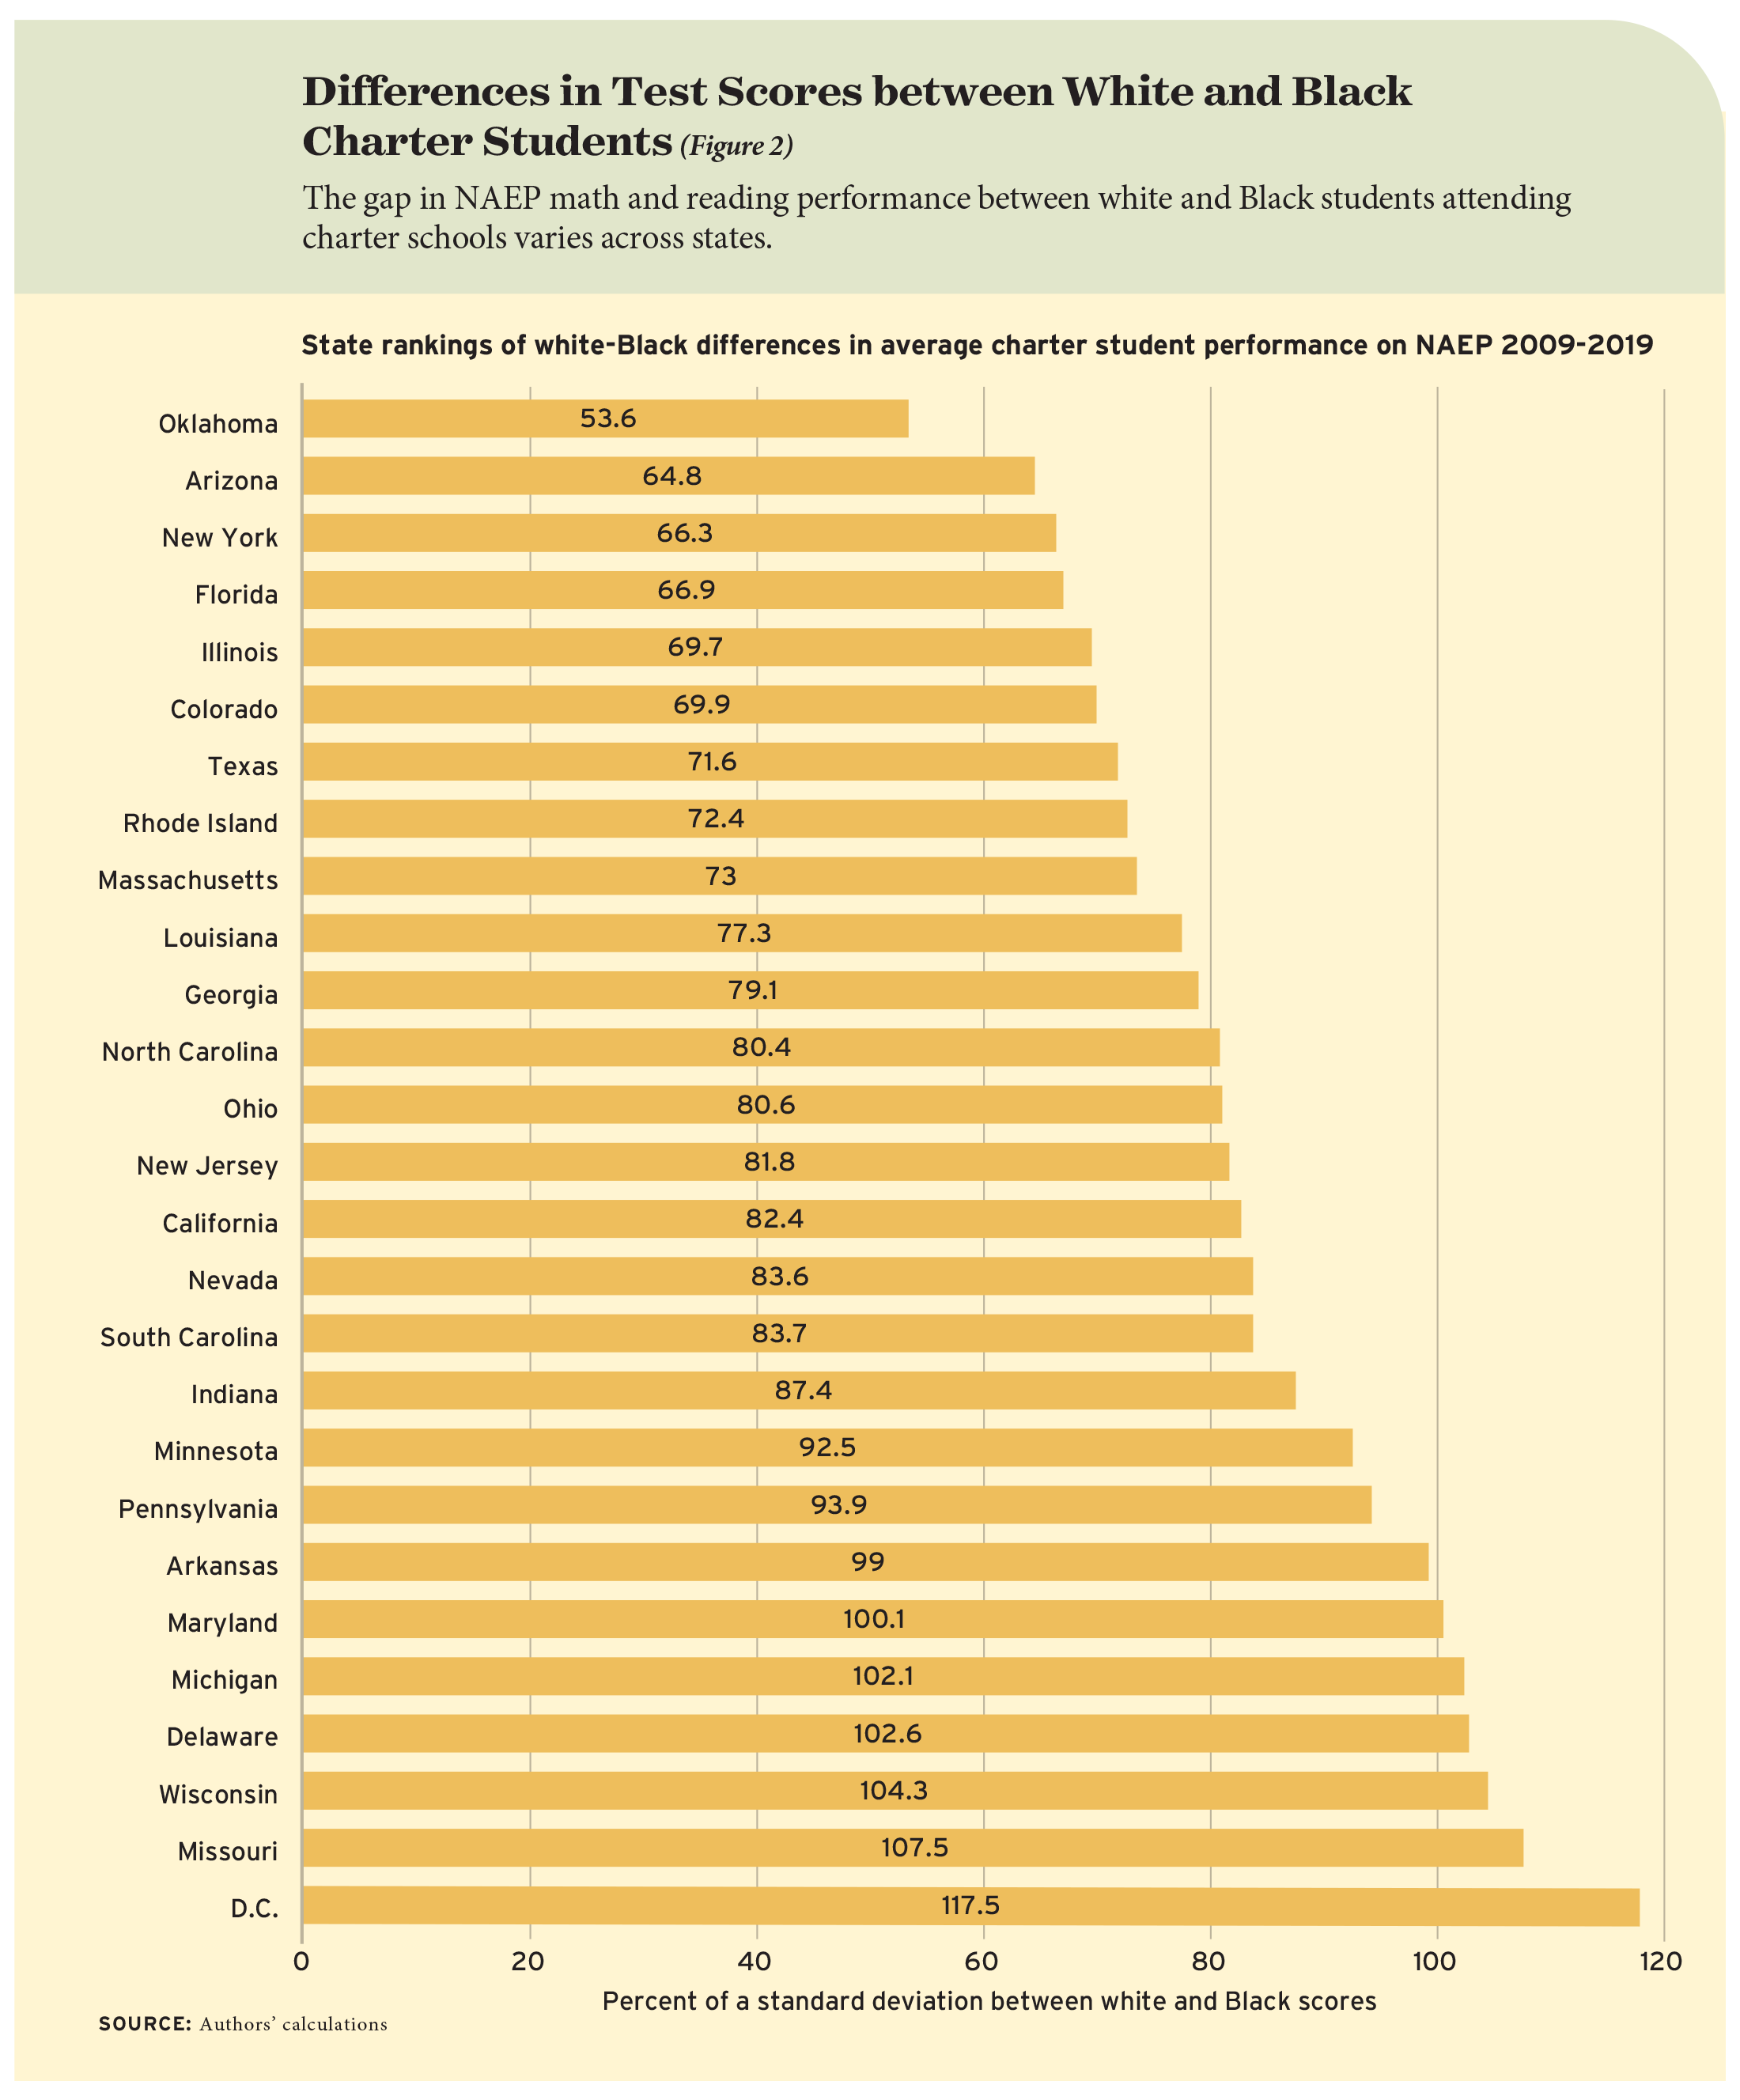
We then estimate differences in test-score performance between students of various racial and ethnic groups in each state, while still adjusting for other background characteristics. States vary in the degree to which the performance of white charter students exceeds that of Black and Hispanic ones (see Figures 2 and 3). The gap between Black and white charter-school students’ test scores is more than a full standard deviation, or roughly equivalent to three-and-one-half years of learning, in D.C. and five states: Missouri, Wisconsin, Delaware, Michigan, and Maryland. By comparison, that gap is equivalent to about two-and-one-half years of learning in Oklahoma, Arizona, New York, Florida, and Illinois.
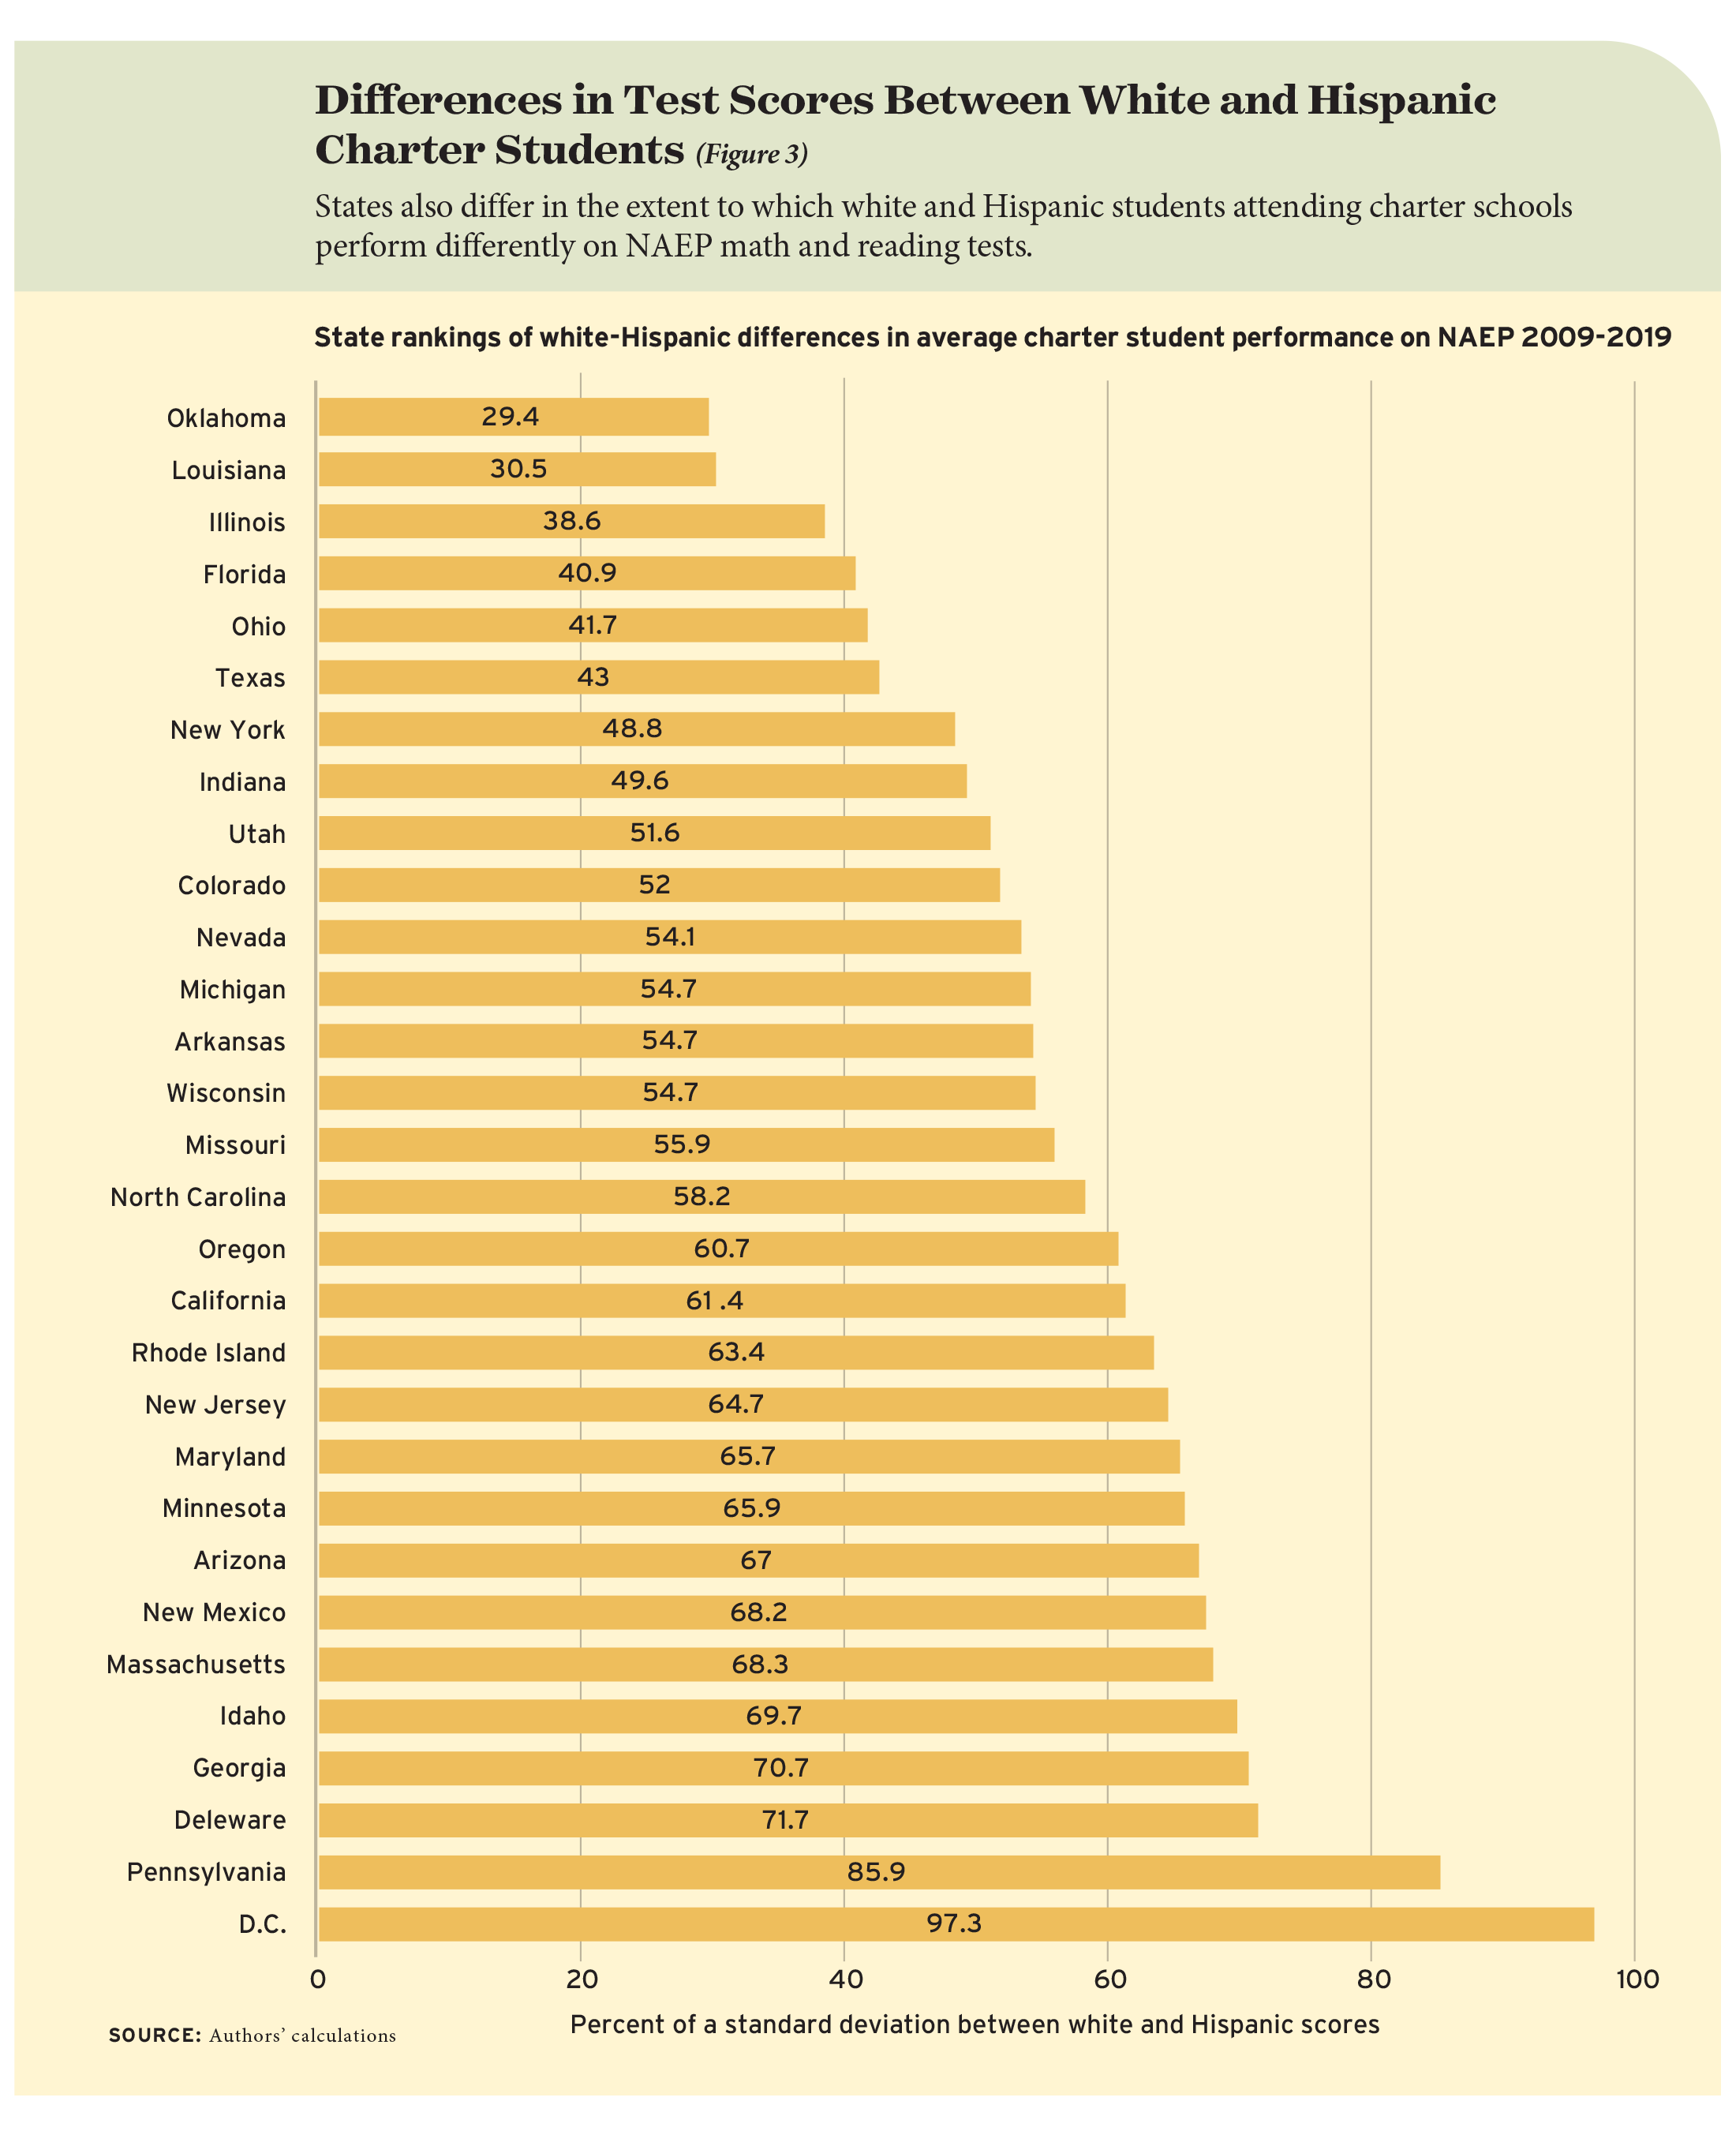
We find the largest score differences between white and Hispanic students in D.C., Pennsylvania, Delaware, Georgia, Idaho, and Massachusetts. States with the least divergence in white-Hispanic scores are Oklahoma, Louisiana, Illinois, Florida, and Ohio, where scores differ by roughly one to one-and-a-third years of learning.
Oklahoma and Florida have among the smallest disparities between white charter students and both Black and Hispanic charter students. By contrast, D.C. and Delaware have exceptionally large differences between those student groups. These differences may be a function of which students opt to enroll in charter schools or some other mechanism not captured by observed student characteristics. Or they may reflect divergent charter practices.
Comparison to Statewide Rankings
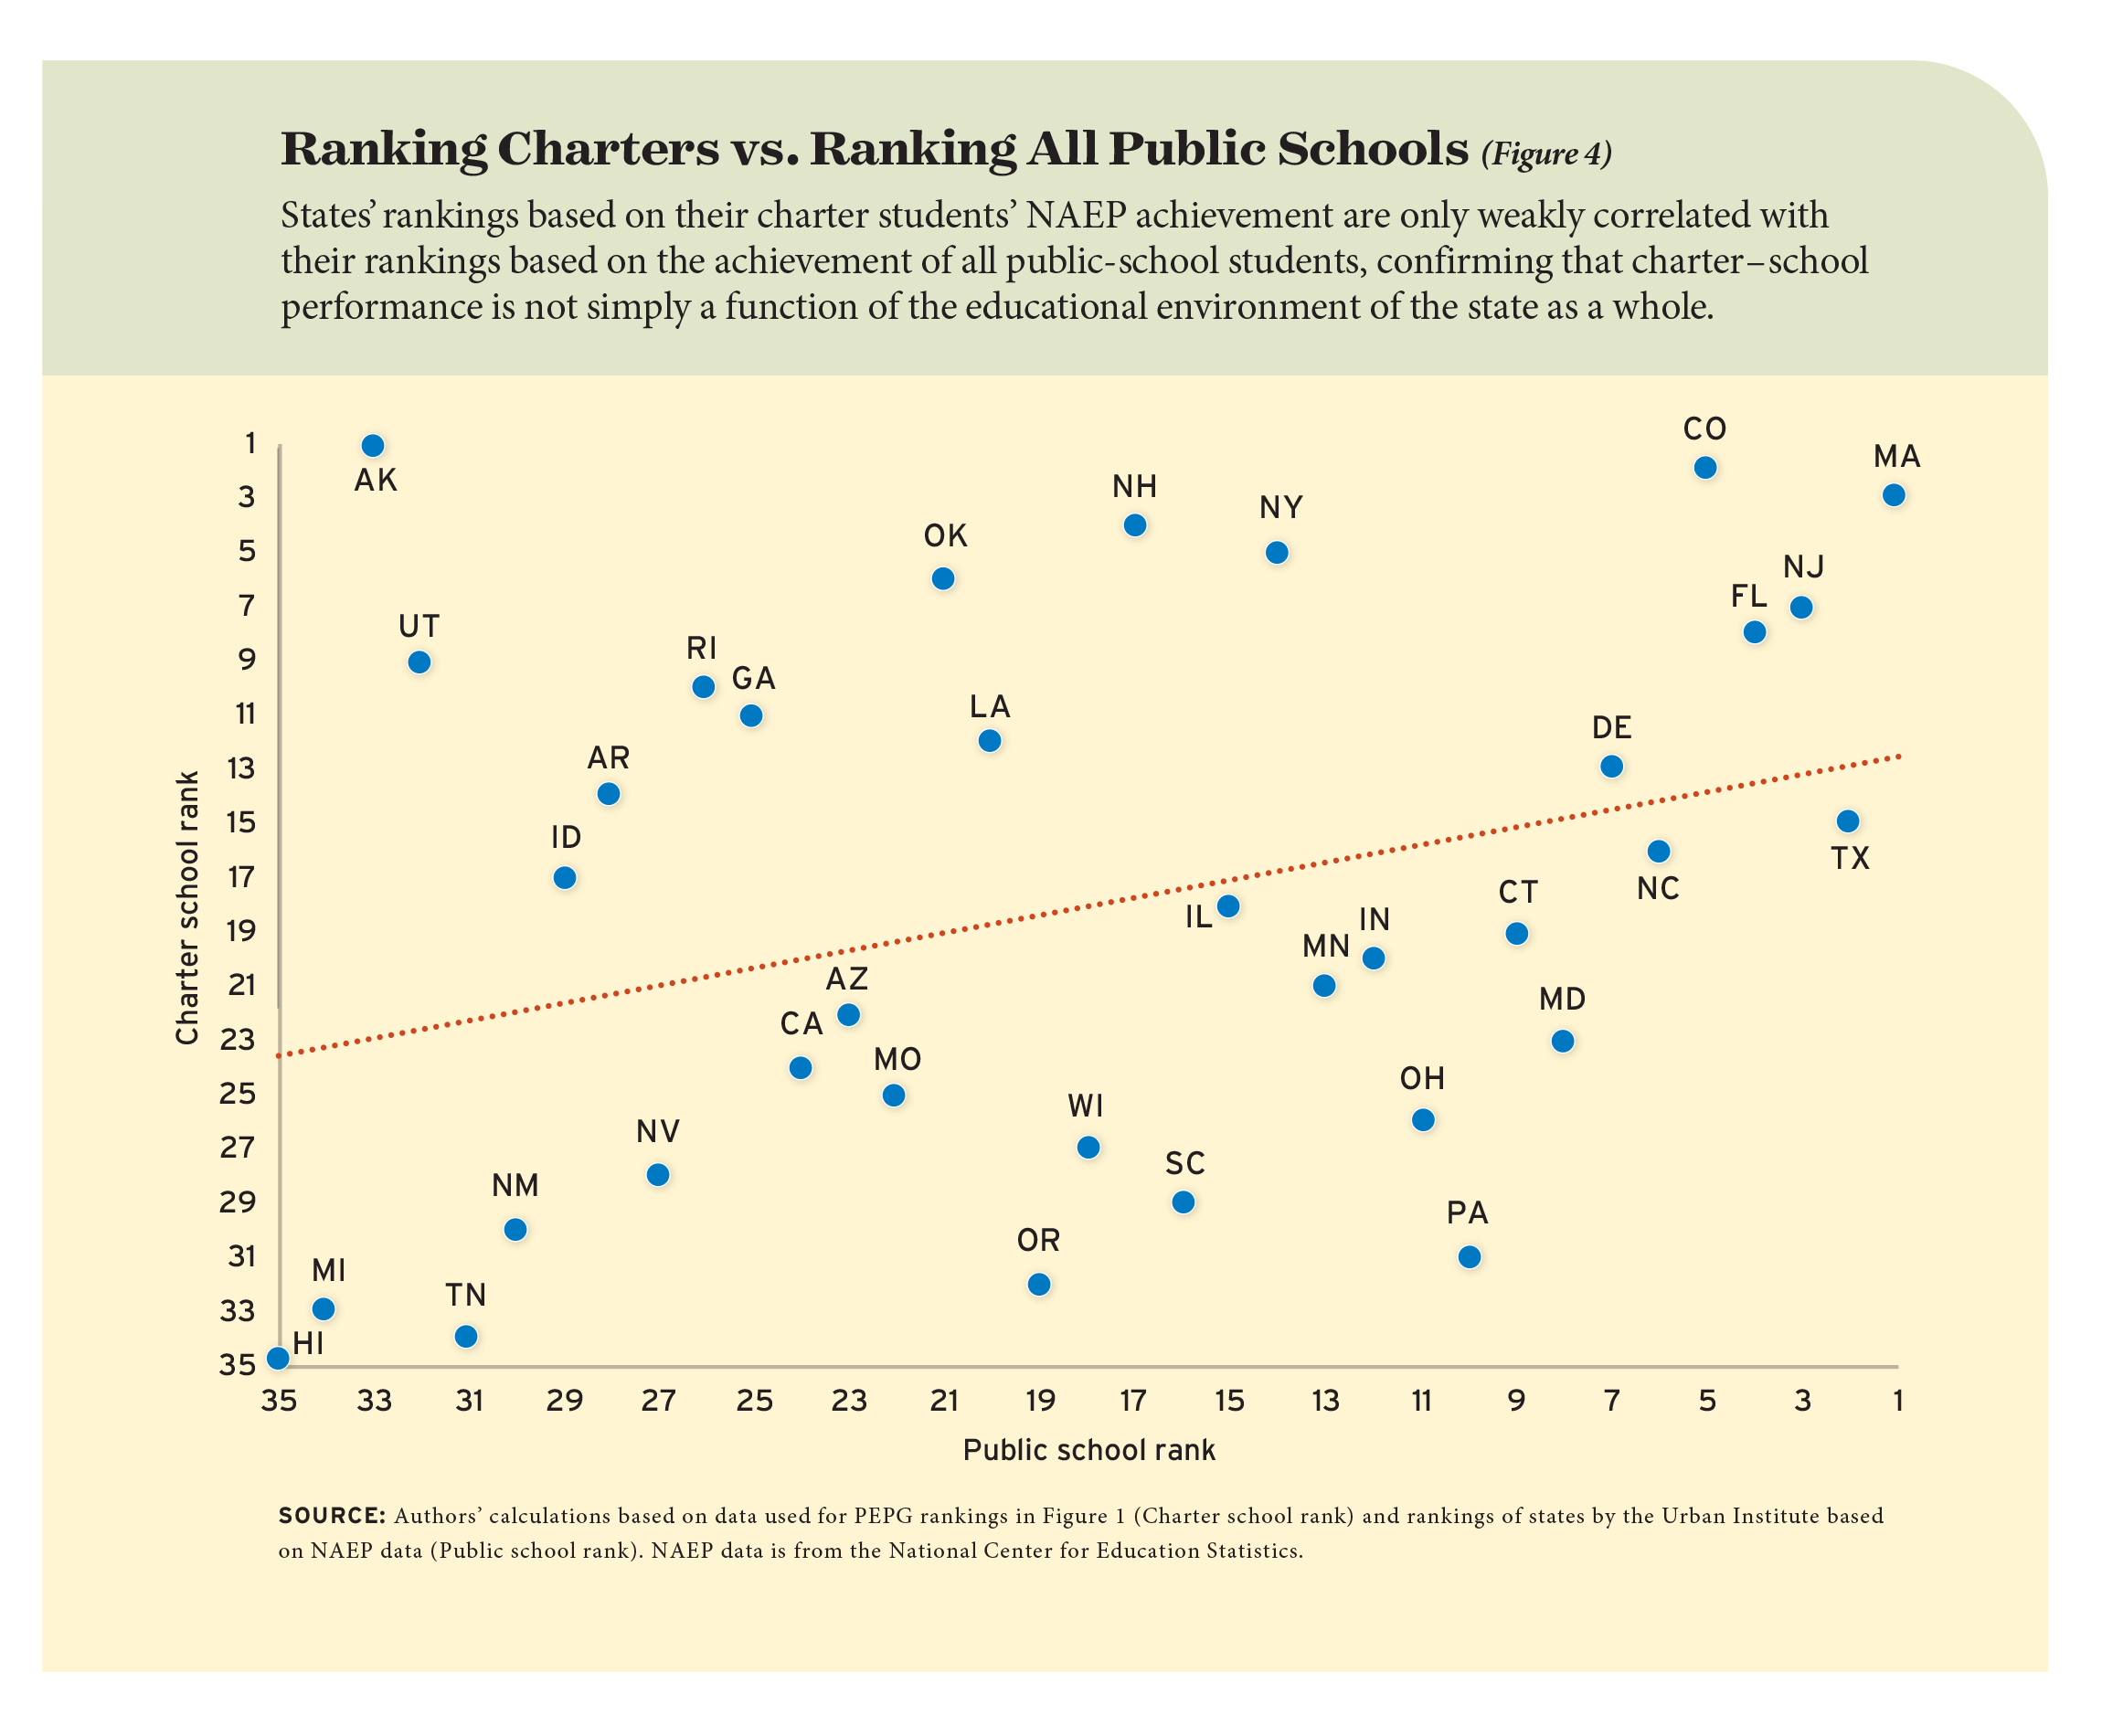
How closely do the PEPG state rankings mirror similar efforts to rank states based on student achievement across all public schools? We might expect strong correlations, as charter student performance could be affected by a state’s educational climate, including family and community support for schools and students as well as the talents and training of its teachers.
To explore this possibility, we calculate the relationship between PEPG rankings for charter students with state rankings made by the Urban Institute for student achievement at all public schools. Importantly, the comparison is for performance on the same tests for the same period, and the adjustments for family background characteristics are virtually identical.
The rankings for charters and for all public-school students are only modestly correlated (see Figure 4). Massachusetts, New Jersey, Colorado, and Florida have similarly high rankings on both. At the other end of the distribution, California sits at the 24th position in both standings. But the rankings for other states differ sharply. Texas, Pennsylvania, and Indiana are ranked 2, 10, and 12 on the Urban Institute list but land at 15, 31, and 20, respectively, in the PEPG ranking. Conversely, Oklahoma is ranked 6th and Utah is ranked 9th in the PEPG rankings, but these states rank 21st and 32nd, respectively, on the Urban Institute’s list. In short, charter-school performance is not simply a function of the educational environment of the state as a whole.
A Close Look at CREDO
Another state-level ranking of charter schools warrants detailed discussion. In a June 2023 report, the Center for Research on Education Outcomes (CREDO) at Stanford University ranked 29 states by the academic performance of their charter schools from 2014 to 2019. This ranking is based on state test results and compares charter students’ performance, adjusted for prior-year test scores and student background characteristics, to that of students at nearby district schools. This average difference approach to assessing charter performance diverges significantly from the PEPG yardstick, which ranks states by the average level of charter performance, adjusted for student background.
CREDO rankings would nonetheless resemble the ones reported by PEPG if average student achievement were identical at all district schools throughout a state and the country as a whole. Since that is not the case, CREDO rankings are affected as much by scores at district schools as by scores at charters. This is not a mere hypothetical possibility. CREDO finds that test scores for Black students at charter schools showed they “had 35 days more growth in a school year in reading and 29 days in math” relative to comparable students in nearby district schools, and Hispanic students “grew an extra 30 days in reading and 19 additional days in math.”
Meanwhile, white charter students do no better in reading than white students at district schools, and they perform worse in math by 24 days of learning. CREDO also finds better outcomes for charter schools in cities than suburbs—test scores for students at urban charters showed 29 additional days of growth per year in reading and 28 additional days in math. Suburban charters did not perform significantly better than district schools in math but had “stronger growth in reading” amounting to 14 additional days of learning.
These findings could indicate that Black, Hispanic, and urban students attend higher-quality charter schools than those available to white and suburban students. But an alternative interpretation is more likely: White and suburban students have access to higher-quality district schools than those available to Blacks, Hispanics, and city residents. CREDO’s state ranking is useful in considering how the presence of charters affects the choices available to students in each state, but it does not order states by the performance levels of charter students, as the PEPG rankings do.
Impacts of Innovations
The specifics of each state’s charter law and regulations differ substantially, helping the charter sector live up to the “laboratory” principle. This sets the stage for a variety of comparisons looking at which aspects of charter school governance might contribute to student success.
For example, the type of agency granted the power to authorize charters ranges from the state board of education to local school districts to mayoral offices. Accountability requirements vary from tight, ongoing monitoring to nearly none. The saturation of the charter sector is similarly diverse—in states like Arizona, California, and Florida, 12 percent or more students attend a charter compared to 3 percent or less in Maryland, Mississippi, and New Hampshire. Charter funding differs as well, both among and within states, based on revenues and regulations set by federal, state, and local agencies and authorizers. In 2019, charter-school revenues per pupil ranged from $27,825 in D.C. to $6,890 in Oklahoma.
On some widely debated topics, we find little support for either side of the dialogue. For example, we find no higher levels of achievement in states with a larger percentage of public-school students attending charters. Nor do we find a correlation between charter student achievement and the age of the charter school, whether a state permits collective bargaining, or the level of per-pupil funding charter schools receive within a state.
We do find differences when looking at some of the innovative features of charter schools, including authorizing agencies, management structures, and whether schools have an academic or programmatic specialization.
For example, charter student performance varies with the type of authorizer that granted its charter. Students whose charter schools are authorized by a state education agency earn higher scores on NAEP than students whose schools were authorized by school districts and comparable local agencies. Compared to charter schools authorized by a state education agency, student achievement is 9 percent of a standard deviation lower at charter schools authorized by local education agencies like school districts, 10 percent lower at charter schools authorized by independent statewide agencies, 15 percent lower at schools authorized by non-education entities like a mayor’s office, and 19 percent lower at charter schools authorized by higher education institutions.
These results should not be interpreted as showing a causal connection between type of authorizer and student outcomes. Still, it might be noted that state education agencies have decades of experience at overseeing educational systems, an advantage not matched by any other type of authorizer. Local school districts do not authorize as effective charters as do state offices, but they outperform agencies that have had no prior experience in the field of education. Perhaps Helen Keller was right when she said, “Only through experience of trial and suffering can the soul be strengthened . . . and success achieved.”
We also find notable differences in student achievement between schools based on their management model. These fall into three categories: freestanding or standalone schools; schools run by nonprofit charter management organizations or networks like KIPP Foundation and BASIS Charter Schools; and schools run by for-profit education management organizations, such as Academia and ACCEL Schools.
Some 55 percent of the students in our sample attend freestanding, independent charter schools—the classic charter type, led by a small team, that is one of the thousand flowers expected to bloom. Another 23 percent of students attend charters that are part of nonprofit networks or management organizations, and 22 percent of the sample are at schools run by for-profit entities.
Compared to students at for-profit and freestanding, independent charters, students at charters that are part of a nonprofit network score 11 to 16 percent of a standard deviation higher on NAEP. This may be because networked charters benefit from an association with a larger entity, or perhaps because successful charters expand beyond a single school.
For-profit schools are arguably the most controversial component of the charter sector. Charter critic Diane Ravitch has argued that “our schools will not improve if we expect them to act like private, profit-seeking enterprises,” and in 2020, the Democratic Party platform proposed a ban on charter schools run by for-profit entities (see “Ban For-Profit Charters? Campaign issue collides with Covid-era classroom reality”, feature, Winter 2021).
Why do students at for-profit schools earn relatively lower scores on NAEP than at networked charters? For-profit organizations may launch charters where circumstances are more problematic, or they may find operations more challenging when faced with heavy political criticism and threats of closure and government regulation. Or possibly the profit motive is indeed inconsistent with higher student performance, as critics have alleged.
Our main purpose in ranking states by the performance of their charter students is to focus public and policymaker attention on the provision of high-quality schools, the purpose of charter legislation from its very beginning. Our second purpose is to supplement current state-level rankings of the charter-school environment and focus attention on outcomes, not simply state policies and procedures. Although previous rankings document the variety of environments in which charter schools operate, they do not report student achievement measured by a national test common to public schools across the country.
However, the PEPG rankings are not the last word on charter-school quality. We are not able to track year-by-year trends in charter quality within states, as the number of charter student test scores for any given year are too few for precise estimation. We have no information on student performance at virtual charters, as NAEP only monitors student performance at brick-and-mortar school sites. Also, these rankings are based on assessments of student performances in 4th and 8th grade, which excludes any insights as to charter contributions to early childhood and preschool education or high school or career and technical training programs. Finally, NAEP data are observational, not experimental, so causal inferences are not warranted.
It should also be kept in mind that these data are based upon an 11-year period ending in 2019, the eve of a pandemic that closed many charter and district schools for more than a year. Student performance was dramatically affected by the event, and charter enrollment appears to have increased substantially since then. The data reported here stand as a baseline against which future measurement of charter performance in the aftermath of that event may be compared—an especially important measure given the continued growth of the sector.
Paul E. Peterson is a professor of government at Harvard University, director of its Program on Education Policy and Governance, and senior editor at Education Next. M. Danish Shakeel is professor and the director of the E. G. West Centre for Education Policy at the University of Buckingham, U.K. An unabridged version of this paper has been published by the Journal of School Choice (2023).
This article appeared in the Winter 2024 issue of Education Next. Suggested citation format:
Peterson, P.E., and Shakeel, M.D. (2024). The Nation’s Charter Report Card: First-ever state ranking of charter student performance on the National Assessment of Educational Progress. Education Next, 24(1), 24-33.