This spring and summer have produced a steady trickle of findings about how heavily the Covid-19 pandemic has impacted student learning. The results vary by locality and by what year-to-year comparisons a state or district chooses to highlight. A common pattern, however, is that gaps between lower and higher achieving students have widened.
National Assessment of Educational Progress results set for release on September 1 will provide the first nationwide evidence on student academic progress from directly before the pandemic to now. We do not yet know if these results will show this same gap-widening trend. If they do, however, it will be essential for those interpreting and responding to the news to understand some crucial context: the gap between low- and high-achievers was already widening in the decade leading up to the pandemic.
Only NAEP collects and reports nationally representative data on what students know and can do, offering achievement data comparable across the 50 states, the District of Columbia, Puerto Rico, and Department of Defense school systems, as well as 26 urban districts. The NAEP Long-Term Trend (LTT) assessments, which will be released for 9-year-olds next week, evaluate student progress on basic skills in reading and in mathematics since the 1970s. What is termed “main” NAEP shows trends since the 1990s for grades 4 and 8. Main NAEP results for 2022 will come out later this fall and make it possible to compare achievement to 2019 nationwide and state by state.
The pandemic hit just as the 2020 LTT administration to 9-year-olds ended. The National Assessment Governing Board, which sets the NAEP assessment schedule, and the National Center for Education Statistics, which administers NAEP, saw an advantage in assessing 9-year-olds again as soon as NAEP could re-enter classrooms—winter 2022. (See, “Nation’s Report Card to Shine Spotlight on Pandemic-Related Learning Loss,” From the Editor, Winter 2022.) Thus, the special LTT release this summer will focus only on 2020-22 results for age 9, showing how scores differ among 9-year-olds pre-pandemic and 9-year-olds in the Covid era.
These results may strike some people, instinctively, as a definitive declaration of the work required for the education sector to regain lost ground. This interpretation oversimplifies the real work needed. A narrow focus on recovering from Covid-related setbacks to learning ignores the complete picture of student achievement in the decade leading up to the pandemic.
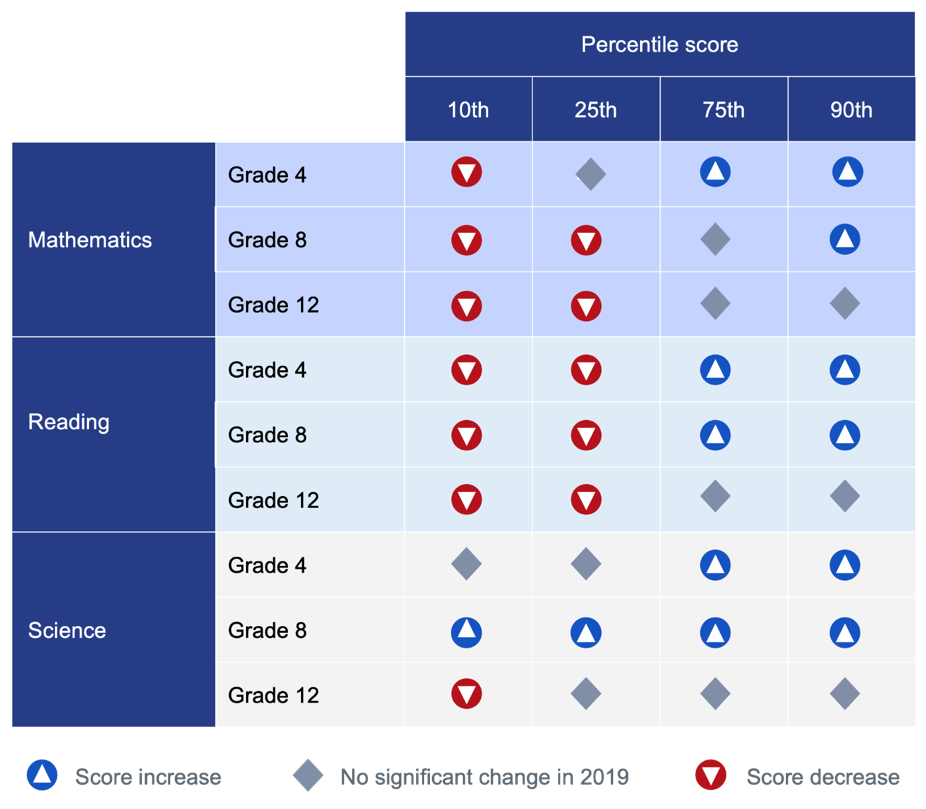
From 2009 to 2019, before Covid-19 disrupted students’ learning experiences, NAEP mathematics and reading scores for students performing at the 25th percentile or lower across grades (4, 8, and 12) declined, while students scoring at the 75th percentile or higher improved or held steady. The magnitude of the score declines among lower-scoring students varied across subjects and grades, but they were enough to set scores back to where they had been a decade or more. The recent score declines for lower-performing 8th- and 12th-graders in mathematics resulted in scores that are now comparable to those from 2005. The recent reading scores for lower-performing 4th- and 8th-graders were also comparable to around 2005, but lower-performers at grade 12 scored the lowest ever (since 1992).
Scores in the tails of the distributions also drove the average score gains and losses registered by specific jurisdictions during a period when average scores nationally were mostly flat. All four jurisdictions that increased average scores in grades 4 and 8 mathematics and reading—California, the District of Columbia, Department of Defense Education Activity schools, and Mississippi—made improvements among higher-performers. The five jurisdictions with average score declines in the four assessments—Alaska, Kansas, Montana, North Dakota, and Vermont—saw large decreases in scores for their lower-performers.
Who are the lower-performing students? Given the conversations around achievement gaps and struggling students, it is all too easy to assume that most are minority students, English language learners, or socio-economically disadvantaged. NAEP data suggest that assumption is flawed.
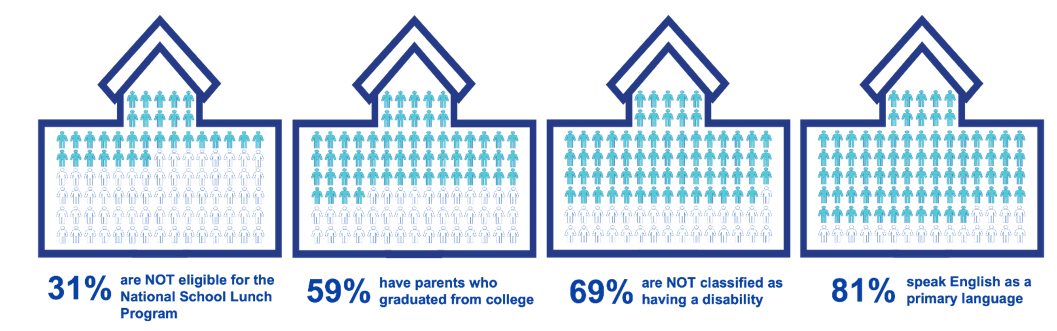
Analyzing who comprises the lower-performing student group reveals diversity that defies expectations. For example, a third of the students scoring below the 25th-percentile in grade 8 reading are white. Hispanic students make up slightly more than a third of the student group and Black students comprise a fourth. The lower-performing student group also includes Asian/Pacific Islanders, Native Americans, and students of two or more races. Furthermore:
- 31% are not eligible for the National School Lunch Program.
- 59% have parents who graduated from college.
- 69% are not classified as having a disability.
- 81% speak English as a primary language
NAEP results tell us what has happened to student progress but cannot on their own explain why. Those on the ground who know the curricula, instructional approaches, and policies can and should parse potential explanations for the divergent trendlines between lower and higher performers between 2009 and 2019.
Understanding these data represents a crucial first step to understanding what the NAEP results that will be released in 2022 will reveal. Given results on state assessments, NAEP 2022 results may show steep declines across subjects and in all grades. Or perhaps the results will be less dramatic than worst fears indicate, reflecting students’ resilience and schools’ innovative approaches to instruction amid the pandemic. Either way, it is essential that we recognize that the status quo before Covid was not working for all students.
Ebony Walton is a statistician at the National Center for Education Statistics. Laura LoGerfo is assistant director for reporting and analysis at the National Assessment Governing Board.