New results from the National Assessment of Educational Progress released on June 10 have offered what may initially appear to be a glimmer of sunshine on an otherwise gloomy landscape of U.S. education. Scores of 9-year-olds tested in 2025 as part of NAEP’s Long-Term Trend assessment ticked upwards from 2022 levels in both reading and math. In reading, the gains were large enough to bring scores back to the level observed just prior to the Covid-19 pandemic in 2020.
Yet any enthusiasm with which observers may welcome the latest results must be tempered. Historically, the slightest uptick in scores has been interpreted as a harbinger of long-term educational improvement. As such, it might be tempting to downplay the fact that scores of 13-year-olds, the other age group tested in 2025, were flat compared with 2023 and remain well below pre-pandemic levels.
Critically, a narrow focus on whether students are achieving at pre-pandemic levels obscures the fact that the recent declines in education outcomes among American students began in 2013—well before the pandemic disrupted schooling—and have generally persisted since. That reality complicates the process of calculating the pandemic’s true impact. More importantly, it changes the perspective on remedial policies.
Over the past half century, average student performance has stagnated, and large socioeconomic disparities have continued despite significantly increased resources for schools and a series of reforms, including new instructional programs, attempts to hold schools accountable for their performance, and a push for nationwide standards that came and went. In light of this larger picture, today’s policymakers and educators need to look beyond policies aimed at short-run remediation and consider more fundamental change.
Student Achievement in the 21st Century
Both common sense and complex research tell us that the skills and knowledge acquired through education directly affect the functioning of our democracy, the economic outcomes of individuals, and the power and prestige of the nation. Student scores on tests of academic achievement, such as NAEP, thus offer a preview of what’s to come. Average scores on such tests presage the future skills of the nation’s labor force, while the distribution of scores across student subgroups offers a preview of disparities in outcomes that may require government intervention. The long-term pattern of national-assessment scores can also help us gauge how efforts to improve education outcomes are working.
The Covid-19 pandemic had a far greater impact on our education system than any single event during the postwar period. States and school districts have rightly pursued a range of strategies aimed at remediating the harm to students in the Covid cohort and at preventing economic declines from a fall in their skills. Assessing the impact of these efforts, however, requires placing pandemic-era learning losses in the context of trends in student outcomes over a longer timeframe.
A crude way to judge the impact of the pandemic is to assume that a given cohort—say, the 8th graders in school during the pandemic—would have achieved what those in the same grade before the pandemic would have achieved. But assessing the education system’s performance more comprehensively requires also looking at patterns before and after the pandemic. The Main NAEP testing program conducts regular assessments of reading and math for state-representative samples of 4th and 8th graders. NAEP testing from 2003 to 2024 then provides this wider lens on performance not only for the nation, but also for each of the states.
Declining Average Achievement
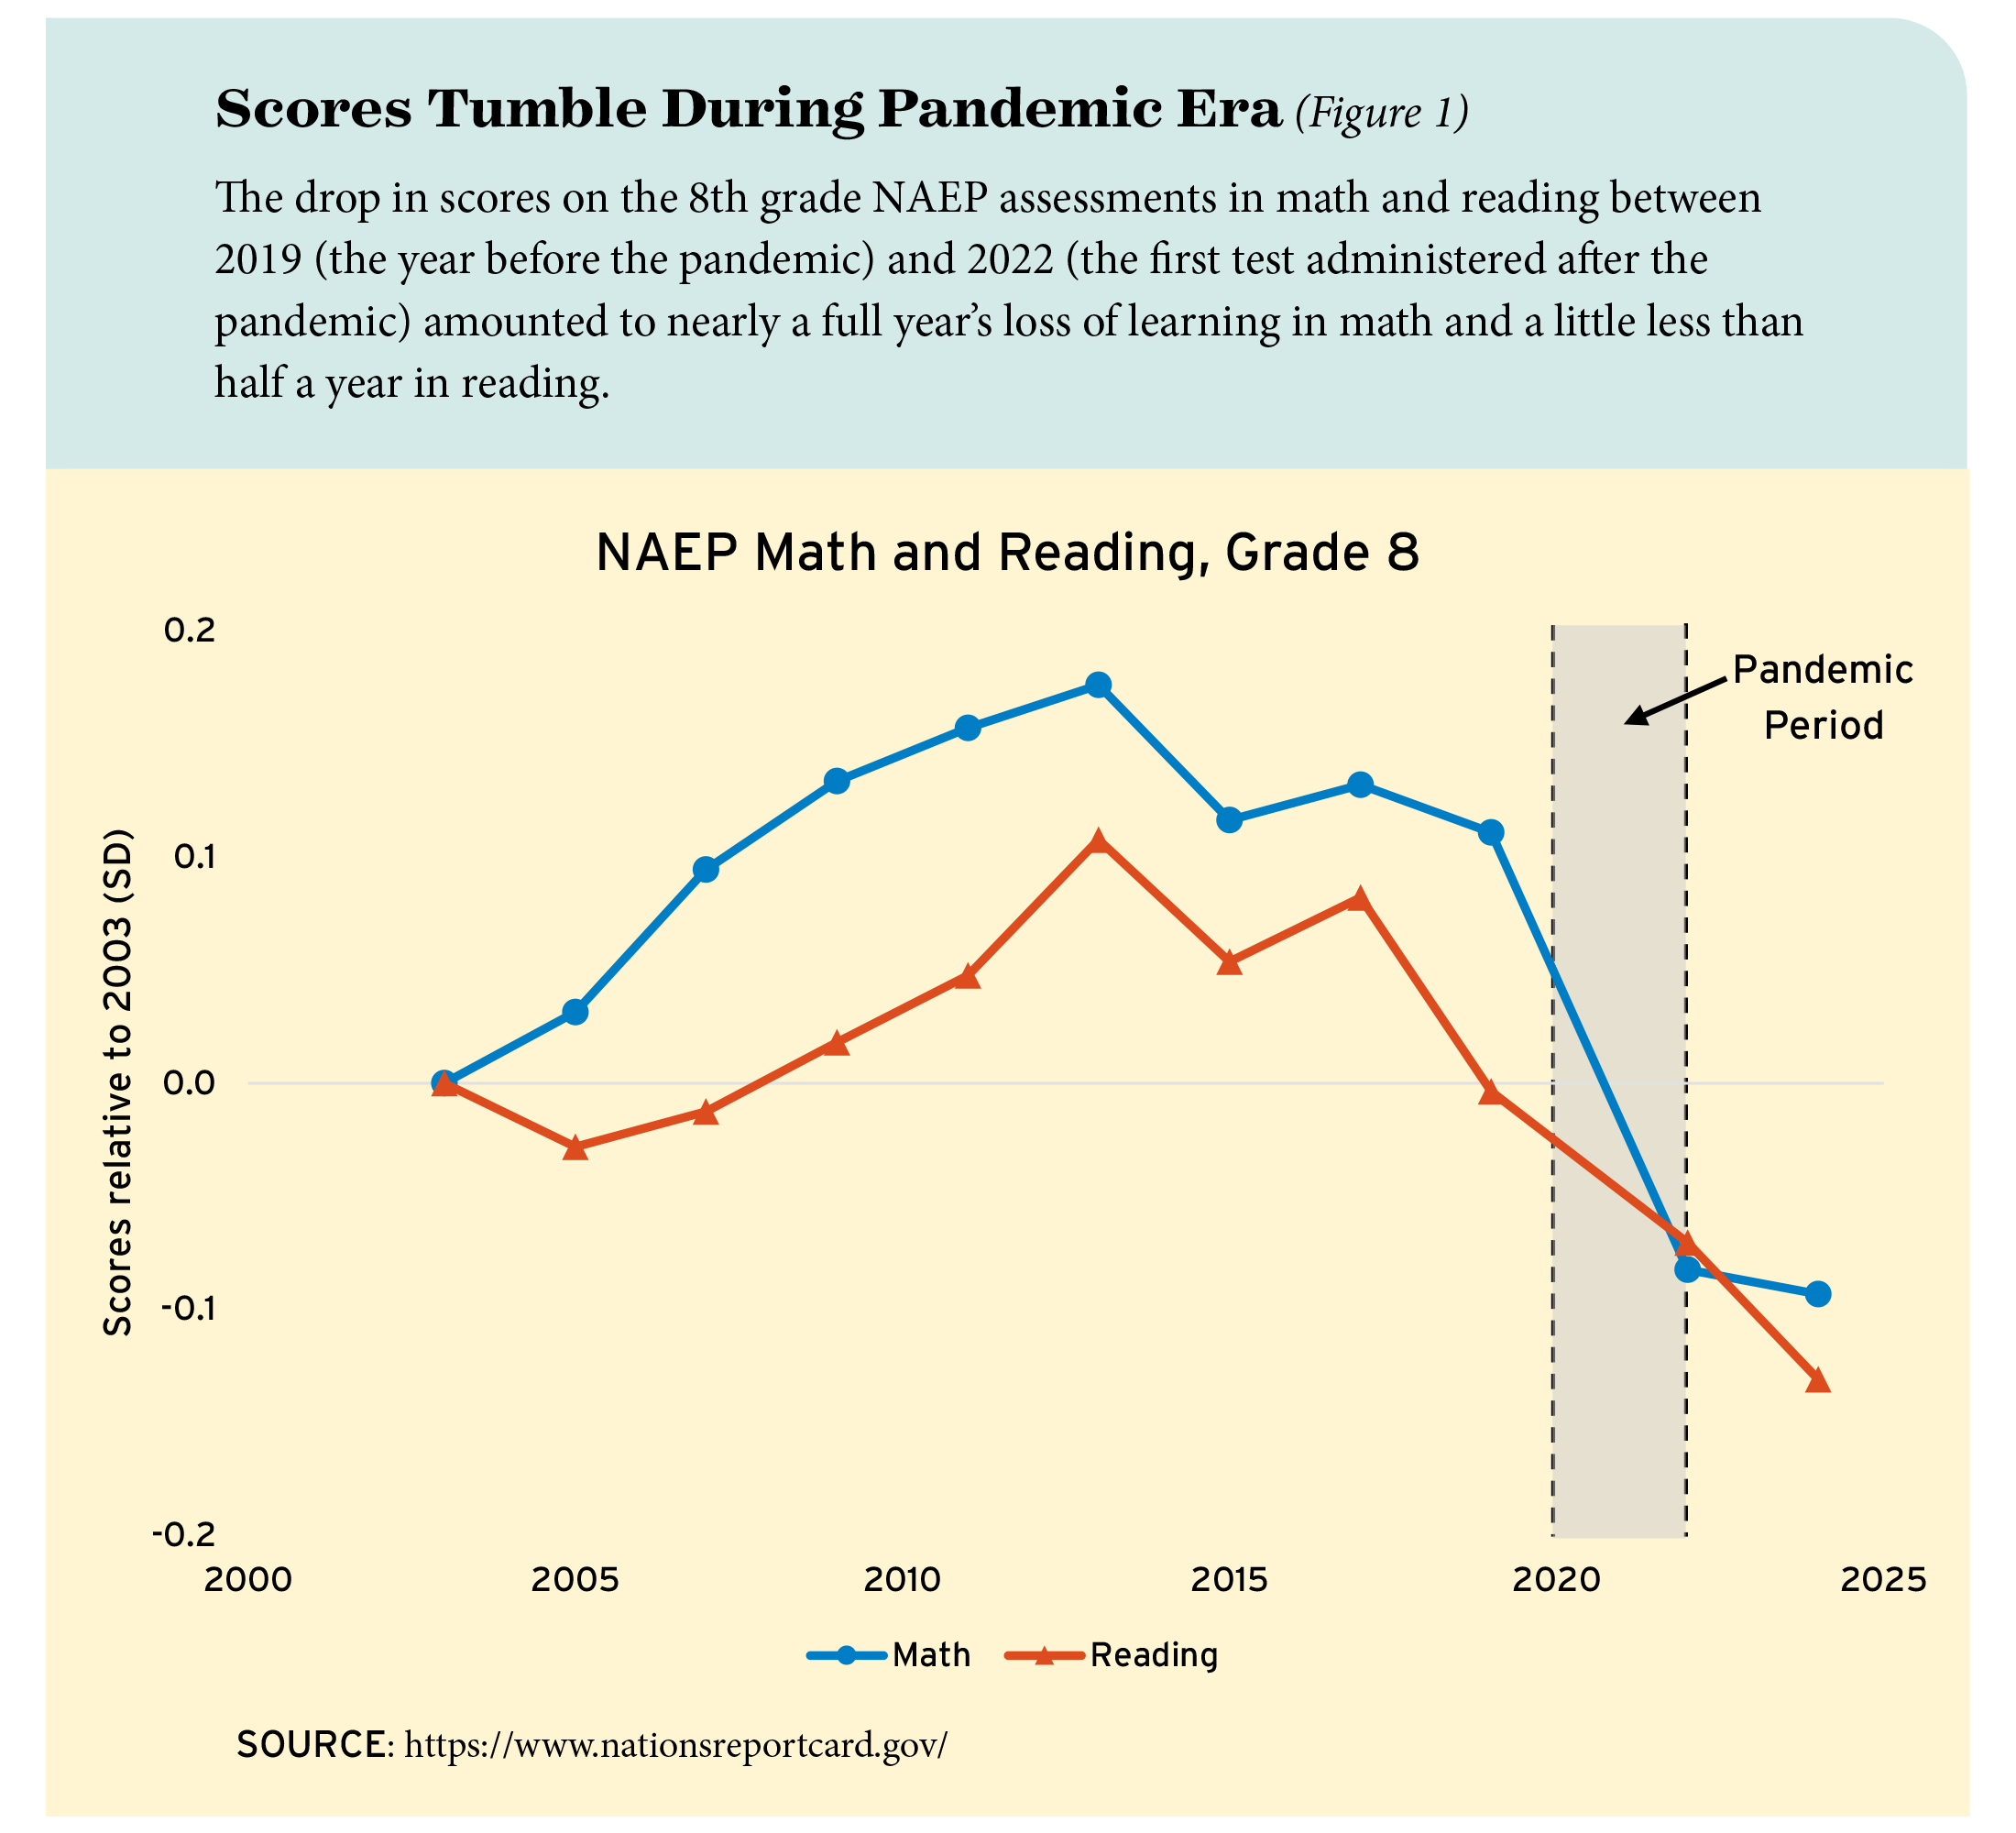
The 2019 and 2022 NAEP assessments bracketed the pandemic era, and the national average scores for 8th graders show sharp drops over this time period: by 0.21 standard deviations in math and 0.07 standard deviations in reading (see Figure 1). These declines amount to nearly a full year’s worth of typical learning in math and a bit less than half a year in reading.
These three-year changes, however, are likely to be poor estimates of the pandemic’s true impact. Scores had been trending downward in both reading and math since 2013, with the steepest declines in reading. These trends suggest that part of the drop in scores during the pandemic period might well have occurred even without the disruption.
When we look at the post-pandemic period from 2022 to 2024, we see that the hoped-for recovery did not materialize. The federal government directed $190 billion toward K–12 public education, most of which went directly to schools. But as funds and programs were deployed to address pandemic learning losses, 8th-grade scores did not rise or even hold steady; they declined further. This continuing decay was particularly substantial in reading.
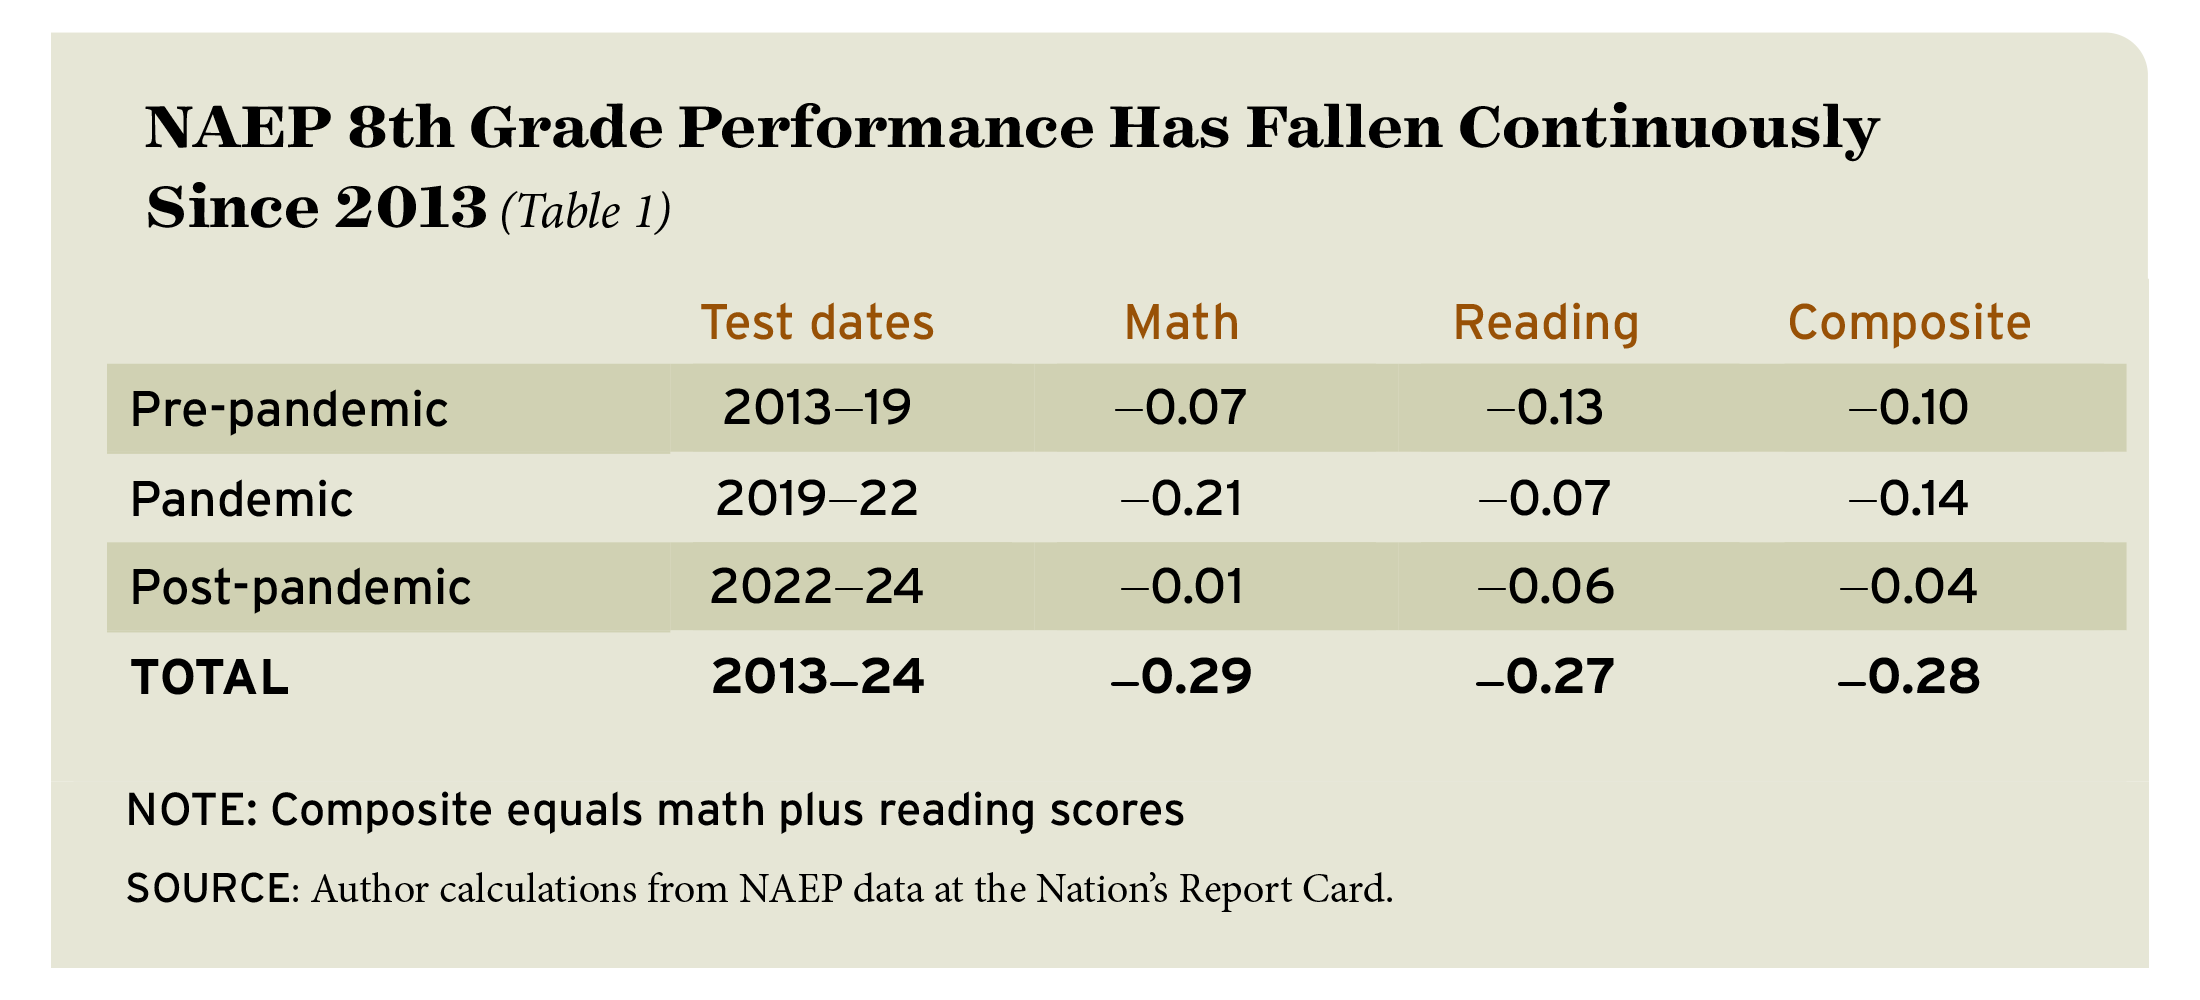
While 72 percent of the total decline in grade 8 math performance since 2013 occurred during the pandemic period between 2019 and 2022, only a quarter of reading decline happened in this window (see Table 1). In fact, the reading decline over the post-pandemic period is almost as large as the falloff that occurred during the pandemic years.
The pattern of NAEP scores for grade 4 echoes that for grade 8. Scores peaked in 2013, fell notably prior to 2019, and continued to decline through the pandemic and post-pandemic periods. The relative drop in scores during the pandemic was larger in math than in reading, where the pre- and post-pandemic losses account for a greater share of the overall decline since 2013.
The Falling Bottom
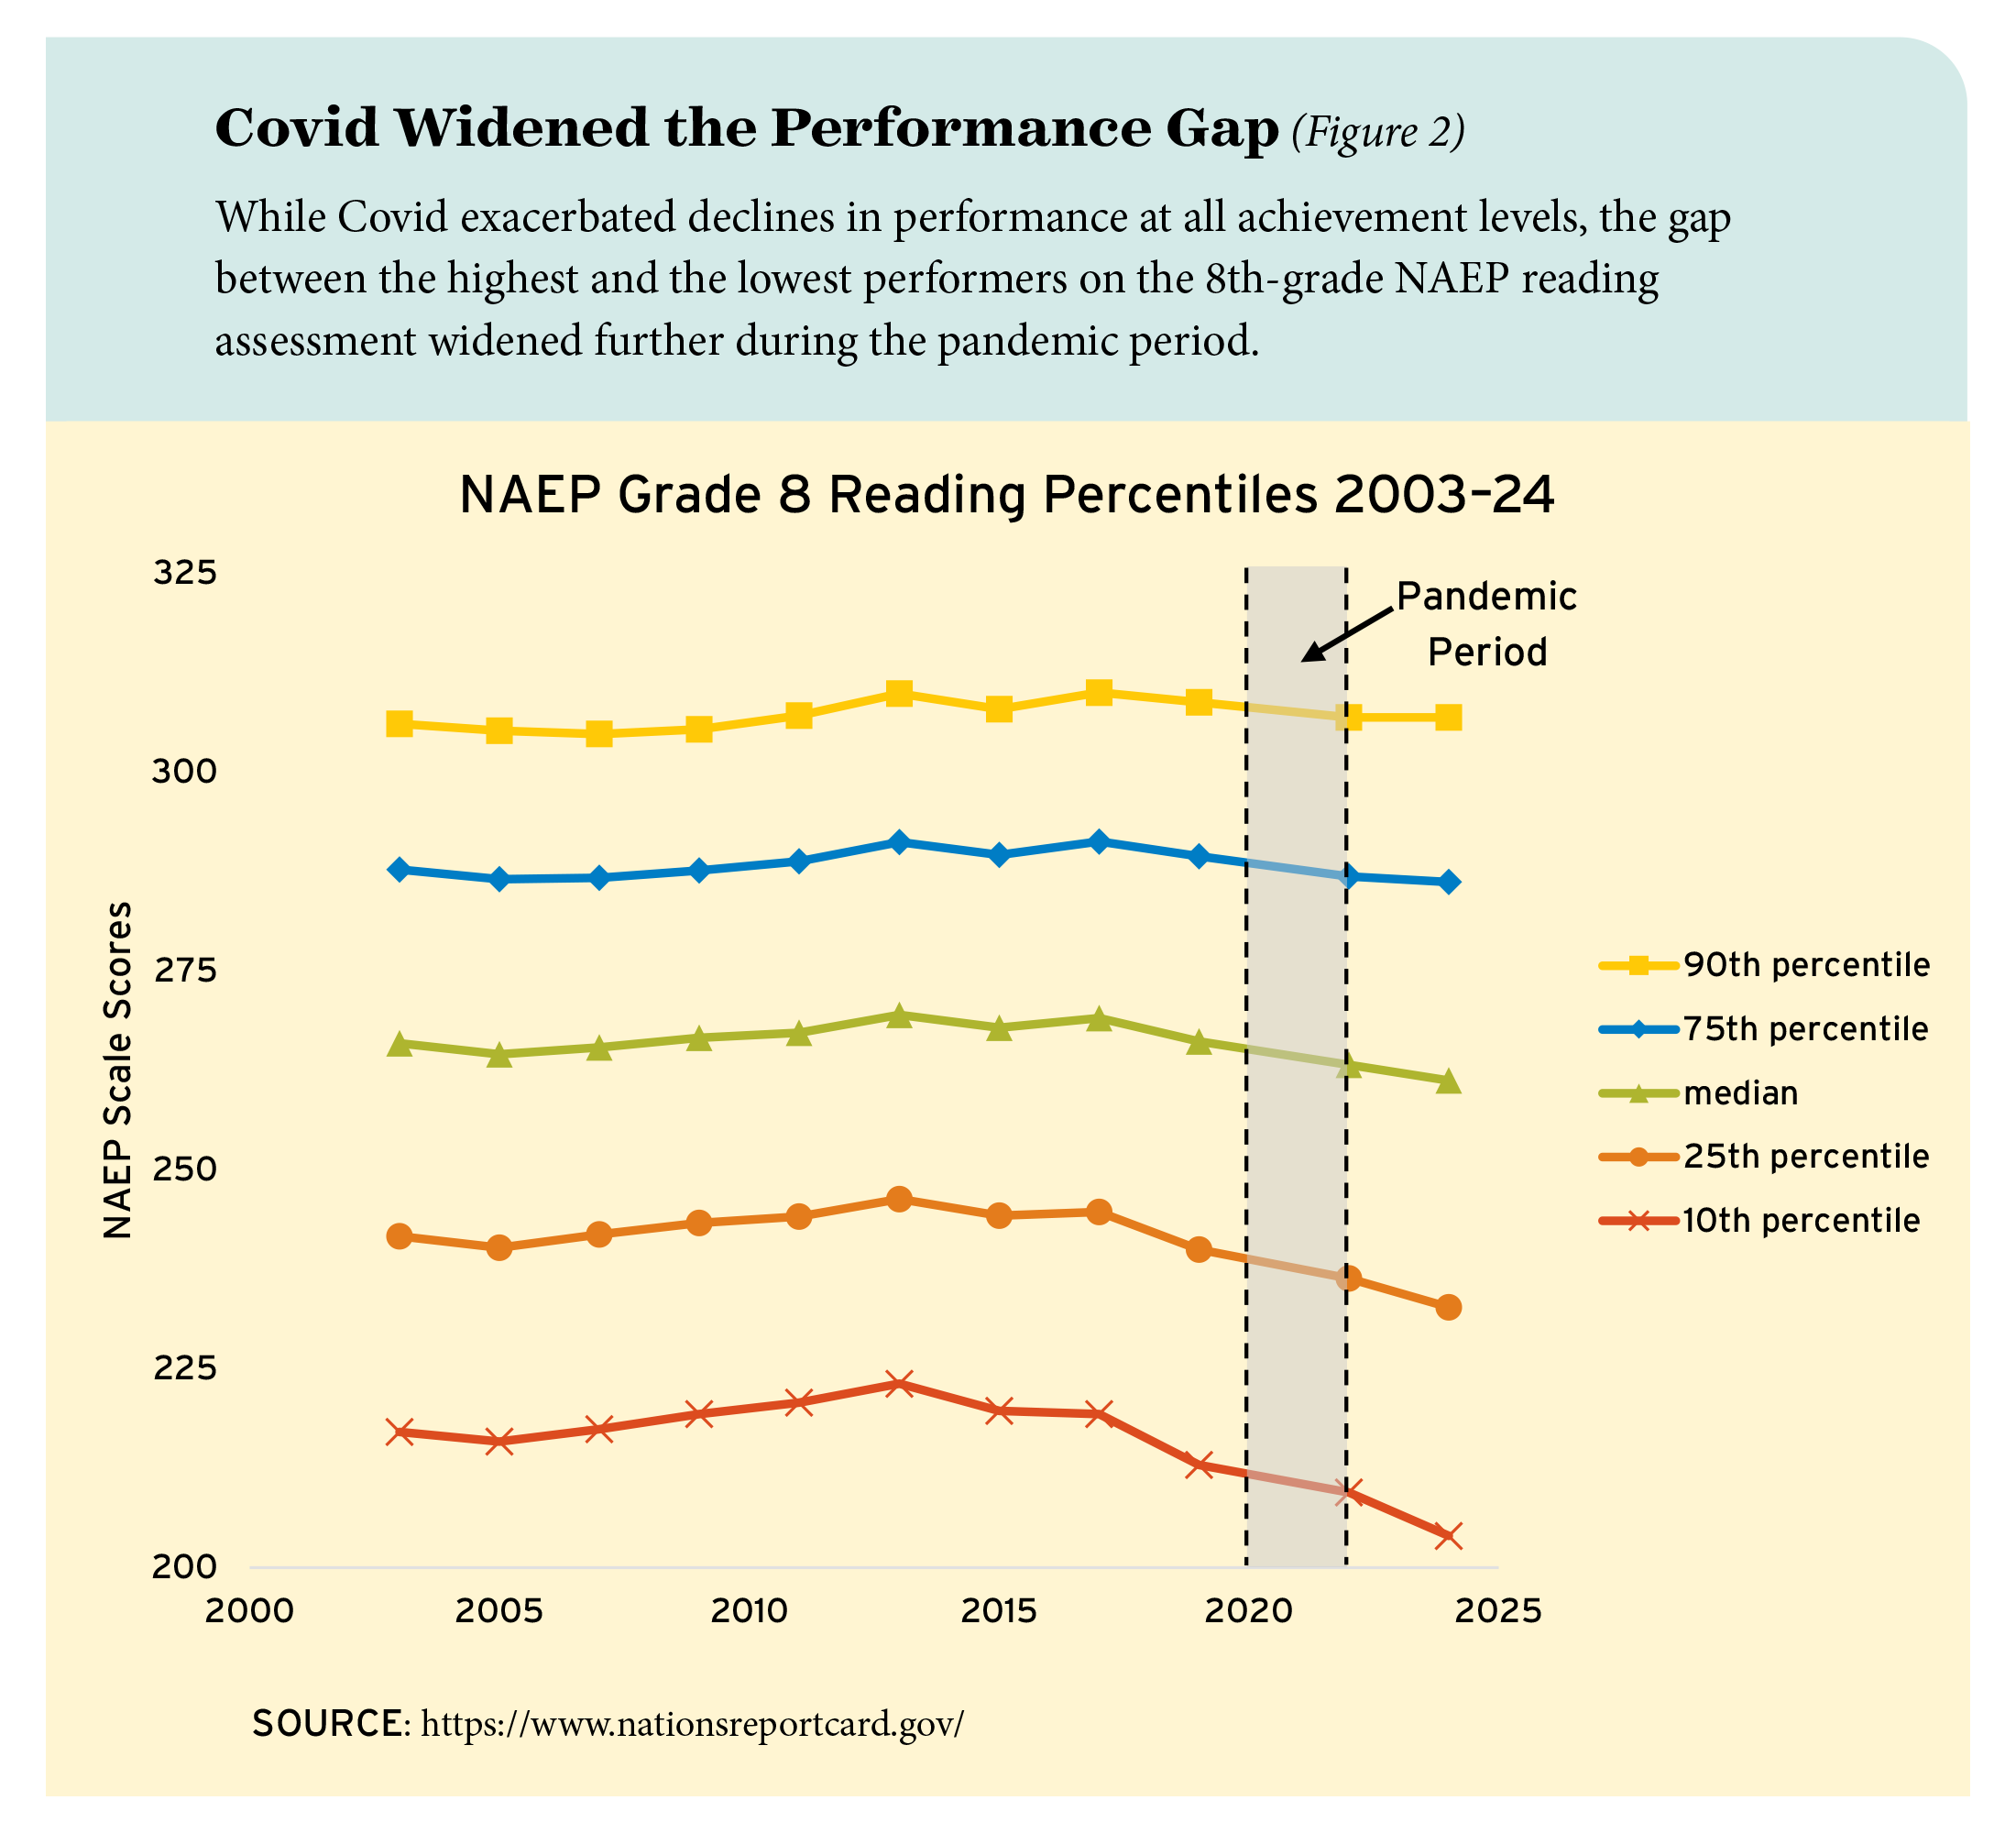
At the same time average achievement was falling after 2013, the gap between high-achieving and low-achieving students widened. As seen in Figure 2, reading scores of 8th-grade students at the 10th percentile—near the bottom of the test-score distribution—fell compared to those at the top, widening the performance gap and suggesting significant deterioration of the future economic prospects of the most disadvantaged students. Scores fell for high and low achievers alike during the pandemic period, but the losses were again largest for those at the bottom. This phenomenon is evident across all grades and subjects assessed by NAEP. For both math and reading in grades 4 and 8, scores were more widely dispersed in 2024 than in any prior year of NAEP testing.
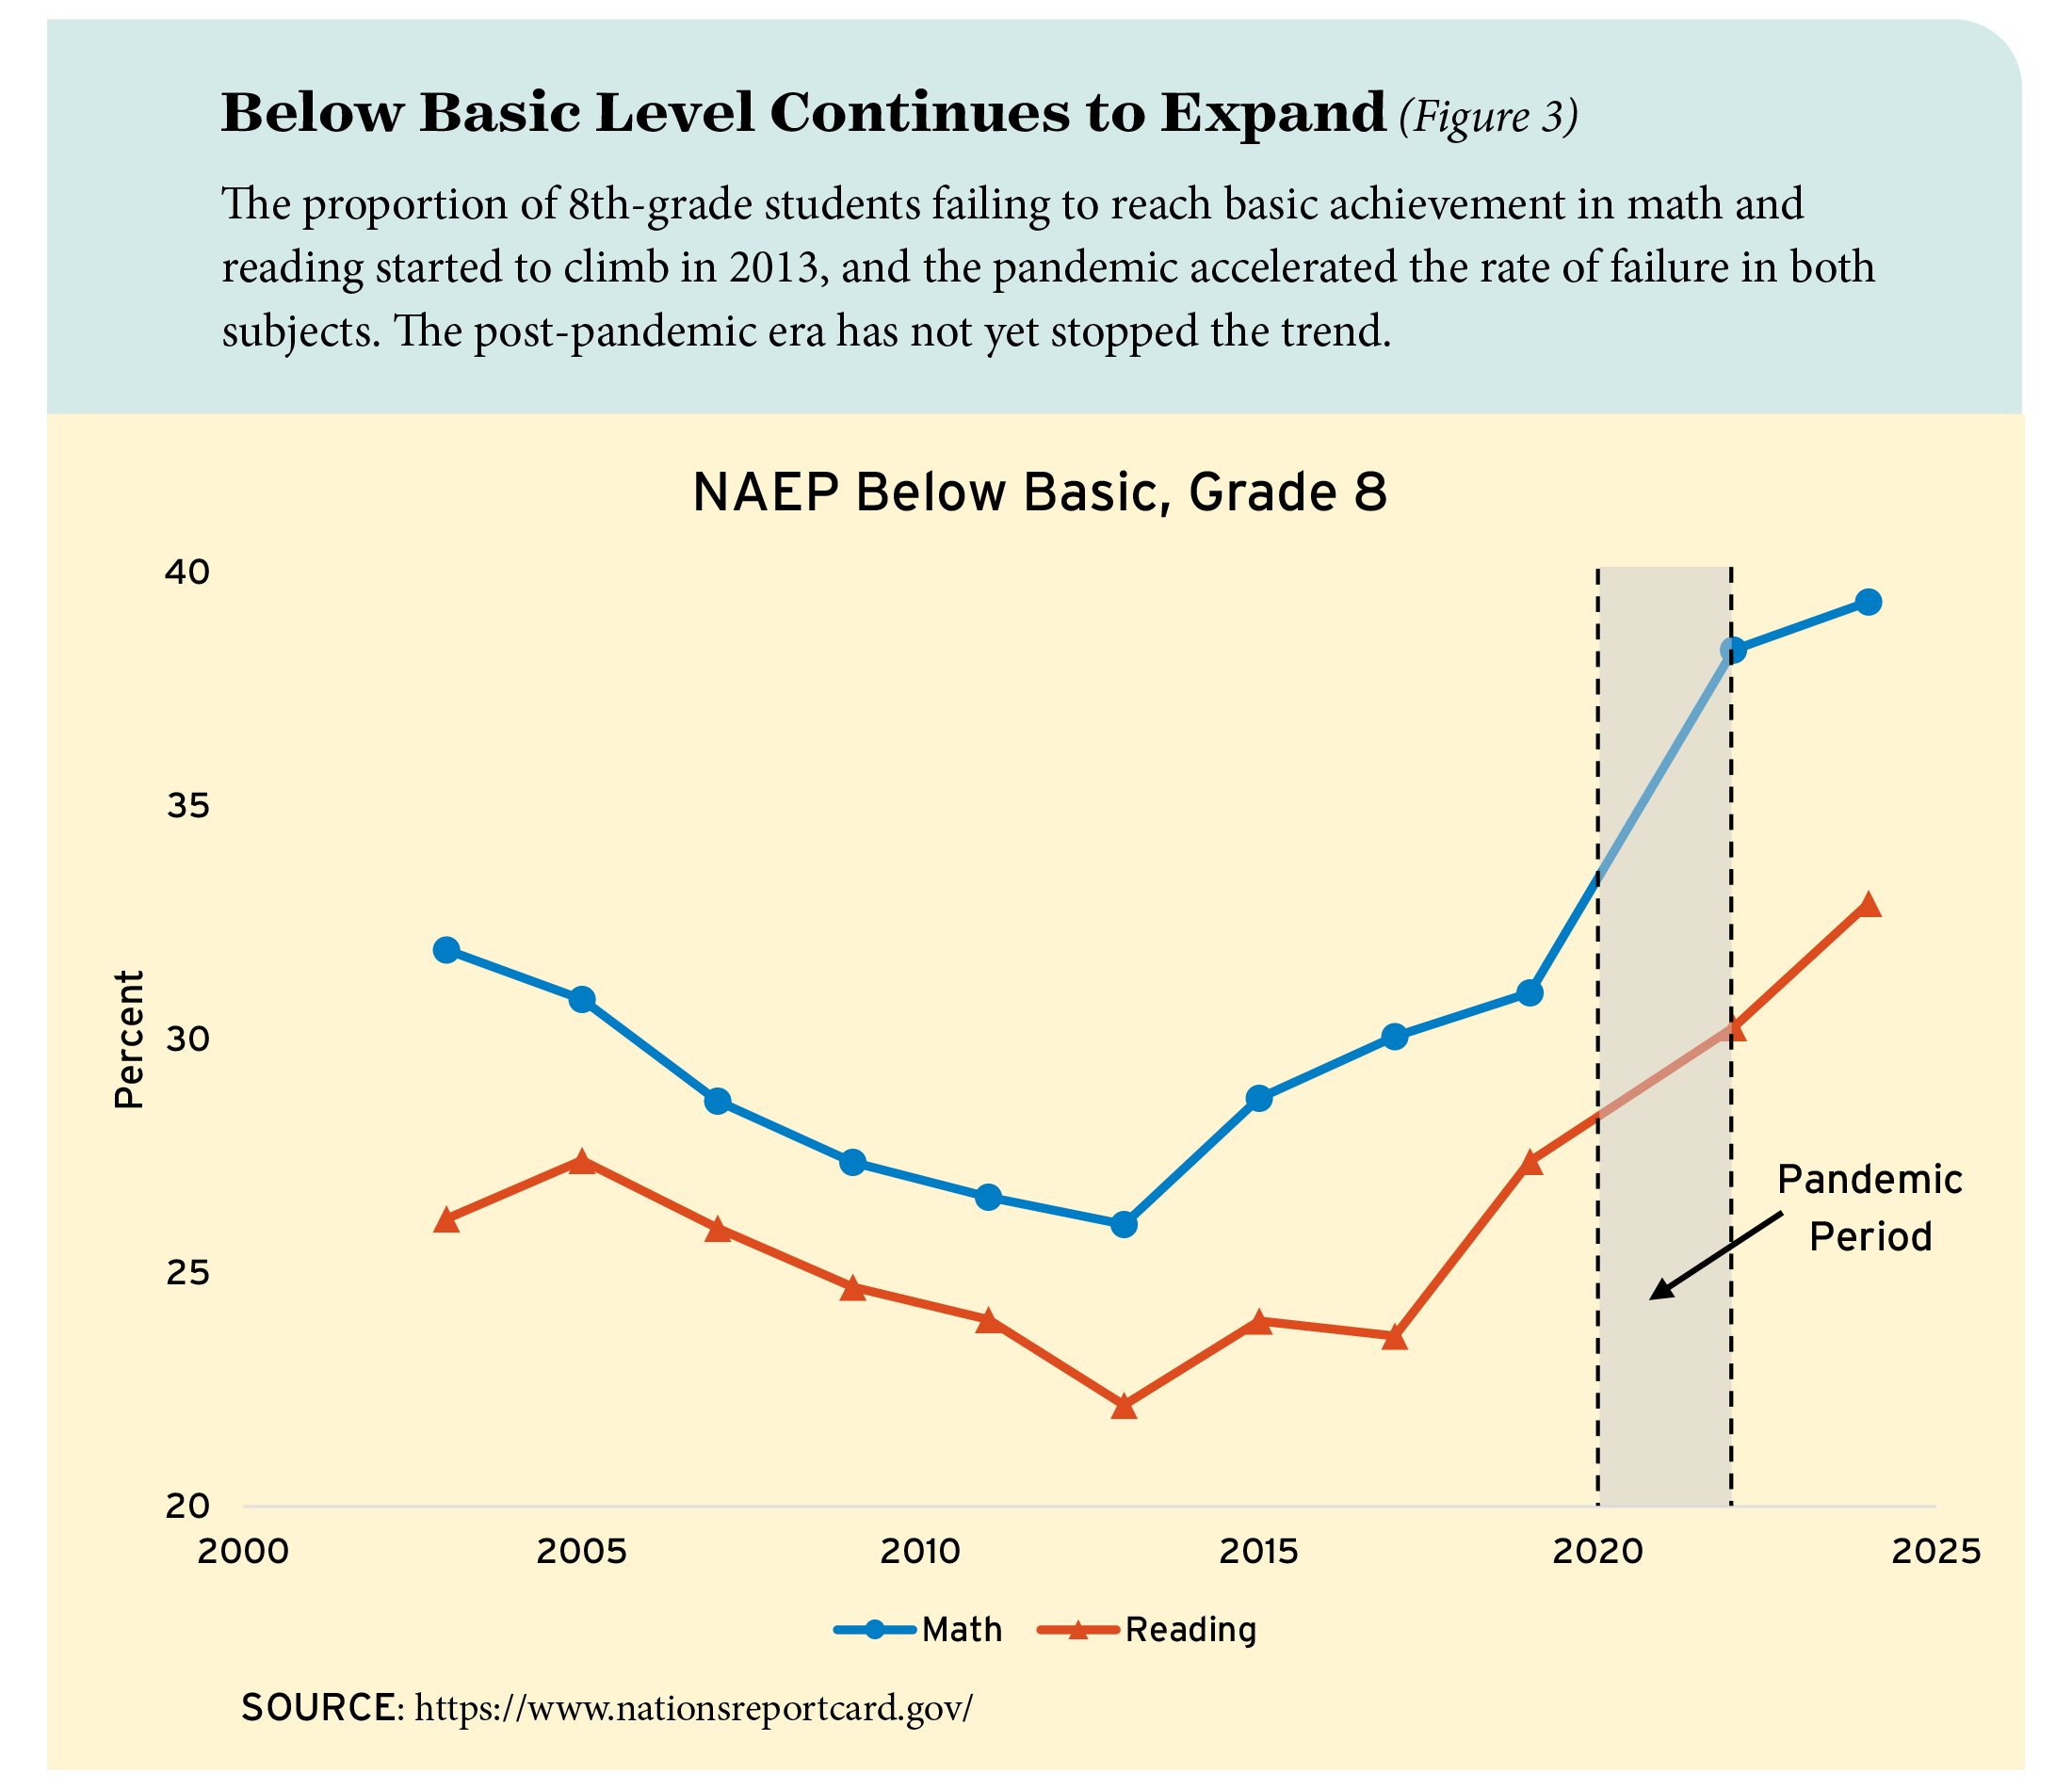
Student achievement on NAEP is rated against expectations for each grade, with cutoffs established for basic, proficient, and advanced performance levels. Therefore, another way to gauge the progress or regress of low-performing students is to plot the share of test-takers unable to reach the basic, or lowest, performance level. In reading for grade 8, a student at the basic level should demonstrate a literal understanding of what they read and be able to make some interpretations. In math for grade 8, students at the basic level can demonstrate understanding of basic math concepts and apply them in simple situations. These performance levels represent the minimum skills students will commonly need to participate fully in an information-based economy.
The percentage of 8th-grade students failing to reach the basic level of math and reading performance jumped sharply during the pandemic (see Figure 3). But again, the deterioration of skills during the pandemic followed a substantial decline that commenced in 2013 and continued after 2022.
Evidence from Other Tests
These longstanding achievement declines are not an artifact of the grade-based Main NAEP testing program. They appear consistently across other assessments that permit comparisons of representative samples of U.S. students over time.
An alternate version of NAEP called Long-Term Trend, or LTT, has assessed math and reading scores for the nation since the 1970s. While the assessment framework of the Main NAEP has been adjusted over time to match curricular changes, LTT NAEP has kept the same content, thus providing a different perspective on comparisons over time. The same pattern of declining performance on the Main NAEP laid out above is repeated for both the 9- and 13-year-olds who participate in LTT: Scores for both age groups reached their highest level in 2012 and then declined through 2022, with only 9-year-olds noted as showing modest signs of recovery in 2025.
U.S. scores on the Trends in International Mathematics and Science Study, or TIMSS, follow the same pattern. TIMSS is an international assessment designed to compare performance across countries but, in doing so, it yields data for a representative sample of U.S. students. TIMSS has provided results for math and science at grades 4 and 8 roughly every four years since 1995.
The TIMSS scores of U.S. students in both grades fell significantly between 2019 and 2024. But these declines, too, began earlier. In grade 8, math scores peaked in 2015 and science scores in 2011. Grade 4 math peaked in 2011 and grade 4 science in 2015.
U.S. scores on the Programme for International Student Assessment, or PISA, have followed a slightly different pattern. PISA is also designed for international comparisons, in this case testing representative samples of 15-year-olds in math, reading, and science. Testing has followed a three-year cycle since 2000, with the 2021 test delayed until 2022 because of the pandemic. Scores in each of the tested subjects fell between 2018 and 2022, but this pandemic-era drop-off was smaller than the NAEP decline. Scores on the math assessment peaked in 2009, while reading and science scores peaked in 2018.
State-by-State Achievement Patterns
The clear national pattern of declining achievement over the first quarter of the 21st century masks substantial variation among the states. This variation reflects not only changes in school quality but also demographic shifts, which can be particularly influential at the state level, and other societal influences on student learning. Nonetheless, the burden of ameliorating the declines in learning falls squarely on each state’s schools, not only because of the states’ constitutional responsibility for schooling but also because government policy has its greatest potential leverage on student achievement through schools.
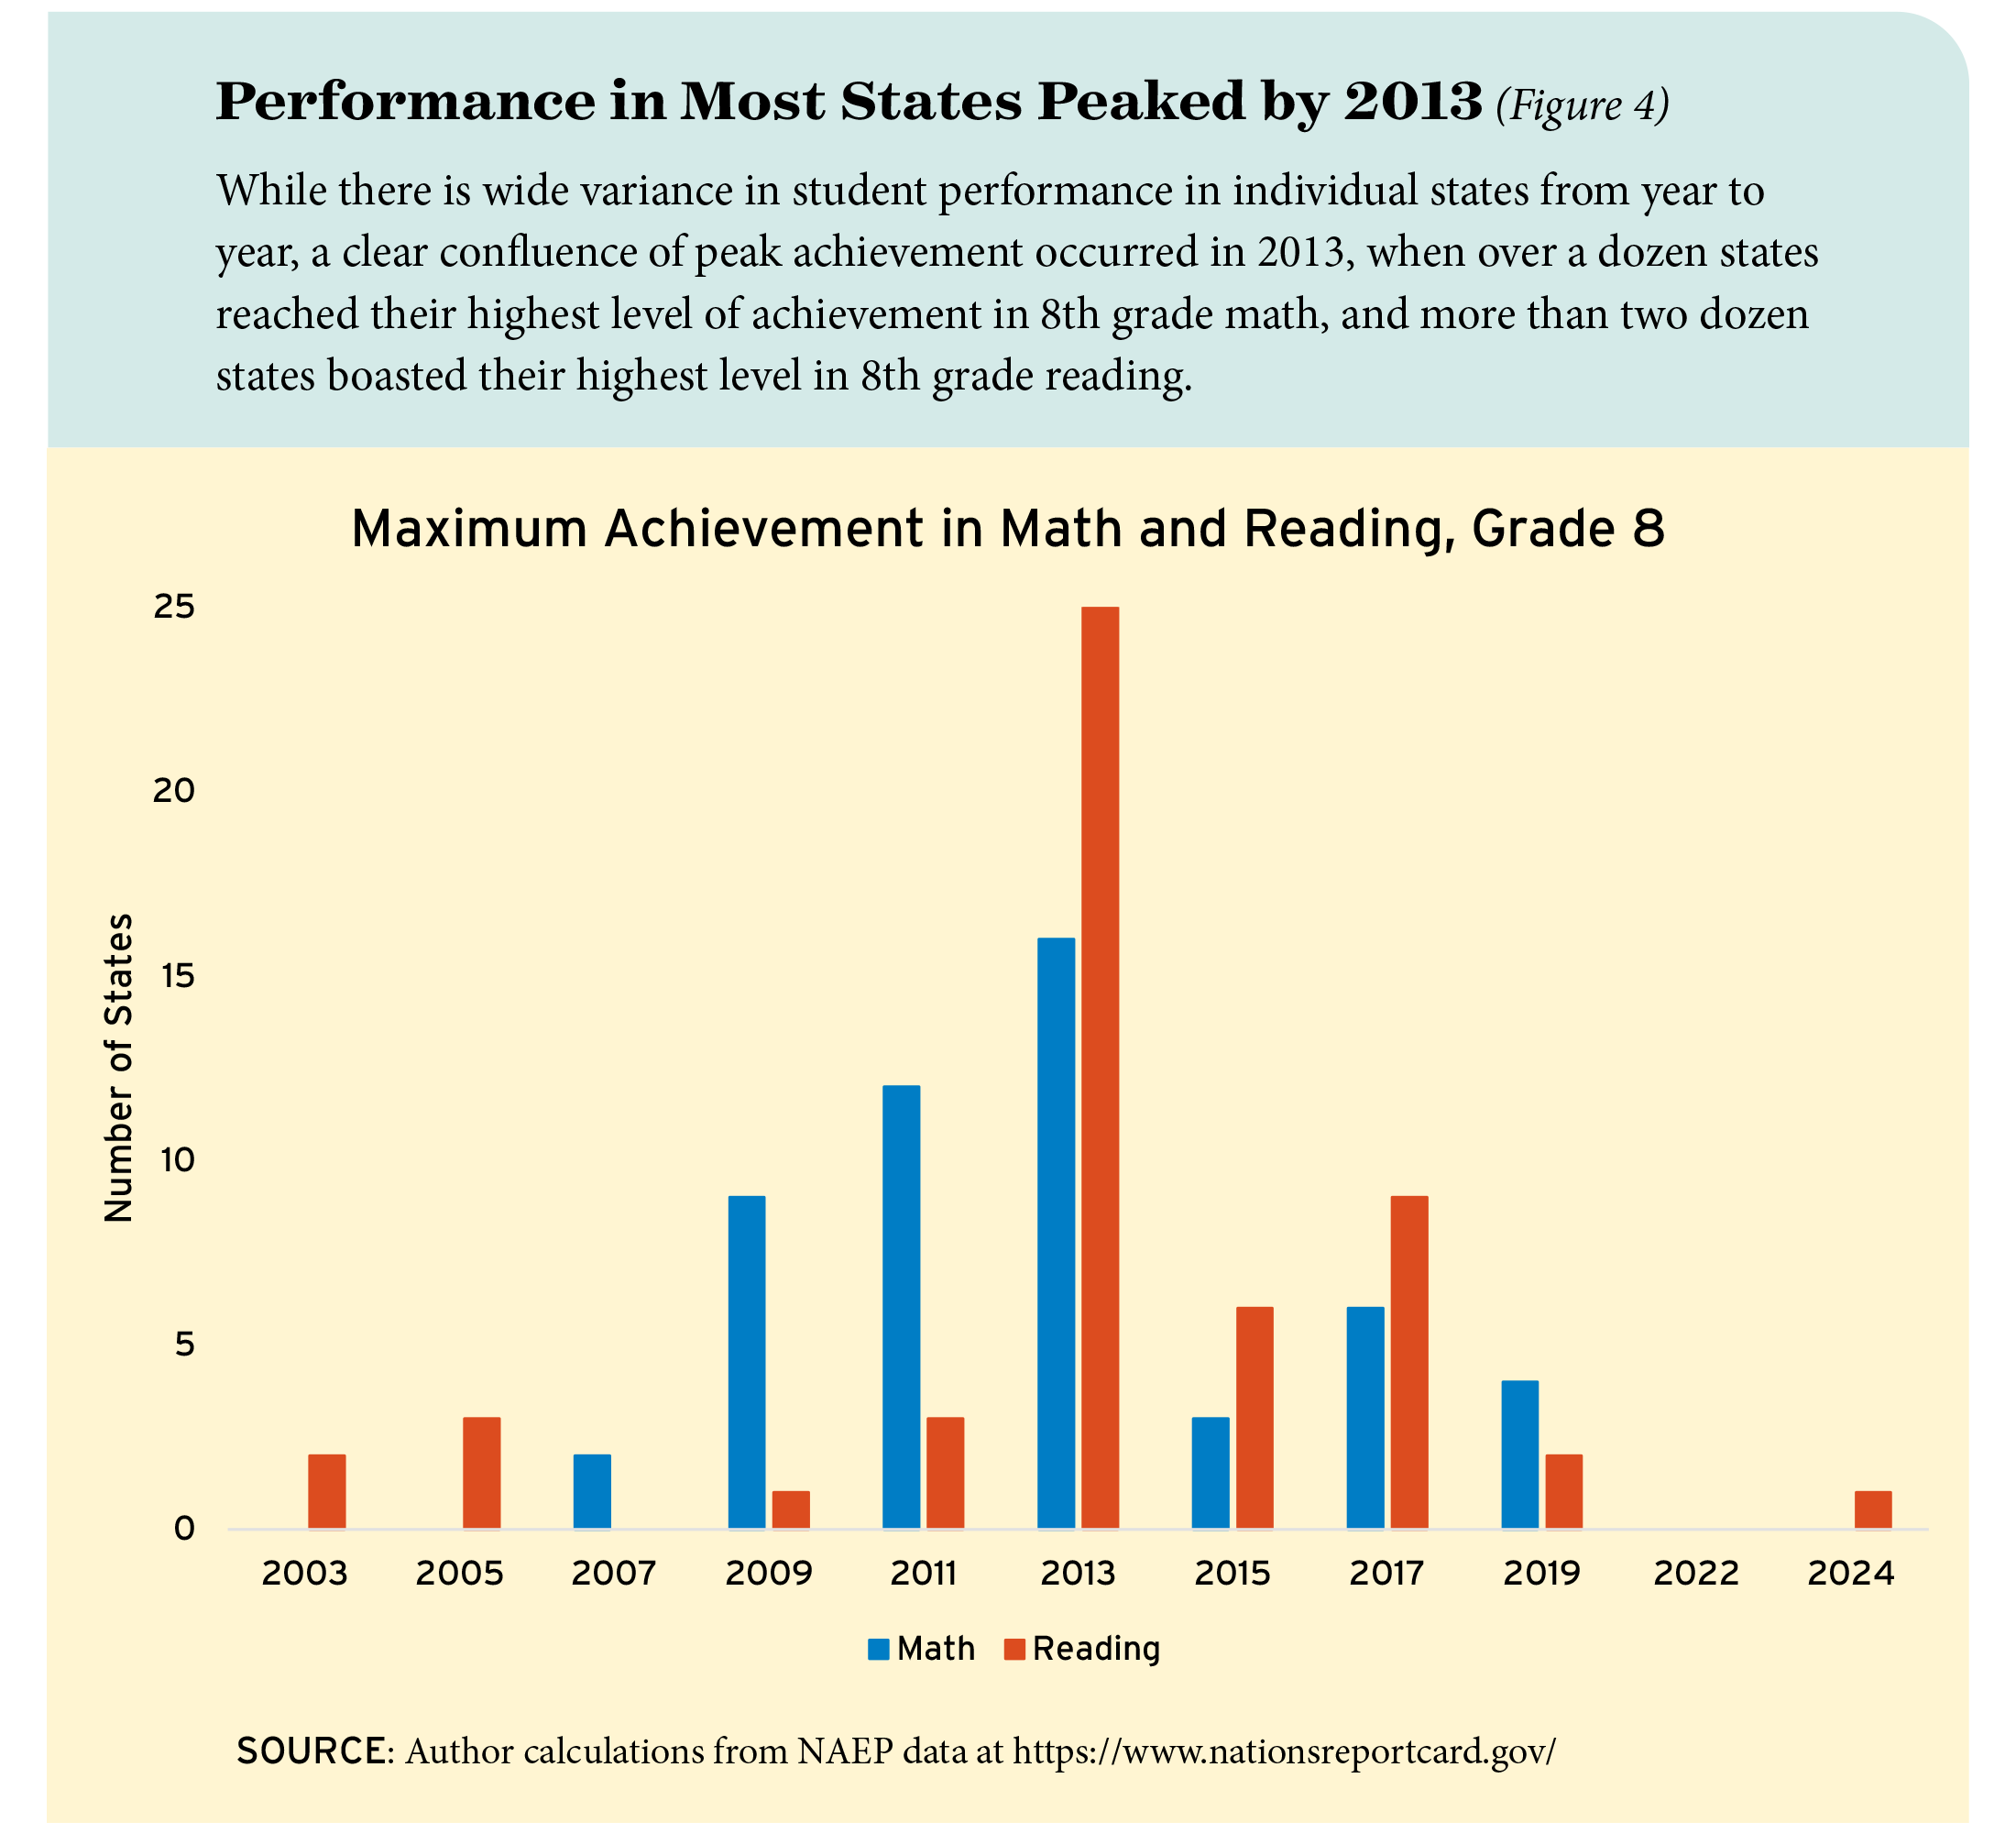
On NAEP, 23 states had already reached their highest level of grade 8 math achievement by 2011, and an additional 16 states did so by 2013 (see Figure 4). Similarly, in grade 8 reading, 9 states had reached peak achievement by 2011, while 25 more states peaked by 2013. Only four states in math and three states in reading were at their highest observed level when they headed into the pandemic.
And where does performance currently stand across the past quarter century? As of the 2024 NAEP tests, grade 8 performance in both math and reading was higher than it was at the beginning of this century in just four states: California, District of Columbia, Hawaii, and Mississippi.
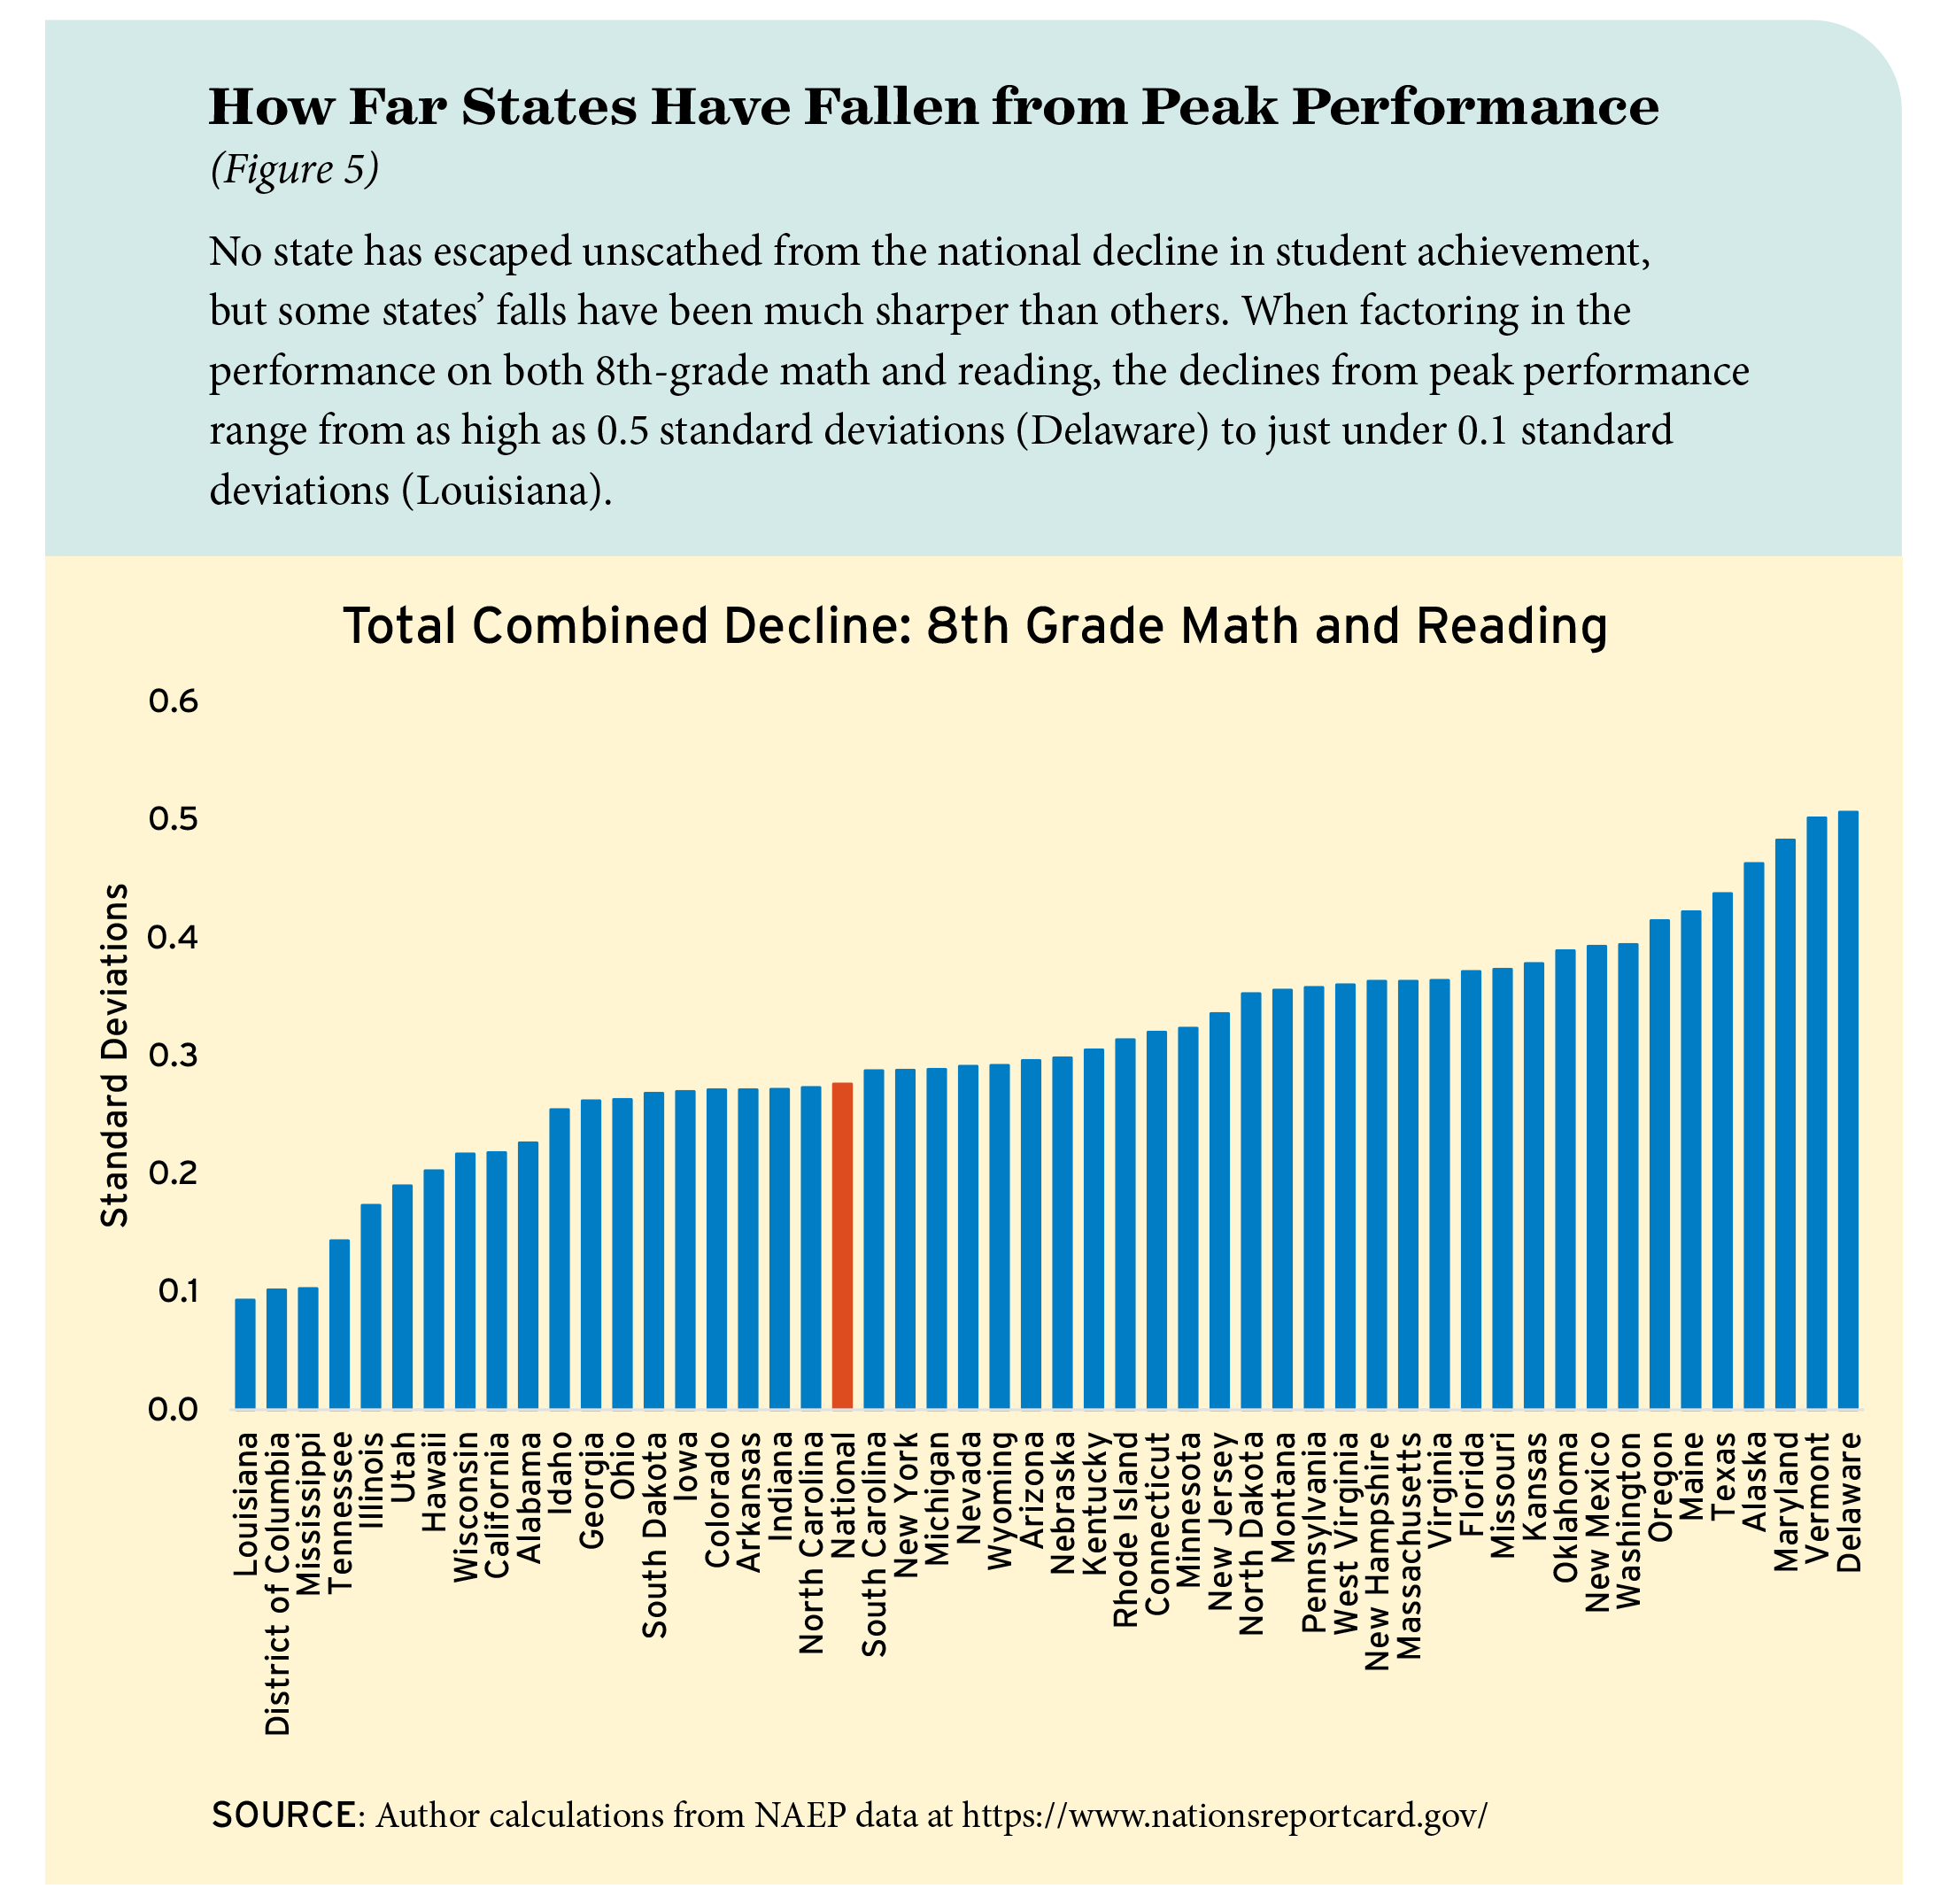
The variation in states’ performance patterns is best illustrated by the amount of decline in student achievement from each state’s peak. The median math decline across states is more than one-third of a standard deviation, but the declines range from 0.11 standard deviations in Tennessee to 0.56 standard deviations in Texas. For reading, the range extends from 0 in the District of Columbia, where performance peaked in 2024, to 0.48 standard deviations in Vermont. Figure 5 shows the change in combined math and reading performance by state. For just three states—Louisiana, District of Columbia, and Mississippi—are declines only as low as 0.1 standard deviations.
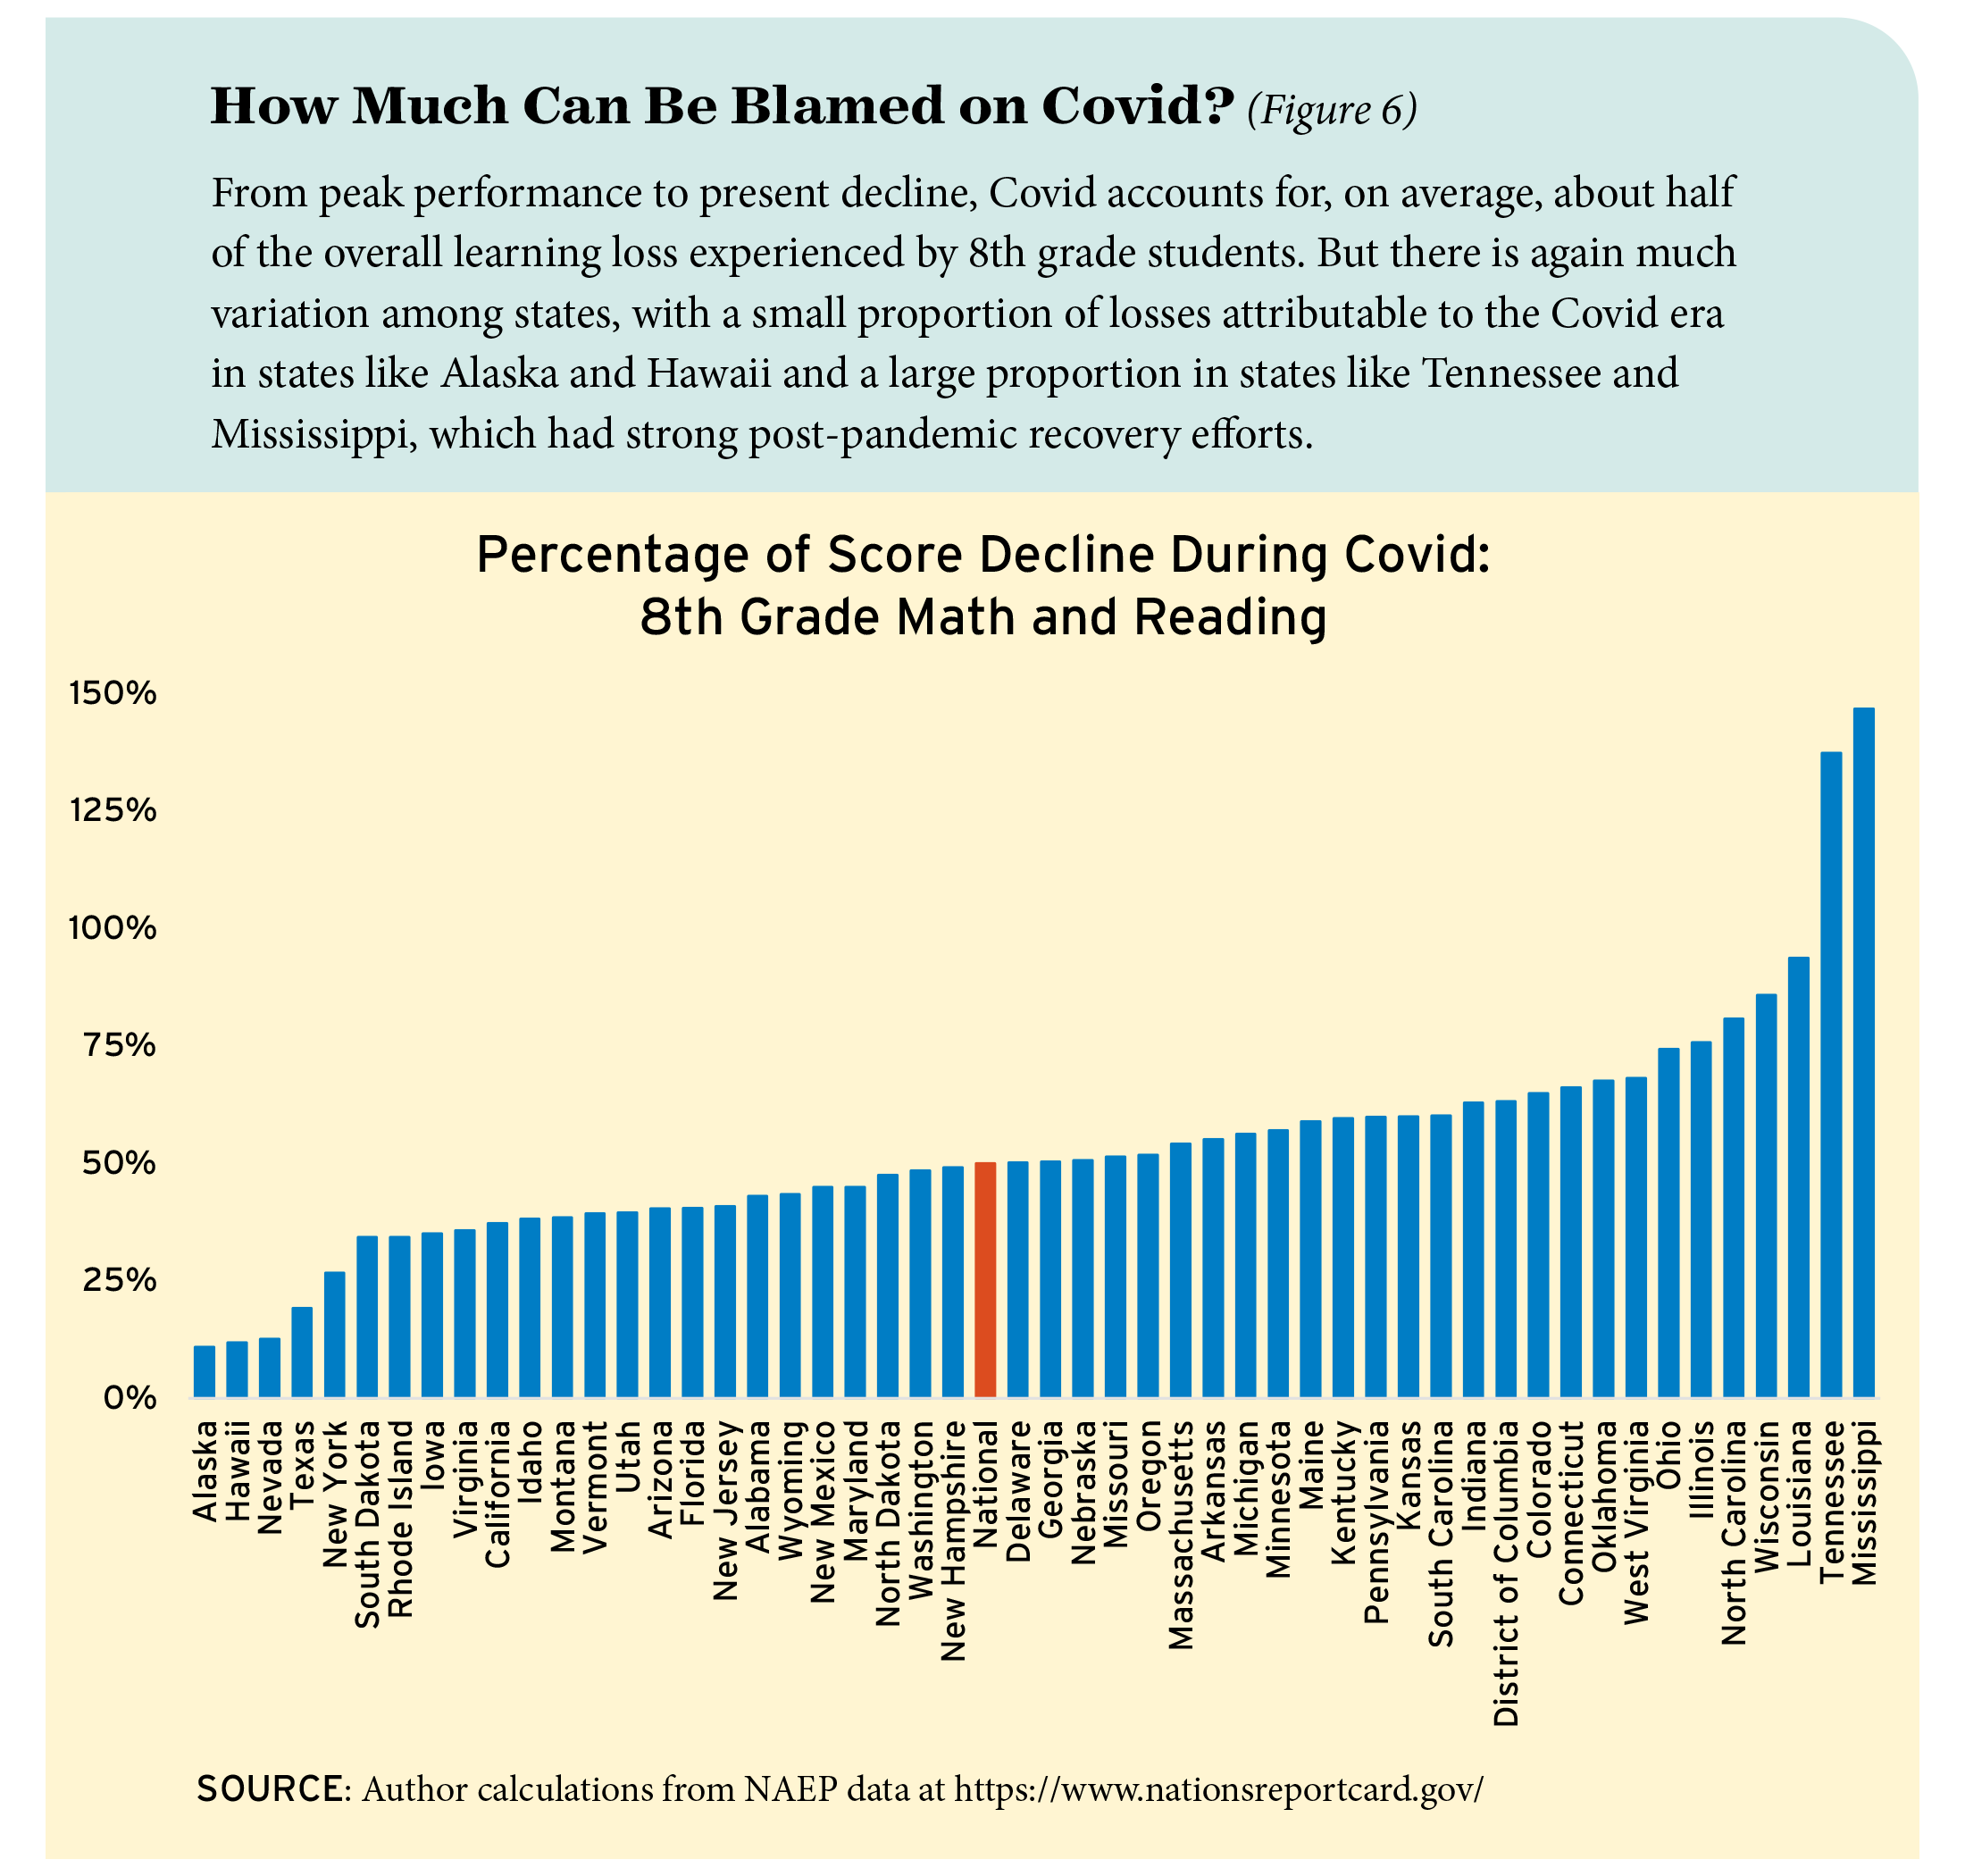
For the median state, the combined math and reading losses during the pandemic period accounted for only half of the total decline in scores from the state’s peak. Here again the states differ sharply, however (see Figure 6). Less than one-quarter of Alaska’s aggregate decline of 0.5 standard deviations from its peak occurred during the pandemic period. In Tennessee and Mississippi, on the other hand, a strong post-pandemic recovery between 2022 and 2024 offset much of the decline in scores from the peak, such that the pandemic-period decline between 2019 and 2022 exceeded the total decline from its peak.
Economic Costs of Learning Declines
The falloff in learning over the past decade will have huge economic costs for individual students, for states, and for the United States as a whole. The importance of these changes may be difficult to grasp when expressed in standard deviations, but it is not hard to understand the economic implications of a workforce with lesser skills. Research confirms that, on average, individuals who know more earn more. It also shows that states and nations with a more skilled workforce—those with greater “knowledge capital”—experience faster economic growth in the long run. The substandard skills of pandemic students will thus result in lower earnings when they enter the labor force, and the depressed earnings will follow them throughout their working life. What’s more, the national economy will grow more slowly than it would have had higher achievement levels been sustained.
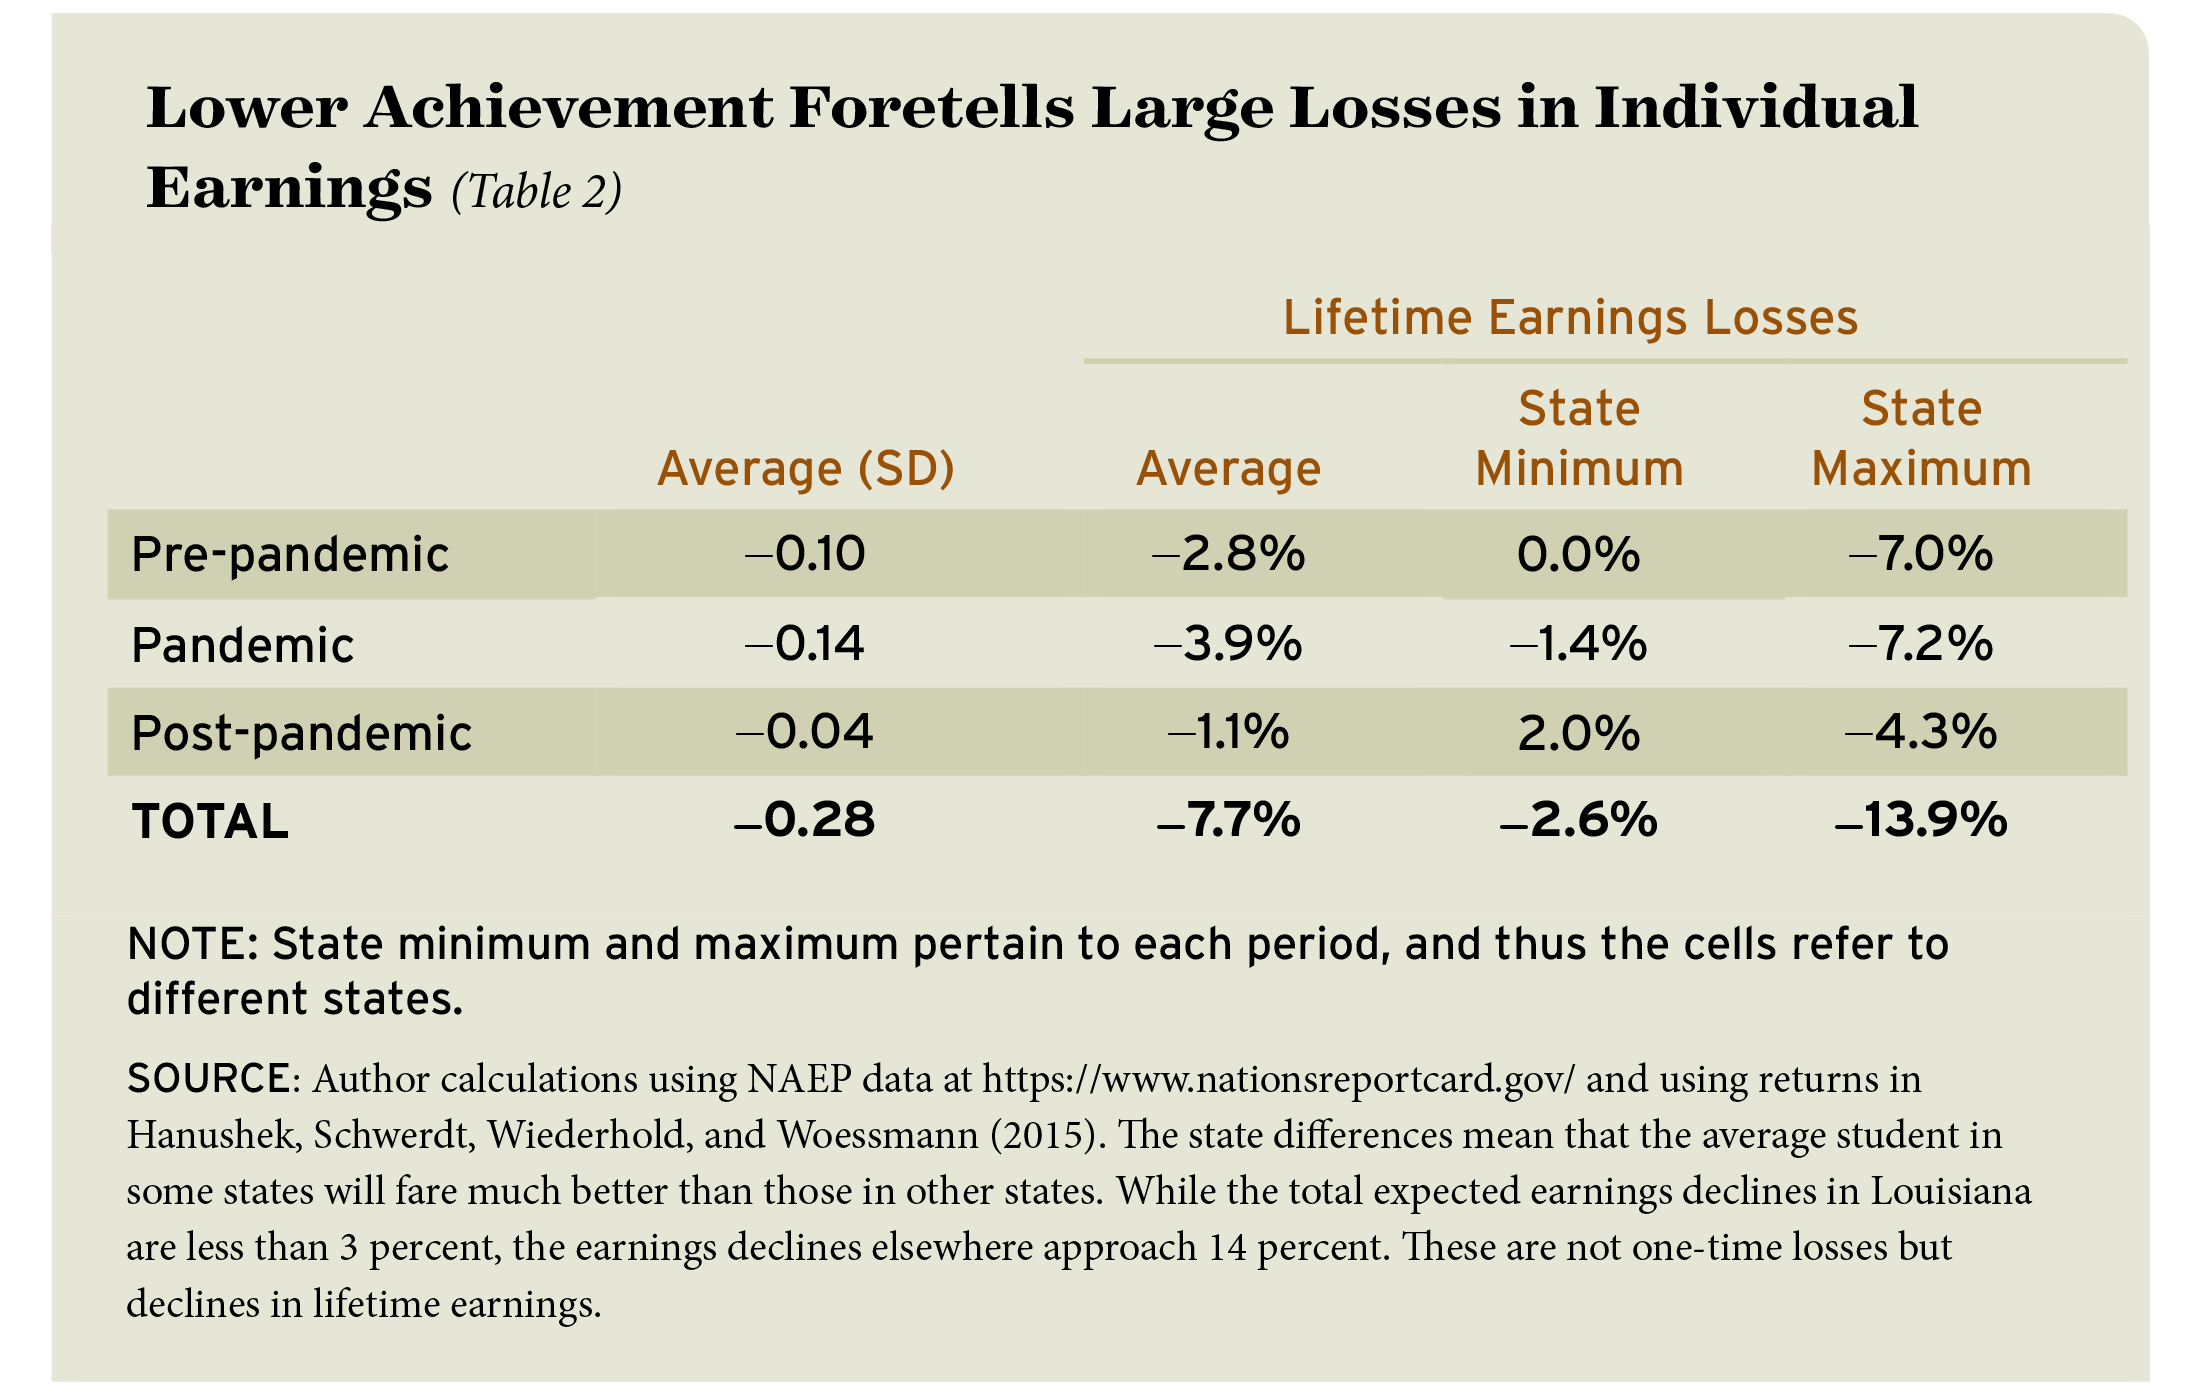
Based on past patterns of how skills affect rewards, recent students can expect their lifetime earnings, on average, to be lower by almost 8 percent (see Table 2). Importantly, the pandemic-period achievement declines are responsible for just half of this projected loss. And this loss will be much larger for our most disadvantaged students, whose average achievement declines after 2013 exceeded those of their more privileged peers.
For the nation as a whole, the expected aggregate costs of the learning declines are sufficiently large to make most current economic and budget policy discussions appear inconsequential. We can use historical relationships to project the growth rate the U.S. economy would have attained had student achievement stayed at its peak. On average, our gross domestic product (GDP) would be 6 percent higher per year for the rest of the century had we maintained 2013 achievement levels. Evaluated in present value terms, the amount of economic growth lost due to the learning declines is approximately three times our current GDP of $31 trillion. This is vastly larger than the aggregate GDP losses incurred during the Great Recession of 2008 recession and the Covid-induced recession of 2020 combined.
It is unlikely that skill deficits for students who have left K‒12 schools will go away because neither postsecondary schools nor businesses have a track record of effective remediation. In other words, the over 50 million students who have left secondary schools since 2013 with varying skill losses are likely to face lifetime income losses.
Because student achievement declines began well before the pandemic, simply returning to immediate pre-pandemic levels would only halve these projected economic losses. That would still leave enormous losses with dramatic implications for individual wellbeing, for government fiscal capacity, and for the global position of the United States. Interestingly, in the early months after the beginning of the pandemic, much of the discussion revolved around the need not just to return to the status quo of pre-pandemic schools but also to make schools better. Indeed, if students only returned to their prior pace of learning, many would be unable to recover unless the length of their schooling were dramatically extended.
Looking to the Past
Concerns about the performance of U.S. students are not new, but the pandemic brought them into high relief. Over the years, educators and policymakers have fielded many public calls for improvement. Perhaps the strongest and most enduring was the 1983 publication of A Nation at Risk: The Imperative for Educational Reform. This report, commissioned by the U.S. Department of Education during the Reagan era and filled with hyperbolic language, was built on an observation that sounds remarkably apt for today: “The time is long past when America’s destiny was assured simply by an abundance of natural resources and inexhaustible human enthusiasm, and by our relative isolation from the malignant problems of older civilizations.” Few would dispute this observation or assert that our schools do not need reform today.
Over the four decades since the publication of A Nation at Risk, policymakers and educators have tried a wide array of strategies to meet the challenges it described. These reforms have included expanded graduation requirements, increased pay for teachers, reduced class sizes, consequential school accountability, expanded preschool opportunities, new curricula and new technologies, alternative governance structures, charter schools and other parental choice options, wraparound services for students, and substantially increased funding. The results have been underwhelming.
A few things stand out in reviewing the policy approaches deployed since A Nation at Risk. First, a majority of the reforms were incremental and isolated, changing one part of the system with little concern about other parts or other reforms. Second, even policy approaches that showed promise were rarely implemented broadly and instead have been allowed to die out or have been sidelined by new reforms.
EdNext in your inbox
Sign up for the EdNext Weekly newsletter, and stay up to date with the Daily Digest, delivered straight to your inbox.
Third, and most importantly, these reforms have not worked. The math performance of 13-year-olds on Long-Term Trend NAEP did increase by 0.3 standard deviations between the early 1980s and 2012—but this gain was almost entirely reversed by the decline since. Comparable 13-year-old reading scores grew by 0.2 standard deviations as of 2012 but fell back to 1975 levels by 2023 and remained just as low in 2025. Four decades of broad reform efforts buoyed by a more than doubling of inflation-adjusted expenditure per pupil find us still confronting the challenges cited in 1983.
What’s more, these efforts have not succeeded at narrowing performance gaps between disadvantaged students and their more affluent peers. Even before A Nation at Risk, President Lyndon Johnson had launched his War on Poverty, singling out education as the long-term solution to socioeconomic disadvantage—a way to address the underlying causes of poverty and not just its symptoms. Achievement gaps by socioeconomic status, when traced from the War on Poverty to the beginning of the pandemic, show no closing. And these gaps have widened further since.
The post-pandemic policy response to this education crisis has focused almost exclusively on the achievement declines that happened during the pandemic, with the implicit assumption that the real challenge lies in helping students get back to the achievement levels of 2019. Many efforts have focused on simply compensating for the instructional time lost during the pandemic and on the disproportionate impacts on low-achieving and disadvantaged students. But the performance data indicate quite clearly that these efforts have fallen short. The headline policies of lengthened school days and years, high-dosage tutoring, and added technological support have either been implemented ineffectively or, when effective, have not been broadly adopted. By most indicators, performance has declined since 2022 despite these efforts.
A Different Perspective
Instead of continuing to tinker within the current structure, we need to rethink how we operate our schools. Education reform efforts over the past half century have aimed to enhance or improve various aspects of the public education system while retaining the essence of its institutional structure. These reforms have included add-ons of various types, regulatory constraints designed to prevent poor outcomes, and expansions of existing operations that, even when viewed as promising, have failed to yield the expected or hoped-for results. Their collective failure accentuates the need to look at the problem differently and to pursue fundamental institutional change.
The dynamics of education policy development further illustrate the problem. Even when a school policy succeeds at scale, with validated performance outcomes, states and school districts have not rushed to adopt it. Consider the incentive-based teacher compensation systems introduced in Washington, D.C., in 2009 and Dallas, Texas, in 2013. These reforms show that when teachers are evaluated and paid based on their classroom effectiveness, student scores increase significantly. Yet, because these innovative incentive systems are alien to the way most districts write contracts and operate, few districts have copied their approaches. It is not that teachers and principals do not want higher achievement but that competing priorities appear to supersede any quest for improved achievement.
Efforts to introduce significant teacher and administrator incentives into schools face strong headwinds, but at times these efforts prevail. The attempt to do so under the U.S. Department of Education’s Race to the Top program, launched in 2009, led to strong backlash and was explicitly prohibited by subsequent legislation. Yet the intense fight to introduce performance pay in D.C. eventually succeeded, leading to strong student-achievement gains—and it has remained in effect under a series of new superintendents. The introduction of altered evaluation and pay systems in Dallas took years of planning and preparation but has also survived multiple new superintendents. Dallas-like systems have in fact expanded in Texas because of grants enabled by the Texas legislature to support any district willing to change its evaluation and pay systems. By 2025, 809 districts—approximately two-thirds of all Texas districts—had applied to participate. Following state takeover, Houston, the largest district in Texas, and several others are moving rapidly to follow.
A structure that incentivizes and more consistently promotes higher achievement will require altered roles for both state and federal policymakers. A recent proposal from the Hoover Institution’s Education Futures Council, for which I was an adviser, provides one example of how the public school system might change. The council’s report highlights the importance of maintaining a focus on student outcomes, incorporating incentives for the desired outcomes, and recognizing that local capacity and local demands vary so much that broad-based mandates and regulations from above thwart innovation. Because schooling is locally administered, the federal role should center on support, not control, including activities such as data collection, research, and incentives to promote innovation and improvement instead of mandates and regulations. States, in turn, should strive to enable local implementation without treating all districts the same. For example, a state could give wide operational latitude to districts that demonstrate high performance while deploying closer constraints and stricter guidance for less successful districts.
If policymakers do choose to revamp our education system, they will have many alternatives available to them, but history suggests that they should favor a new, outcome-based design over small tweaks to our current stagnant system.
Looking Forward
The pandemic has absorbed most of the attention afforded to school policy of late, drawing focus away from the student performance declines that happened earlier but less dramatically. In 2022 the U.S. ranked 34th among participating nations on the math portion of PISA. This places the nation below the OECD average, edging out the Slovak Republic but falling behind Malta. Our economy has performed well for reasons other than the state of our education system. The basic structure of the economy provides a great advantage, and the ability to attract and employ highly educated immigrants, particularly in STEM fields, has significantly strengthened our labor force. But there’s no guarantee that these advantages will continue. Without them, the nation would have to depend on the quality of the labor force it produces, beginning in the public schools.
Improving the performance of our education system will require fundamental changes. A half century’s collection of highly touted marginal changes simply has not worked. We are now in a decade-long decline that, while exacerbated by the pandemic, has been driven by systemic issues.
It is time that we learn from these decades of failed add-ons to a resistant system. Do we really believe that the next minor change will transform it?
Eric A. Hanushek is the Hanna Senior Fellow at the Hoover Institution of Stanford University.
Suggested citation format:
Hanushek, E. A. (2026). “Putting Pandemic Learning Loss in Perspective: Broad achievement declines in 21st-century America demand new policy approaches.” Education Next, 26(2), 11 June 2026.