For the past half century, roughly one in 10 U.S. families has chosen to enroll their children in private school. The reasons behind these decisions are as individual as families themselves: some may perceive the quality of education to be better at a private school than their neighborhood school, some may wish to continue a family tradition or be motivated by religious beliefs, and others may seek specialized programs for a child with a particular interest or learning challenge.
The one factor uniting virtually all of these choices, scholarships aside, is the decision to pay tuition, which averaged $10,940 in 2011. Private schools historically ranged widely in their annual fees; many programs, such as those run by the Catholic Church, were designed to be broadly affordable and offered significant discounts for low-income families. However, the number of Catholic schools has fallen sharply in recent years, while the number of nonsectarian private schools has increased. At the same time, income inequality and residential and school segregation by income have grown.
How have these shifting trends affected private-school enrollment nationwide? Has expanding income inequality led to an increased concentration of affluent families at private schools? If so, has that fueled a broader increase in segregation at both public and private schools?
To explore these questions, we examine enrollment and family-income data from the past 50 years at Catholic, other religious, and nonsectarian private elementary schools (that is, schools serving grades K–8). Our analysis finds that private schools, like public schools, are increasingly segregated by income. In particular, the share of middle-income students attending private schools has declined by almost half, while the private-school enrollment rate of wealthy children has remained steady. Much of the decline among middle-income students is due to falling enrollment at Catholic schools, which have closed in droves in the past 20 years. Meanwhile, private-school enrollment among affluent students has shifted from religious to nonsectarian schools.

Tracking Trends in Private-School Enrollment
The share of U.S. school-age children attending private elementary schools peaked during the postwar boom of the late 1950s and early 1960s, reaching 15 percent in 1958. By the mid-1970s, it had fallen to 10 percent and remained quite steady for the rest of the 20th century. During the subsequent 15 years, it drifted downward slowly and was slightly less than 9 percent in 2015 (see Figure 1).
Those relatively steady numbers since the mid-1970s mask significant changes in the mix of school types that make up the private-school market, driven in particular by widespread closures of Catholic schools. In 1965, 89 percent of American children who attended a private elementary school were enrolled in a Catholic school; in 2013, the comparable figure was 42 percent. By contrast, the percentage of private elementary-school students who attended a non-Catholic religious school increased from 8 percent in 1965 to 40 percent in 2013. During this same period, the percentage of private elementary-school students enrolled in nonsectarian schools increased from 4 percent to 18 percent.
Has the family income mix of students attending each type of private school changed in recent decades? One reason it might have is that inequality in the incomes of American families, which held steady between 1945 and 1975, grew over subsequent decades. Looking at families with children in grades 1 to 8 between 1975 and 2010, the average income, net of inflation, among those in the 10th percentile declined by 11 percent. That of families with incomes in the middle, or 50th percentile, increased by 19 percent. That of relatively affluent families with incomes in the 90th percentile increased by 57 percent.
Methodology
To answer these questions, we assembled data on families’ incomes and elementary-school choices from the decennial census, Current Population Survey, U.S. Department of Education longitudinal surveys, and the National Household Education Survey, and combined them with information from the education department’s Private School Universe Survey and survey data from Phi Delta Kappan.
Some surveys, such as the census, asked respondents to report the individual income for each family member, while others asked parents to place their household income within a set range of dollar amounts. To obtain a common metric, we converted ordinal income categories into percentiles of the national distribution of incomes for families with children enrolled in grades 1 to 8. Our analysis includes incomes from the 1968–69 school year until 2013–14, which we refer to as 1968 and 2013. To remove the effects of inflation, we express all family incomes and private-school tuitions in 2015 dollars.
We do not have enough data points to precisely measure the private-school enrollment rates of families at each income level. For example, the number of families with incomes of exactly $50,000 is too small to calculate a reliable enrollment rate. Instead, we use a statistical model to estimate the relationship between private-school enrollment and the family’s income relative to families nationwide, and then compute the estimated proportion of students enrolled in private school in the relevant year at the 10th, 50th, and 90th percentiles of the income distribution. We refer to these family-income percentiles as low, middle, and high.
In reporting our results, we pay particular attention to changes in the size of the gap in private-school enrollment rates between families at the 90th and 50th income percentiles, which we call the “90-50 gap.” We do this because the growth in income inequality among families with school-age children in recent decades has been overwhelmingly in the top half of the income distribution. For example, among families with children in grades 1 to 8, the 90th percentile income in 1975 of $111,410 was roughly double that of the 50th percentile income of $56,084. In 2013, the comparable 90th percentile income of $183,959 was nearly triple the 50th percentile income of $68,256.

Findings
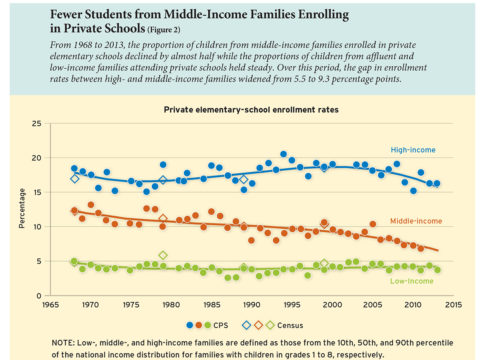
Our analysis finds a strong positive role of family income in predicting private-school enrollment, as well as a marked decline between 1968 and 2013 in the share of students from middle-income families attending private schools (see Figure 2). For example, in 1968, 18 percent of elementary-school-age children from high-income families attended a private school, compared to 12 percent of children from middle-income families and 5 percent of children from low-income families. In 2013, the percentage of children from middle-income families had declined by almost half, to 7 percent, while the percentage of children from high-income families remained roughly steady at 16 percent. As a result, the 90-50 gap in private elementary-school enrollment rates grew from 5.5 percentage points in 1968 to 9.3 percentage points in 2013.
Much of the expanded 90-50 gap is due to declining enrollment at Catholic private schools, which historically served large numbers of children from low- and middle-income families. In addition, growth in the gap among students at private nonsectarian elementary schools has been particularly large, almost entirely due to a substantial increase in the enrollment rate of children from high-income families.
We also find that private-school enrollment rates are much higher among middle- and high-income families living in cities than among families with similar income levels living in suburbs, and that the 90-50 gap grew more among urban families than among suburban families. In addition, on the whole, private-school enrollment rates are lower for black and Hispanic families than for white families, but differences in family income account for a large part of those differences.
Finally, we find that private-school enrollment trends differ dramatically by region: the percentage of students from high-income families enrolled in private school increased in the South and West and decreased in the Northeast and Midwest. The 90-50 gap grew much more in the South than in other regions.
School Type: While the private elementary-school enrollment rate for children from high-income families remained stable overall, many affluent families have shifted from religious to nonsectarian schools over the last four decades. And while the private-school enrollment rates for children from middle- and low-income families declined due to decreasing Catholic school enrollment rates for these groups, those declines were somewhat offset by increases in their enrollment at other private religious schools.
Private nonsectarian elementary schools serve a small percentage of the nation’s students, but a growing share of high-income students. Just 1 percent of middle-income students enrolled in those schools in 1969, and the percentage grew slightly to between 1 and 2 percent in 2011. But the enrollment rate among high-income families grew from 2 percent in 1969 to 6 percent in 2011. As a result, the 90-50 enrollment rate gap grew from 1 percentage point in 1969 to almost 5 percentage points in 2011.
We also analyzed enrollment trends at Catholic elementary schools, looking closely at the period from 1987 to 2011. Enrollment rates for students from families in the bottom half of the income distribution fell slowly but steadily over those 24 years. Among middle-income students, the enrollment rate in Catholic schools fell from 7 percent to 3 percent in 2011. Meanwhile, the enrollment rate for high-income families declined by only 1 percentage point, from 11 percent to 10 percent. As a result, the 90-50 gap in enrollment rates grew from 4 to almost 7 percentage points.
At non-Catholic religious elementary schools, enrollment over the same 24-year period diverges from the trends elsewhere. Enrollment for children from middle-income families increased from 3 percent to 4 percent, while that of children from high-income families declined from 6 percent to 5 percent. As a result, the 90-50 gap in enrollment rates in non-Catholic religious elementary schools in 2011 was half the size of the comparable gap in 1987.
Race: We looked at enrollment rates for white, black, and Hispanic students overall, as well as among low-, middle-, and high-income families in each group. On the whole, enrollment for white students decreased from 16 percent in 1959 to 11 percent in 2013. Enrollment decreased far more dramatically for Hispanic students, dropping from 13 percent enrolled in private schools to 3 percent. By contrast, the private-school enrollment rate increased among black students, from 3 percent to 5 percent.
These trends could reflect shifts in each group’s income distribution or changes in the overall private-school enrollment rates by family income. Black and Hispanic families were less concentrated in the bottom 10 percent of the income distribution in 2013 compared to 1969, so we might expect their private-school enrollment rates to rise even if enrollment rates among families at each level of income remained constant. This is why it is important to examine trends in private-school enrollment rates for black and Hispanic families at particular points in the national family-income distribution.
In 1969, just under 2 percent of black children from low-income families attended private elementary schools. This rate rose slowly over the next four decades, reaching 4 percent in 2013 (see Figure 3). Enrollment for black children from middle-income families was steady, at 5 percent in 1969 and 6 percent in 2013. In contrast, the private-school enrollment rate for black students from high-income families increased from 11 percent in 1969 to more than 16 percent in the mid-1990s. Subsequently, this rate fell slightly, to 14 percent in 2013. The net effect of these trends is that the 90-50 gap among black students in 2013 was 8 percentage points, slightly larger but not statistically different from the comparable gap of 6 points in 1969.

Hispanic children were less likely to enroll in private school overall in 2013 than in 1969 (the first year with data available for Hispanic student enrollment), with the steepest decline among middle-class families, whose rates fell from 15 percent to 3 percent. However, the decline was modest for children from high-income families, falling from 18 percent to 15 percent, and the 90-50 gap among Hispanic families grew from 3 points in 1969 to 12 points in 2013.
Community Type: In 1968, 19 percent of children living in cities and 13 percent of those living in suburbs attended a private elementary school. Over the next half century, both percentages declined, to 10 percent of city dwellers and 8 percent of suburban children. Among high-income urban families during those years, the share of children enrolled in private school peaked at 30 percent in 1989 and was 24 percent in 2013 (see Figure 4a).
For middle-income families living in the suburbs, the private-school enrollment rate fell from 11 percent in 1968 to 6 percent in 2013. The comparable enrollment rate for children from high-income suburban families remained steady, between 15 and 18 percent, from 1968 until recently, but fell in the years following the onset of the Great Recession. As a result of that decline, the 90-50 gap among suburban families was the same in 2013 as it had been in 1968: 7 percentage points.
We also find declines in overall private-school enrollment rates among families living in the Northeast and Midwest during the study period. The rates fell by roughly half, from 22 percent to 10 percent in the Northeast and from 16 percent to 9 percent in the Midwest. Meanwhile, those in the South and West held steady at around 7 percent. Looking at enrollment by family income, in the South, the enrollment rate of children from high-income families actually increased from 14 percent in 1968 to 19 percent in 2013. We find a gap of 14 percentage points in 2013 between the private-school enrollment rates of children from high- and middle-income families—twice as large as the comparable gap in 1968 (see Figure 4b).

Explaining the Patterns
We consider a number of potential explanations for the trends that we observe in private-school enrollment. We do not claim to present evidence of causation; rather, our potential explanations are hypotheses supported by descriptive evidence, which we offer to motivate future research.
One major explanation for these patterns is the widespread closures of Catholic schools, which had relatively low tuitions and were concentrated in the Northeast and Midwest. Due to a decline in the number of clergy and members of religious orders, who provided low-cost teaching services, as well as financial and other pressures related to public disclosures of long-standing sexual-abuse issues in the church, the number of Catholic elementary schools in the U.S. declined by 37 percent between 1970 and 2010.
The Catholic elementary schools that remain open are more expensive, with an average tuition in 2010 of $5,858 (in 2015 dollars), which is more than six times the average tuition of $873 in Catholic elementary schools in 1970. During this period, middle-income families with elementary-school-age children experienced an average real-income increase of 23 percent, while the average real income of low-income families with children declined by 22 percent. Though average tuition rates do not reflect scholarships and other discounts, these averages and income trends may help explain why Catholic elementary schools increasingly serve affluent students.
Meanwhile, since the late 1970s, tuitions at other types of private schools also have increased more rapidly than median incomes. The average inflation-adjusted tuition in nonsectarian private elementary schools increased from $4,120 in 1979 to $22,611 in 2011. Given the high tuitions in nonsectarian private elementary schools, it is not surprising that enrollment in these schools rose faster among students from high-income families than among those from low-income families, or that the 90-50 enrollment gap increased substantially.
Tuitions have also increased substantially in non-Catholic religious elementary schools in recent years. In 1993, the average inflation-adjusted tuition was $3,896; that nearly tripled by 2011, to $9,134. It is therefore surprising that the 90-50 enrollment gap did not increase between 1987 and 2011.
Another relevant factor for families’ decisions is the perceived quality of the public schools with which private schools compete. One mark of comparison is student performance on the National Assessment of Educational Progress (NAEP), where the difference between the average math scores of public and private 4th-grade students declined markedly between the 1990s and 2011. This could explain why the percentage of elementary-school students attending private schools declined slightly during this period.
But these patterns differ between cities and suburbs. Average math and reading scores on NAEP are considerably lower for public-school students in cities compared to those in suburban schools, in part due to residential segregation by income. Suburban families give their schools better ratings, too: annual survey data from Phi Beta Kappan show that more families in the suburbs rated their local public schools an “A” or “B” throughout the 1980s and early 1990s than urban parents at the same income level. Further, high-income suburban parents gave their local schools better ratings than low-income suburban parents, likely reflecting the greater capacity of high-income parents to move to communities with high-quality public schools. In contrast, high-income parents living in cities did not rate their local public schools more favorably than lower-income urban parents, which helps to explain why high-income urban parents are more likely than affluent suburbanites to send their children to private school.
The striking differences across regions in private-school enrollment trends may reflect regional differences in the composition of private-school enrollment. Private-school enrollment in the South was not substantially affected by Catholic school closures; it was affected by white flight following school desegregation orders. In addition, the South is home to a significant number of conservative Christian families, and Supreme Court decisions banning prayer in schools may explain the increasing percentage of middle-income families sending their children to non-Catholic religious elementary schools. Interestingly, the percentage of high-income families in the South who sent their children to non-Catholic religious elementary schools declined over this same period, and the 90-50 gap in enrollment rates in other religious elementary schools narrowed.
Implications
The distribution of private elementary-school enrollments in the U.S. has changed dramatically over the last 45 years. Today, non-Catholic religious elementary schools serve more low-income students than Catholic elementary schools do. Meanwhile, the percentage of students from high-income families who attend private nonsectarian schools has grown substantially. Much less is known about nonsectarian private schools than about Catholic schools, which historically were the dominant supplier of private-school services in the U.S. and the subject of a great deal of research.
Given that less than 10 percent of American children attend a private elementary or secondary school, why should we care if gaps by family income in private-school enrollment rates have grown? Relative to residential mobility patterns, trends in private-school enrollment play only a modest role in explaining increases in school segregation by income. But that role is not inconsequential, and could be important for two additional reasons.
First, if the private schools affluent families choose for their children provide a better education than the schools available to children from lower-income families, these choices pass on economic advantage to the next generation and undercut the potential for intergenerational economic mobility. Second, it is possible that well-educated affluent parents who send their children to private schools may be less interested in devoting their political and social capital to advocating for better public schools.
What can the data tell us? We know that the percentage of American children attending private elementary schools has declined from 15 to less than 9 percent in recent decades, and that Catholic schools and nonsectarian private schools increasingly serve students from high-income families. It is more difficult to judge whether these shifts in enrollment have contributed to gaps in educational outcomes. If average per-student expenditure is an indicator of instructional quality, this may be the case. The 90-50 enrollment rate gap has increased the most in nonsectarian elementary schools, which are more than twice as expensive, on average, as religious schools. However, middle-income parents pay less than high-income parents who enroll their children in private school, due not only to scholarship assistance but also to the relative costs of the schools these types of families choose. We know of no evidence about whether more-expensive private schools are more effective than less-expensive schools, though the choices of affluent families suggest that they believe they are.
The key trends identified by our analysis have troubling implications. As a result of growing residential segregation by income, low-income families are increasingly concentrated in urban areas. In such places, one quarter of high-income families enroll their children in private schools compared to a much smaller—and declining—proportion of middle- and low-income families. As a result, both urban public schools and urban private schools have less socioeconomic diversity today than they had several decades ago.
Higher-income families increasingly live either in the suburbs or enroll their children in private schools. Moreover, the private schools their children attend are more likely to be expensive nonsectarian schools than was the case four decades ago. Together, these trends indicate an increasingly polarized pattern of school enrollment. As a result, American schools—both public and private—are increasingly segregated by income.
Richard J. Murnane is Thompson Research Professor at the Harvard Graduate School of Education and a research associate at the National Bureau of Economic Research. Sean F. Reardon is the Professor of Poverty and Inequality in Education at Stanford University and a senior fellow at the Stanford Institute for Economic Policy Research. Preeya P. Mbekeani and Anne Lamb are doctoral students at the Harvard Graduate School of Education.
This article appeared in the Fall 2018 issue of Education Next. Suggested citation format:
Murnane, R.J., Reardon, S.F., Mbekeani, P.P., and Lamb, A. (2018). Who Goes to Private School? Long-term enrollment trends by family income. Education Next, 18(4), 58-66.